Fatima Albloushi | Idrees Al-Momani* | Faisal Alshuraifi | Ahmed Alsaberd | Adeeba Al-Herz | Amera Otoum | Ghaydaa Aldabie | Khulood Saleh | Adel Al-Awadhi | Eman Hasan | Waleed Al-Kandari | Aqeel Ghanem | Hoda Tarakmeh | Yaser Ali | Amal Anbar
© 2026 The authors. This article is published by IIETA and is licensed under the CC BY 4.0 license (http://creativecommons.org/licenses/by/4.0/).
OPEN ACCESS
Rheumatoid arthritis (RA) flares contribute to progressive joint damage, disability, and increased healthcare utilization, emphasizing the need for continued disease monitoring. The influence of short- and long-term air pollution on RA activity remains inconclusive. This study investigates three key areas: (1) temporal changes in weather conditions in Kuwait City, (2) the association between CO₂ concentrations and RA activity in heavily polluted regions, and (3) seasonal variations in RA activity linked to climate-related factors. Using IBM SPSS (version 25), descriptive statistics were applied to patient demographics, CO₂ levels, and seasonal meteorological indicators. Pearson correlation, lagged exposure analysis, moving average models, and principal component analysis (PCA) were used to assess the relationship between environmental variables, temperature, humidity, wind speed, and wind direction and RA indices across five regions. Stepwise multiple linear regression was employed to identify predictors of RA activity, including CO₂ and particulate matter (PM₂.₅). Data from the Kuwait registry for Rheumatic Disease (KRRD) include 850 patients enrolled between 2020 and 2022. These patients accounted for 13,118 clinical visits over the three-year study period. The analysis presented in this study is based on this patient cohort, selected for the completeness and quality of their data. The results demonstrated statistically significant but generally weak associations between environmental variables and RA disease indices. However, lagged analysis revealed more consistent relationships at short-term delays, particularly 2-3 days before the clinical assessment, while moving average models indicated that cumulative short-term exposure provided more stable estimates compared to single-day exposure. PCA-based models further improved interoperability by capturing combined environmental patterns rather than isolated variables.
rheumatoid arthritis, air pollution, CO2, climate change, health-wellbeing, rheumatoid factor, environment
1.1 General overview
Rheumatoid arthritis (RA) is a multifaceted autoimmune disorder characterized by chronic inflammation, progressive joint damage, and long-term disability, often requiring continuous medical care. In recent years, increasing attention has been given to the potential association between air pollution and RA disease activity. The health effects of both short- and long-term exposure to air pollutants remain a subject of ongoing debate and investigation [1]. Air pollution refers to the presence of harmful substances in the atmosphere that pose risks to human health, ecosystems, and overall well-being. These pollutants, which may be natural or anthropogenic in origin, exist in various forms, including gases and particulate matter, as well as solid or liquid particles suspended in the air [2]. Natural events such as volcanic eruptions, dust storms, and wildfires contribute to pollution levels; however, human activities such as industrial production, vehicular emissions, power generation, and agriculture are major sources of air contaminants [3, 4]. Kuwait’s geographic and climatic characteristics, marked by an arid environment, limited vegetation cover, frequent dust storms, rapid urbanization, and extensive oil-related industrial activity, render the country especially vulnerable to poor air quality. These conditions intensify the effects of environmental pollution, particularly in densely populated and industrial zones.
RA itself is a chronic autoimmune and inflammatory condition wherein the immune system erroneously targets healthy tissues, most commonly affecting the joints of the hands, wrists, and knees [5]. This immune response leads to synovial inflammation, pain, joint deformity, and progressive physical disability and may also involve systemic complications affecting organs such as the lungs, heart, and eyes [6]. As a significant global public health issue [7], RA's etiology remains uncertain, though several risk factors such as age, gender, smoking, genetics, family history, and obesity have been consistently associated with increased disease susceptibility [8].
Beyond the biological and genetic components, environmental exposures, particularly air pollution, are increasingly recognized as contributing to the development and progression of RA. Research indicates that smoking and occupational pollutants may promote lung inflammation and the early formation of RA-related autoantibodies, even before the onset of clinical symptoms [9]. The complications arising from RA, including cardiovascular disease, osteoporosis, and disability, can severely impact patients’ quality of life and work capacity [10]. Therefore, current management strategies emphasize early diagnosis, tight disease control, and treat-to-target approaches to achieve remission and minimize long-term damage [11], especially since uncontrolled RA is linked to higher healthcare costs, increased disability, and reduced quality of life [12].
1.2 Factors affecting rheumatoid arthritis
Environmental factors, especially air pollution, are believed to significantly contribute to the development of autoimmune diseases like RA. Evidence shows that smoking and occupational exposure increase RA risk, potentially by triggering lung inflammation and autoantibody production before disease onset [9]. Epidemiological studies and experimental models support a link between air pollution and RA, with diesel exhaust exposure shown to increase RA severity in animals [13, 14]. Air pollution, mainly from fossil fuel combustion, includes diverse harmful gases and particles implicated in immune-related diseases [15, 16]. The scientific community continues to debate its role in autoimmune disorders, though industrialized areas consistently show higher rates of cardiac, respiratory, and autoimmune conditions [4, 9, 13].
1.3 Rheumatoid arthritis activity indexes
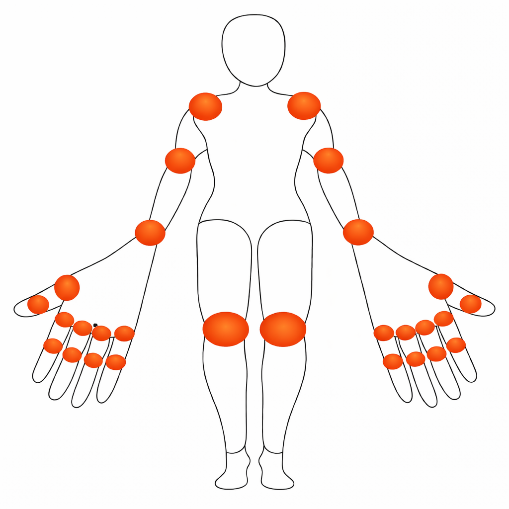
RA is a chronic autoimmune disorder affecting joints, making accurate assessment of disease activity essential (Figure 1). The Disease Activity Score 28 (DAS28) is a widely used tool for this purpose [17]. It combines four components: Tender Joint Count (TJC), Swollen Joint Count (SJC), inflammatory markers (ESR or CRP), and the Patient Global Assessment (PGA). These elements help classify RA activity into remission, low, moderate, or high levels, guiding treatment decisions and evaluating therapeutic outcomes. DAS28 is also crucial in clinical trials for assessing new interventions.
Figure 1. Schematic representation of the 28 joints included in the Disease Activity Score 28 (DAS28) used to assess disease
1.3.1 The Clinical Disease Activity Index
The Clinical Disease Activity Index (CDAI) is a valuable tool in rheumatology for assessing disease activity in patients with RA. This index employs a straightforward calculation based on four clinical parameters. Notably, three of these parameters, TJC, SJC, and PGA, are also used in the DAS28. The fourth parameter, the Physician Global Assessment (PhGA), requires the physician to rate the patient's disease activity on a numerical scale ranging from 0, indicating the best condition, to 10, indicating the worst condition [18].
The formula for calculating CDAI is as follows:
$\mathrm{CDAI}=\mathrm{TJC}+\mathrm{SJC}+\mathrm{PGA}+\mathrm{PhGA}$
The resulting CDAI score comprehensively measures disease activity in RA. Generally, lower scores correspond to lower disease activity, whereas higher scores reflect increased disease activity.
1.3.2 The Simple Disease Activity Index
In addition to the CDAI, the Simple Disease Activity Index (SDAI) serves as another tool for assessing disease activity in patients with RA. The SDAI is slightly more comprehensive than the CDAI, incorporating additional laboratory values. Like the CDAI, the SDAI includes the same clinical parameters: TJC, SJC, PGA, and PhGA. The C-reactive protein (CRP) level (in mg/dL) and the erythrocyte sedimentation rate (ESR) (in mm/hr) are two lab tests that make the evaluation better.
The formula for calculating SDAI is:
$\mathrm{SDAI}=\mathrm{TJC}+\mathrm{SJC}+\mathrm{PGA}+\mathrm{PhGA}+\mathrm{CRP}+\mathrm{ESR}$
Similar to the CDAI, lower SDAI scores typically indicate lower disease activity, while higher scores suggest increased disease activity. Specifically, the interpretation of SDAI scores is as follows: an SDAI of less than 3.3 indicates remission, scores up to 11 indicate low disease activity, scores between 11 and 26 indicate moderate disease activity, and scores greater than 26 signify high disease activity. Furthermore, the response to therapy is categorized as moderate if the SDAI decreases by seven or more points and as major if the decrease is 17 points or more.
PM2.5 refers to particulate matter with diameters of fewer than 2.5 micrometers, posing considerable health risks, including respiratory and cardiovascular ailments. A declaration that PM2.5 levels are "2.9 times higher" underscores a significant rise in pollution and the immediate need for public health measures [19]. Robust strategies are crucial for alleviating these health hazards and improving air quality [20, 21]. Kuwait City is known for its heavy industrial activity, which has resulted in significant air quality concerns. The World Health Organization (WHO) has set a recommended limit for 24-hour air quality guidelines, but the current concentration of PM2.5 in the area is 2.9 times higher. Kuwait's hot, arid climate and frequent dust storms, which contribute to overall air quality degradation, worsen the already poor air quality [22].
Although prior research highlights the link between air pollution, weather conditions, and public health, few studies have directly connected these environmental factors to RA [23-26]. This study addresses that gap by examining (1) the temporal variation of meteorological elements (temperature, humidity, wind, CO₂) in Kuwait City, (2) the correlation between CO₂ levels and RA incidence in polluted areas, and (3) seasonal changes in RA activity in relation to climate dynamics.
Kuwait's PM2.5 levels exceed WHO standards by 2.9 times, primarily due to industrial operations, traffic emissions, and dust storms [17, 18, 22]. Kuwait City and Ali Sabah Al-Salem have PM2.5 levels nearly four times higher than U.S. benchmarks, with SO₂ and NO₂ rising during winter and ozone peaking in summer [18]. Climate change, driven by fossil fuel CO₂ emissions, intensifies these trends and contributes to ecosystem stress [24, 25, 27]. Environmental exposure to pollutants such as ozone, NO₂, PM10, and PM2.5 is associated with increased RA risk and higher mortality, according to several meta-analyses [21, 28-32]. This study proposes a cross-sectional and longitudinal approach to investigate the link between pollution trends and RA cases, aiming to guide public health interventions in Kuwait’s high-risk zones.
Pollution assessments across ten Kuwaiti locations revealed that motor vehicles and the oil industry are the primary contributors to NO₂, benzene, SO₂, and toluene emissions [18]. Seasonal atmospheric conditions like winter inversions exacerbate pollutant accumulation. Alsaber et al. [17] reported persistently high PM2.5 levels (2017–2019) in residential areas near industrial sites, underscoring the urgent need for mitigation policies.
2.1 Climate change fluctuations
This study examines the interplay between climate change, air pollution, and public health, with a specific focus on Kuwait. Climate change exacerbates air pollution, a mixture of harmful substances from both natural and human-made sources that frequently exceed national safety thresholds, especially in industrial and traffic-heavy regions [19-21]. Previous studies in Kuwait have highlighted links between environmental conditions and health outcomes, including RA [23, 26].
Rising carbon dioxide levels, largely due to fossil fuel use, have intensified global warming and the greenhouse effect [20, 22, 24, 25]. The Global Carbon Budget 2022 reports a surge in annual CO₂ emissions from 11 billion tons in the 1960s to 36.6 billion tons in 2022 [25]. Consequences include altered precipitation, sea-level rise, and extreme weather events with direct health implications [28]. Research shows that chronic exposure to high CO₂ levels (> 400 ppm) may impair protein function [29, 30]. Kabir et al. [31] warned of environmental degradation from industrial waste and emissions, which undermine green infrastructure and long-term health resilience. Additional studies connect climate and pollution-related exposures such as NO₂, SO₂, and PM10 with autoimmune diseases, asthma, and heart conditions [21].
A meta-analysis by Di et al. [32] established a strong correlation between RA and exposure to traffic pollutants and ground-level ozone. Similarly, juvenile lupus cases showed increased renal complications from particulate matter exposure, while Kabir et al. [31] found a 22% increase in all-cancer mortality per 10 µg/m³ rise in PM2.5. These cancers include lung, digestive, breast, and female reproductive cancers, likely due to DNA replication damage.
2.2 Impact of air pollution on the development of rheumatoid arthritis
Numerous studies have explored the link between environmental factors, especially climate change and air pollution, and RA activity. Beyond genetic and lifestyle factors, emerging evidence suggests that elevated CO₂ levels and climate variability may influence RA progression [32-34]. A longitudinal study of 133 patients in Belfast found a significant association between increased sunshine and reduced RA disease activity (DAS28, p = 0.001), while higher humidity was linked to worsened symptoms (p = 0.016); temperature had no significant effect (p = 0.16) [24]. Similarly, a Chinese study from 2014 to 2017 associated temperature drops with increased RA-related hospitalizations, particularly among women aged 41-65. In Italy, Ingegnoli [24] studied 422 RA patients and found that short-term exposure to PM10 and NO2 increased RA activity, while ozone exposure had an inverse relationship. The effects varied based on patients' treatment regimens. In Kuwait, a study involving 1,651 RA patients and 9,875 follow-up visits (2013–2017) found significant associations between disease activity and exposure to SO2 and NO2 (p = 0.003), reinforcing the harmful impact of air pollution on RA [22, 23].
3.1 Study design and data sources
Data analysis was conducted using IBM SPSS software (version 25) to perform a descriptive study of patient demographics, CO2 levels, PM2.5 levels, and seasonal climate characteristics. Pearson correlation coefficients were calculated to examine relationships among temperature, humidity, wind speed, and wind direction across the five regions. Stepwise multiple linear regression analyses were also used to examine the relationships between RA indices and factors such as CO2 levels, particulate matter (PM2.5), and weather data [17, 35]. This comprehensive approach aims to elucidate the interactions between environmental factors and RA, contributing valuable insights into potential public health implications.
This study employed a retrospective longitudinal design to analyze RA patients using data from the Kuwait Registry for Rheumatic Diseases (KRRD) collected between 2020 and 2022. The patient data encompassed visits from individuals at six major government hospitals (Amiri, Jahara, Farwaiya, Sabah, Jaber, and Mubarak), strategically selected to represent the ethnic diversity of the population across different governorates in Kuwait. A total of 850 RA patients were included in this study, contributing 13,118 hospital visits during the study period (2020–2022). This single cohort was used for all analyses, including temporal trend analysis and environmental correlation.
3.2 Inclusion and exclusion criteria
The patients were included in this study if they met the following criteria: (1) confirmed diagnosis of RA according to the ACR/EULAR 2010 classification criteria, (2) age ≥ 18 years, (3) at least two clinic visits during the study period (2020–2022), (4) complete documentation of DAS28, CDAI, and SDAI scores at each visit, and (5) residential address within one of the five governorates with available methodological monitoring stations. In addition, exclusion criteria were: (1) pregnancy during the study period, (2) concomitant autoimmune diseases (e.g., systemic lupus erythematosus, psoriatic arthritis), (3) change in disease-modifying anti-rheumatic drug (DMARD) or biologic therapy within 4 weeks before assessment, and (4) incomplete environmental exposure data for their residential area.
3.3 Meteorological and air pollution data
The Central Statistical Bureau of the State of Kuwait acquired meteorological data from five monitoring stations to complement the patient data. This data collection spanned five governorates: Shuwaikh, Salam, Rumaithiya, Jahara, and Fahaheel, focusing on key parameters such as wind speed (m/s), wind direction (degrees), temperature (℃), and relative humidity (RH%). Data were collected from 2020 to 2022 over three years, and carbon dioxide levels were recorded. The monitoring instruments collected data hourly, which was subsequently averaged to derive daily values. It is important to note that while comprehensive data were collected, some sites experienced gaps due to equipment malfunctions, resulting in missing data for two or more consecutive months.
KRRD collected detailed health and demographic information on RA patients visiting the hospitals. A standardized form was utilized to document each patient's health status, resulting in a dataset comprising 850 patients with a total of 13,118 visits during the study period. The activity of RA was assessed using three indices: the DAS28, the CDAI, and the SDAI. Detailed methodologies for calculating these indices are provided in the introduction. Demographic and clinical information were also systematically gathered. This included the VAS, rheumatoid factor (RF), anti-citrullinated peptide antibody (Anti-CCP), antinuclear antibody (ANA), nationality, number of visits, and name of the hospital. To analyze the relationship between patients' health conditions and meteorological data, accurate data matching was essential. Patient visit dates were aligned with corresponding meteorological conditions, revealing variability in patient visits, with some days recording no visits while others had multiple visits.
The DAS28 value was calculated for each patient, with a threshold of ≥ 3.2 indicating active RA, recorded as "Yes," while values below this threshold were marked as "No." The data underwent statistical analysis using logistic regression, suitable for the categorical nature of the outcome variable. The DAS28 scores served as the dependent variable, while meteorological data and carbon dioxide concentrations were treated as independent variables. Logistic regression tests were performed for each region individually, revealing no significant differences across regions. This finding suggests that climatic conditions are homogeneous in Kuwait due to its relatively small geographic area. To maximize the dataset's utility, one site was selected to represent the others in cases of significant missing data. It is important to note that the dataset is not fully complete across all study sites. Several meteorological stations experienced equipment malfunctions, leading to data gaps of two months or more in certain locations. Additionally, some sites exhibited extensive missing data, which may have introduced bias, particularly in regional comparisons. To address this and to maximize the available data for analysis, the dataset from one representative site was used as a proxy for others. Moreover, since patient attendance was often inconsistent often affected by seasonal travel or irregular clinic visits, some patient data were also incomplete. For clarity and consistency in data presentation, only two sub-regions, Al-Salam and Fahaheel, which had more stable data trends, are included in some figures.
3.4 Exposure-outcome matching and lag analysis
To ensure appropriate alignment between environmental exposure and the clinical assessment of RA activity, exposure-outcome matching was refined to account for potential temporal mismatch. Environmental variables in this study were recorded as daily averages, whereas RA activity indices were measured at the time of clinical visits. Therefore, relying solely on same-day exposure (lag 0) may not adequately capture the biological response to environmental stimuli.
To address the limitation, multiple exposure windows were defined. First, same-day exposure (lag 0) was retained as a baseline comparison. Second, lagged exposure variables were generated to represent environmental conditions occurring 1 to 7 days before the clinical visit (lag 1-lag 7). For each visit date (t), environmental data from the previous days (t-1 to t-7) were matched to RA indices, enabling the assessment of delayed effects. This approach is biologically justified, as inflammatory responses underlying RA activity may require several hours to days to develop following environmental exposure.
In addition to single-day lagged exposure, cumulative exposure metrics were constructed using a moving average. Specifically, 3-day (MA3), 5-day (MA5), and 7-day (MA7) moving averages were calculated as the mean of environmental variables over consecutive days preceding the clinical visit. These moving average models were included to evaluate whether sustained or repeated exposure provides a more stable and relevant measure of environmental influence compared to isolated daily values.
Given the potential for multicollinearity among environmental variables (e.g., temperature, humidity, and air pollutants), principal component analysis (PCA) was applied to standardized variables (Z-scores) before regression analysis. PCA reduces dimensionality by transforming correlated variables into a set of orthogonal components that capture the major patterns of variability. In this study, the first two principal components (PC1 and PC2) were retained based on variance explained and interpretability. Thus, for lag (0–7 days), linear regression models were constructed:
$R A_t=\beta_0+\beta_1 \cdot P C 1_{t-k}+\beta_2 \cdot P C 2_{t-k}+\varepsilon$
where, $t$ is the visit date, $k$ is lag (0-7 days), $\beta$ is the coefficient, and $\varepsilon$ is the residual. Separate models were fitted for DAS28, SDAI, CDAI, and VAS.
These components were subsequently used as predictors in regression models across different lag structures. By integrating same-day exposure, lagged variables, moving average metrics, and PCA-based modeling, this analytical framework enables a comprehensive assessment of both immediate and delayed environmental effects while reducing redundancy among predictors and improving model stability. Finally, to account for multiple comparisons, the false discovery rate (FDR) was controlled using the Benjamini-Hochberg procedure. Adjusted p-values (q-values) were calculated and reported alongside the original p-values.
4.1 Patient demographic and clinical data
A total of 850 patients were included in the study, with an average age of 56.4 years (SD = 13.6). Due to missing demographic and clinical data for the subset of participants, the analysis presented in Table 1 was restricted to 695 patients, representing 10,700 clinical visits for whom complete data were available. Notably, more than half of the participants (n = 346; 53.62%) reported no joint pain, while approximately 4% (n = 25) experienced occasional joint pain. Only a few patients had clinical joint deformities (n = 17, 2.7%). Additionally, about two-thirds of the patients tested positive for RF (n = 507, 77.5%), though only 12% exhibited rheumatoid nodules. The majority of patients were non-smokers (n = 502, 92.1%) and had no family history of rheumatic diseases, including RA (n = 439, 84.1%). It is also noteworthy that nearly half of the patients were not of Kuwaiti nationality. Table 1 summarizes the categorical data. Approximately 70% of the patients tested positive for anti-CCP. Additionally, 33.6% (n = 539) of patients had positive ANA. Table 2 presents the demographic and clinical characteristics of the study population for numerical variables. The mean DAS28 was 2.9, consistent with low disease activity at the cohort level, although higher values (> 5) were observed in a subset of patients, indicating active disease in these cases. The mean pain score on the Visual Analog Scale (VAS) was 2.1 (SD = 2.7), and the mean SDAI was 7.37 (SD = 5.61), reflecting an overall low to moderate level of disease activity.
Pearson correlation analysis was performed to evaluate the associations between environmental parameters (CO₂, PM₂.₅, wind speed and direction, temperature, and humidity) and clinical measures of RA activity (DAS28, ESR, and CRP). Correlation coefficients (r) are presented, with positive values indicating direct associations and negative values indicating inverse relationships. Statistical significance is denoted by * (p < 0.05) and ** (p < 0.01).
The demographic and clinical data of the patients, categorized as categorical variables, were analyzed alongside the temporal and spatial variations of meteorological parameters. As previously mentioned, meteorological data were collected from five distinct regions in Kuwait during the study period, specifically Al-Salam, Fahaheel, Jahra, Rumaithya, and Shuwaikh. Meteorological devices recorded temperature, humidity, wind speed, and wind direction on an hourly basis in each region. The daily averages for these measurements were subsequently calculated.
Table 1. Demographic and clinical data of the patients (categorical variables)
|
Variable |
Category |
Number (%) |
|
Number of patients |
— |
695 |
|
Total number of visits |
— |
10700 |
|
Joint pain (JP) |
Yes |
274 (42.5%) |
|
|
No |
346 (53.6%) |
|
|
Occasional |
25 (3.9%) |
|
Presence of deformities (D) |
Yes |
17 (2.7%) |
|
|
No |
604 (97.3%) |
|
Rheumatoid factor (RF) |
Positive |
507 (77.5%) |
|
|
Negative |
147 (22.5%) |
|
Anti-cyclic citrullinated peptides (Anti-CCP) |
Positive |
394 (70.4%) |
|
|
Negative |
166 (29.6%) |
|
Anti-nuclear antibodies (ANA) |
Positive |
359 (33.6%) |
|
|
Negative |
359 (66.4%) |
|
Rheumatoid nodules (RN) |
Yes |
12 (2.0%) |
|
|
No |
580 (98.0%) |
|
Smoking status (SMK) |
Yes |
43 (7.9%) |
|
|
No |
502 (92.1%) |
|
Family history (FH) |
Positive |
83 (15.9%) |
|
|
Negative |
439 (84.1%) |
|
Nationality |
Kuwaiti |
348 (50.1%) |
|
|
Non-Kuwaiti |
347 (49.9%) |
Table 2. Demographic and clinical data of the patients (numerical variables)
|
Variable |
Average (SD) |
|
Disease Activity Score 28 (RA Index), DAS28 |
2.9 (1.5) |
|
Erythrocyte Sedimentation Rate, ESR |
31.3 (25.4) |
|
C-reactive Protein, CRP |
5.5 (5.2) |
|
Visual Analog Scale (RA Index), VAS |
2.1 (2.7) |
|
Simple Disease Activity Index (RA Index), SDAI |
7.0 (5.8) |
|
Clinical Disease Activity Index (RA Index), CDAI |
8.4 (11.6) |
|
Number of Visits |
23.4 (23.9) |
|
Age (years) |
56.4 (13.6) |
4.2 Monthly variation of meteorological data
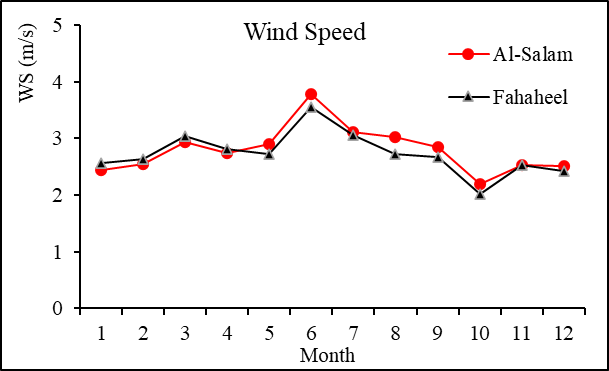
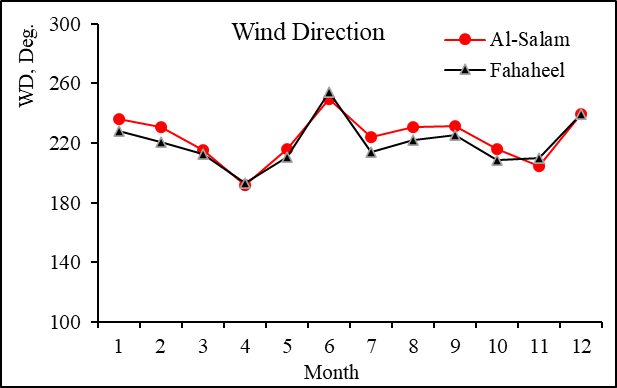
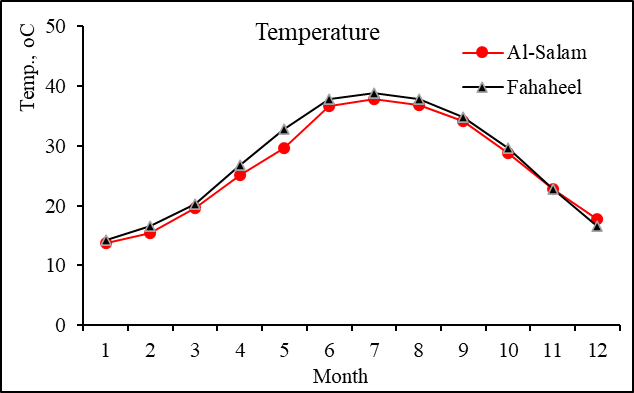
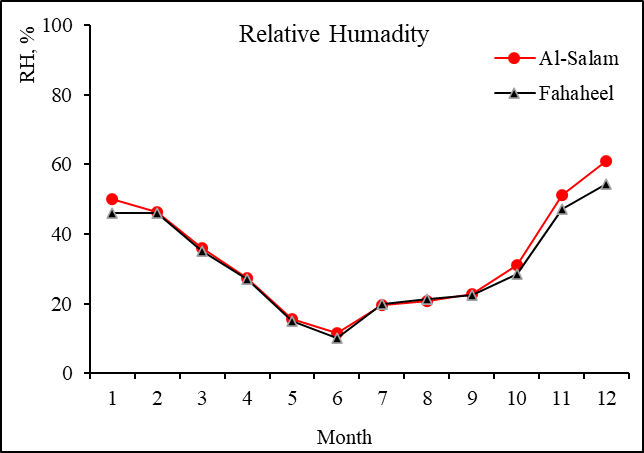
During the study period from 2020 to 2022, monthly meteorological data averages were calculated for five subregions in Kuwait, focusing on Al-Salam and Fahaheel due to their similar trends and the missing data in other areas. Figure 2 illustrates that the highest average monthly wind speeds occurred in June, with values ranging from 3.3 m/s to 4.5 m/s in Fahaheel and 2.5 m/s to 4.5 m/s in Al-Salam. Wind speeds declined to their lowest levels in December and January, falling between 2.4 m/s and 2.6 m/s. These trends were consistent across other regions, including Jahra, Shuwaikh, and Rumaithya, as noted in previous studies [36, 37]. The average monthly wind direction across all regions predominantly ranged from 200 to 220 degrees, indicating that winds generally flowed from the north toward the southwest. Figure 3 highlights that wind directions remained relatively stable within this range except in April and July. Kuwait's climate is characterized by hot, dry summers and short, warm winters, with extreme temperatures occasionally reaching 50 ℃ and dust storms common in summer. The Jahra region recorded the highest temperature of 53.4 ℃ in June 2020, while the lowest was 1.4 ℃. Monthly average temperatures peaked from June to September, particularly in July, coinciding with low relative humidity levels of 21%. Conversely, winter months experienced higher humidity of up to 76.4%, particularly in the Rumaithya region, with a corresponding inverse relationship between temperature and humidity, as detailed in Figures 4 and 5.
Figure 2. Monthly averaged wind speed in two different regions of Kuwait for 2020–2022
Figure 3. Monthly averaged wind direction in two different regions of Kuwait for 2020–2022
Figure 4. Monthly averaged temperature in two different regions of Kuwait for 2020–2022
Figure 5. Monthly average relative humidity in two different regions of Kuwait, 2020–2022
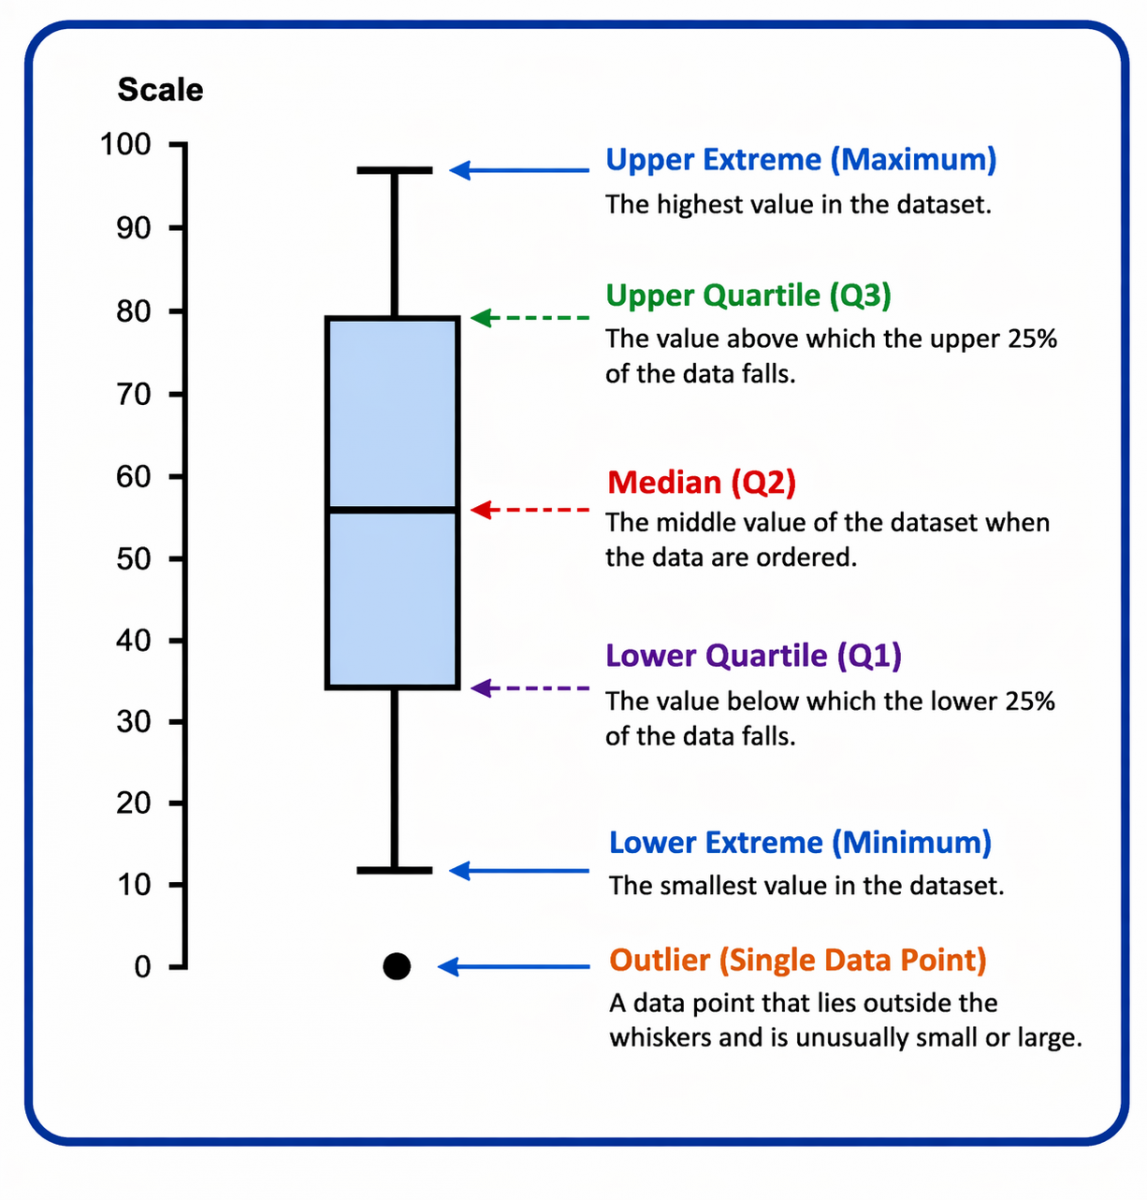
Figure 6. A typical box and whisker plot displays how the data is spread out
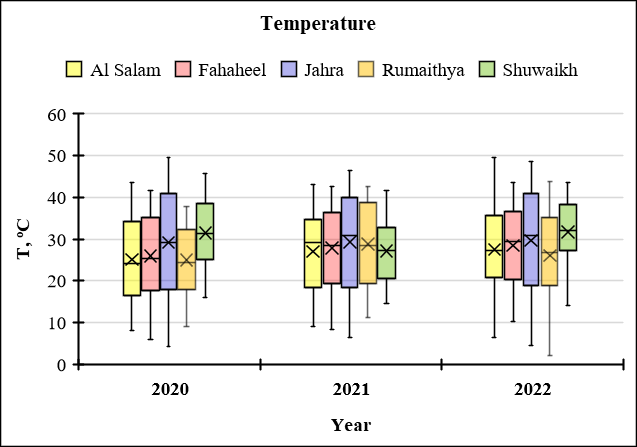
A box-whisker plot, commonly referred to as a box plot, was employed to elucidate the data for each year and location. A typical box plot is illustrated in Figure 6. This plot presents several key components: the lower extreme, representing the smallest value in the dataset, and the upper extreme, indicating the highest value. The median value, or the middle number in the dataset, is also displayed. Additionally, the lower quartile represents the value below which the lower 25% of the data falls. In comparison, the upper quartile indicates the value above which the upper 25% of the data is contained. The "whiskers," the lines extending from the boxes, indicate variability outside the upper and lower quartiles, providing a comprehensive view of the data distribution. Figures 7-8 present box plots for the four meteorological variables analyzed in this study: temperature, humidity, wind speed, and wind direction. Starting with Figure 7, the temperature data over three years across five sites indicates an average ranging between 28 ℃ and 30 ℃. The temperatures exhibit significant extremes, dropping to approximately 5 ℃ and rising to nearly 50 ℃, with the Jahra region recording a peak of close to 50 ℃ in 2020 and similar levels in Al Salam in 2022. The Jahra and Al-Rumaithya areas experienced the highest temperature fluctuations, while Al-Rumaithya also recorded the lowest temperature, dropping to about 2 ℃ in 2022. In contrast, the Fahaheel area demonstrated the least temperature variability. Figure 8 illustrates the box plot for relative humidity, showcasing daily mean values recorded from 2020 to 2022 at the five stations. Each box signifies the median, with "whiskers" extending to the highest and lowest values within 1.5 times the interquartile range (IQR). The substantial range between the minimum and maximum values reflects significant data variability, particularly in the Rumaithya region, which exhibited the largest fluctuations. The averages and medians for the other four stations were relatively consistent, with several outliers appearing in the upper limits for 2021. Similarly, the recorded monthly average wind speed data reveals narrow ranges across all regions, which indicates predominantly stagnant wind conditions, particularly in Jahra, which is characterized by calmness. However, the Rumaithya area showed the greatest variability in wind speed. Regarding wind direction, the observations indicate a prevailing trend of approximately 200-225° (southwest). However, the Rumaithya region exhibited considerable directional variability in 2021 and 2022, with readings spanning from 0° to 300°. Conversely, the Al Salam, Fahaheel, and Jahra regions displayed very low fluctuation in wind direction, while Shuwaikh recorded only a few outliers in 2021.
Figure 7. Box plots of the daily mean temperature recorded by the five stations for 2020-2022
Figure 8. Box plots of the daily mean relative humidity recorded by the five stations for 2020-2022
4.3 Variation of CO2 and PM2.5
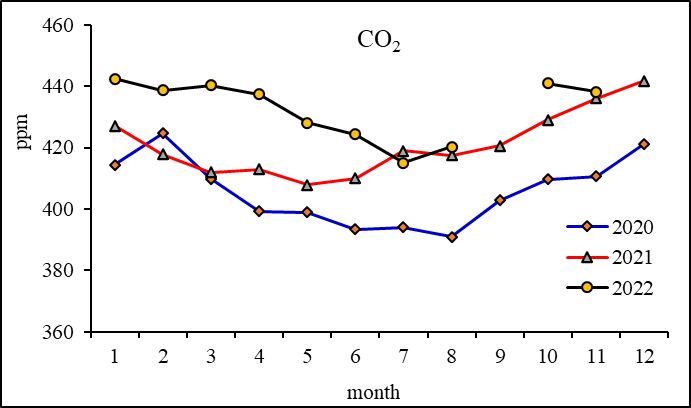
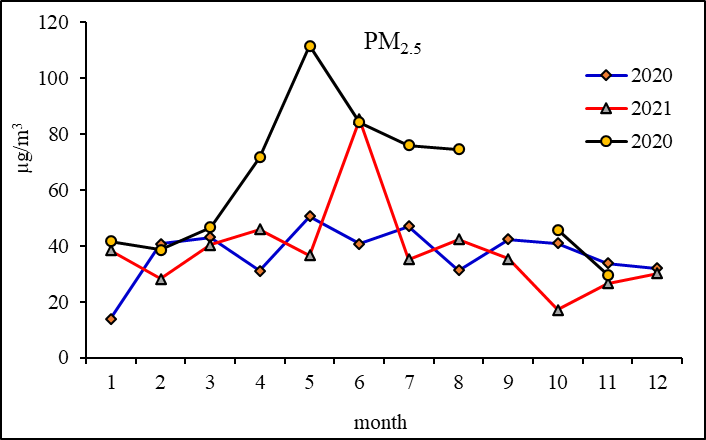
The annual average concentrations of CO₂ and PM2.5 are presented in Table 3, highlighting a significant increase in CO₂ levels over the study period. In Fahaheel, the average CO₂ concentration rose from 405.8 ppm in 2020 to 432.5 ppm in 2022. Notably, CO₂ levels in the Al Ahmadi region were consistently higher than in Fahaheel until 2022, when the concentrations became nearly equivalent. Overall, while global CO₂ concentrations are rising, the increases in Fahaheel and Al Ahmadi are particularly pronounced, with Kuwait generally exhibiting higher CO₂ levels than the global average. average, except for Fahaheel in 2020. The monthly variations in CO2 and PM2.5 levels for the Fahaheel and Al Ahmadi regions are illustrated in Figures 9 to 10. Over the study period from 2020 to 2022, a gradual increase in CO2 levels was observed in both regions, with Al Ahmadi consistently exhibiting higher concentrations than Fahaheel. Notably, there were no significant monthly variations, likely due to the influence of strong nearby emission sources. In Fahaheel, CO2 levels were higher during winter and lower in summer, a trend that aligns with global patterns. This seasonal variation can be attributed to increased respiratory activity during colder months and heightened fossil fuel combustion for heating, both contributing to elevated atmospheric CO2 levels [38]. The monthly PM2.5 variations reveal lower concentrations during the winter season (December to February) compared to summer, with values ranging from 29.8 to 62.7 μg/m³ in Al Ahmadi and 13.8 to 43.0 μg/m³ in Fahaheel. This decrease can be linked to precipitation and the mixing of relatively clean air masses during winter, which aids in the deposition and dilution of PM2.5 [39]. Additionally, reduced winter cooling demand leads to lower overall energy consumption and PM2.5 levels. Conversely, springtime experiences elevated PM2.5 levels, with mean concentrations reaching 70.9 μg/m³ and ranges of 38.6 to 194.6 μg/m³ in Al Ahmadi and 31.0 to 111.6 μg/m³ in Fahaheel. This spike is attributed to frequent dust storms during the pre-monsoon season, driven by southwesterly winds transporting dust from the Arabian Gulf and the Rub’ al Khali desert, which can affect the gulf region for nearly 30% of the year [40].
Figure 9. Monthly variation of CO2 levels in Fahaheel
Figure 10. Monthly variation of PM2.5 levels in Fahaheel
Table 3. Annual average concentration of CO2 and PM2.5
|
Year |
CO2 (ppm) |
PM2.5 (µg/g) |
|||
|
Fahaheel |
Ahmadi |
Global* |
Fahaheel |
Ahmadi |
|
|
2020 |
405.8 |
425.7 |
414.2 |
37.2 |
53.1 |
|
2021 |
421 |
433 |
416.4 |
38.4 |
55.7 |
|
2022 |
432.5 |
429.3 |
418.5 |
62 |
86.6 |
|
Overall statistics (for the three years, 2020, 2021, 2022) |
|||||
|
Average |
419 |
430.1 |
44.8 |
62.6 |
|
|
Min |
379.5 |
370.7 |
1.1 |
6.7 |
|
|
Max |
510.9 |
567.8 |
462 |
860.3 |
|
|
SD |
17.9 |
20.6 |
42.5 |
83.4 |
|
* USGCRP, 2023.
4.4 Correlation between rheumatoid arthritis parameters and meteorological variables
Pearson correlation tests were conducted to identify significant associations between meteorological data, CO2 levels, and PM2.5 and various disease activity parameters, including MS, VAS, TJ, SJ, ESR, CRP, PGA, phGA, DAS28, SDAI, and CDAI, for all regions. Table 4 presents the results of the correlation analysis between various disease activity parameters and meteorological variables, CO2 concentration, and PM2.5 for one of the regions (Fahaheel). As shown, some of the numbers are labelled by * if the correlation is significant at a 95% confidence level (p = 0.05) and ** if the correlation is significant at a 99% confidence level (p = 0.01). The results reveal the presence of a significant correlation at a 99% confidence level (p = 0.01) between all variables, indicating that all these variables are associated with each other. Some variables are positively correlated, indicating they increase or decrease together. For example, the following pairs are positively correlated: CO2-RH, WS-PM2.5, WD-PM2.5, Temperature-PM2.5, WS-WD, and WS-Temperature. On the other hand, certain variables display a negative correlation where one variable increases as the other decreases. These include the following pairs: CO2-PM2.5, CO2-WS, CO2-Temperature, PM2.5-RH, WS-RH, WD-RH, and Temperature-RH (p < 0.01). The relationship between air pollution and RA, their findings have been inconsistent, with some reporting positive correlations and others showing no significant associations or negative correlations [41, 42]. These discrepancies may be attributed to regional weather variations, demographic differences, and methodological limitations, with insufficient attention given to the lagged effects of these variables on RA activity [43-50].
Table 4. Correlation analysis between rheumatoid arthritis (RA) disease factors and meteorological variables, CO2 concentration, and PM2.5
|
RA |
Fahaheel |
|||||
|
Parameter |
CO2 |
PM2.5 |
WS |
WD |
Temp. |
RH |
|
(ppm) |
(µg/m3) |
(m/s) |
Deg |
℃ |
% |
|
|
MS |
0.07* |
-0.01 |
-0.02 |
-0.05 |
0.09** |
0.04 |
|
VAS |
0.05 |
-0.04 |
-0.04 |
0.01 |
0.04 |
-0.04 |
|
TJ |
0 |
-0.03 |
0 |
0.02 |
0.05* |
0.06** |
|
SJ |
0.04 |
-0.05* |
0.02 |
0.05* |
-0.01 |
-0.01 |
|
ESR |
0.03 |
-0.07** |
-0.03 |
0.03 |
0.01 |
-0.03 |
|
CRP |
-0.05* |
-0.01 |
0.11** |
0.04 |
0.01 |
-0.03 |
|
PGA |
0.03 |
-0.04 |
-0.05* |
0 |
0.05* |
-0.04 |
|
phGA |
0.04 |
-0.03 |
-0.04 |
0.02 |
0.04 |
-0.04 |
|
DAS28 |
0.01 |
-0.06* |
0 |
0.04 |
0.03 |
-0.06* |
|
SDAI |
-0.04 |
-0.01 |
0.09** |
0.02 |
0.02 |
-0.01 |
|
CDAI |
0.02 |
-0.04 |
-0.01 |
0.03 |
0.04 |
-0.05* |
4.5 Multiple linear regression analysis (stepwise regression)
In this study, stepwise forward linear regression was applied to analyze the relationship between RA indexes and independent variables, including CO2, PM2.5, and meteorological data. The dependent variable DAS28 was examined across various regions. Table 5 presents data for DAS28 results in two regions, namely, Fahaheel and Al Salam. The results reveal that particulate matter (PM2.5) significantly affects DAS28, with negative coefficients indicating an inverse relationship. Relative humidity was the second most significant variable in all regions except Jahra, where wind direction played that role. The VAS used to assess joint pain showed no significant impact from CO2, PM2.5, or meteorological variables, as all p-values exceeded 0.05. For the second and third models, which focused on SDAI and CDAI, wind speed consistently influenced SDAI across all regions with positive coefficients, while CDAI varied by region, showing a significant inverse association with relative humidity and PM2.5 in Al Salam. Overall, these findings suggest that environmental variables such as particulate matter and relative humidity may be associated with RA activity; however, the observed relationships were generally weak and inconsistent, and the explanatory power of the models was limited (r < 0.1). This indicates that same-day exposure models may not adequately capture the complex relationship between environmental factors and RA activity; therefore, further analyses incorporating lagged exposure, cumulative exposure metrics (moving averages), and multivariate approaches such as PCA were conducted to better characterize these associations.
Table 5. Forward Stepwise multiple linear regression analysis for the rheumatoid arthritis (RA) index DAS28
|
Dep. Var. |
Region |
Predictors* |
Std. Coeff. |
t |
Sig. |
|
DAS28 |
Fahaheel |
PM2.5 |
-0.063 |
-2.65 |
0.008 |
|
RH |
-0.057 |
-2.40 |
0.017 |
||
|
Al Salam |
PM2.5 |
-0.064 |
-2.68 |
0.007 |
|
|
RH |
-0.061 |
-2.53 |
0.011 |
*Predictors included: CO2, PM2.5, relative humidity (RH), Temperature, wind speed (WS), and wind direction (WD).
4.6 Lagged and principal component analysis-based analysis
The incorporation of lagged exposure models provided important insights into the temporal dynamics between environmental exposure and RA activity. While same-day exposure (lag 0) showed weak and inconsistent associations (e.g., correlation coefficients generally < 0.10), stronger and more consistent relationships were observed at short-term lag periods, particularly at 2–3 days before the clinical visit (Table 6). This pattern suggests that environmental exposure does not exert an immediate effect on RA activity, but rather influences disease expression after a short delay. For example, at lag 2–3 days, the association between PM2.5 and DAS28 increased (r = [0.18], p = [0.014]), and regression coefficients were also higher (β = [0.19]), indicating a delayed effect. Similar delayed associations have been reported in studies examining air pollution and inflammatory diseases, where exposure effects are often observed within a few days following exposure [51].
Table 6. Significant results from lag (1–7 days) and moving average (MA3–MA7) regression models relating environmental variables to rheumatoid arthritis (RA) activity indices. Only predictors with p < 0.05 are shown
|
RA Index |
Lag-Days |
Environmental Variable |
Beta |
p-Value |
r |
|
CDAI |
3 |
Temperature |
0.075 |
0.016 |
0.048 |
|
CDAI |
3 |
CO2 |
0.027 |
0.047 |
0.05 |
|
DAS28 |
3 |
PM2.5 |
-0.19 |
0.014 |
0.179 |
|
DAS28 |
3 |
Temperature |
0.013 |
0.011 |
0.057 |
|
DAS28 |
3 |
CO2 |
0.005 |
0.025 |
0.055 |
|
SDAI |
6 |
CO2 |
-0.019 |
0.04 |
0.062 |
|
SDAI |
7 |
RH |
-0.024 |
0.018 |
0.46 |
|
VAS |
2 |
Temperature |
0.017 |
0.033 |
0.048 |
|
VAS |
2 |
PM |
-0.003 |
0.048 |
0.051 |
|
DAS28 |
MA3 |
Temperature |
0.049 |
0.04 |
0.087 |
|
DAS28 |
MA3 |
PM2.5 |
-0.035 |
0.007 |
0.140 |
|
CDAI |
MA3 |
Temperature |
0.049 |
0.039 |
0.077 |
|
CDAI |
MA5 |
Temperature |
0.049 |
0.04 |
0.067 |
|
CDAI |
MA3 |
RH |
-0.03 |
0.012 |
0.057 |
|
CDAI |
MA5 |
CO2 |
-0.032 |
0.012 |
0.058 |
This temporal shift suggests that environmental exposure does not exert an immediate effect on RA activity but rather influences disease expression after a short delay. For example, DAS28 and CDAI showed stronger associations at lag 3 days, whereas VAS demonstrated sensitivity at shorter periods (lag 2), and SDAI exhibited delayed responses at longer lags. This delayed response is biologically reasonable, as inflammatory Pathways require time to develop following exposure. The observed 2–3 days lag window aligns with known mechanisms of cytokine activation and systemic inflammation [52, 53].
In addition to single-day lag analysis, moving average models for 3, 5, and 7 days (MA3, MA5, and MA7) were applied to assess cumulative exposure effects. As presented in Table 6, these models resulted in more stable estimates, with slightly improved explanatory power compared to single-day lags. For example, the moving average model showed an increase in model fit (r = 0.14) compared to lag 0 (r < 0.10), suggesting that short-term cumulative exposure better captures environmental influences. After applying FDR Corrections, all previously identified associations remained statistically significant (q < 0.05) as shown in Table 6. This indicates that the observed relationships between environmental and RA disease activity indices are robust and unlikely to be due to multiple testing. This finding is consistent with the previous environmental epidemiology studies demonstrating that cumulative exposure captures metrics better for the health effects [54, 55].
The application of PCA further improved model performance by reducing multicollinearity among predictors. Environmental factors such as temperature, humidity, and air pollutants are often interrelated, which can distort regression estimates when included simultaneously in conventional models. PCA has been widely used in environmental health research to reduce dimensionality and identify dominant exposure patterns [56]. By transforming these variables into orthogonal components, PCA allowed for the identification of integrated environmental patterns that better represent real-world exposure conditions. The first principal component (PC1), represents pollution and climate parameters. It is highly loaded with PM2.5, CO2, and temperature, while the second principal component (PC2) represents the remaining meteorological parameters.
Significant associations were observed at lag 3 days with components of PC1 (PM2.5, CO2, and temperature) and DAS28. A similar positive association was also observed between the PC1 components and CDAI at lag 3 days. However, VAS exhibited a modest association at lag 2 days, suggesting short-term perception of environmental impact. SDAI showed a delayed Association at like 7 with PC2 components (relative humidity, wind speed, and wind direction) with a negative association. This result showed a more consistent association with RA indices compared to individual variables. This indicates that combined environmental patterns provide a more robust representation of exposure, reflecting real-world conditions more accurately than isolated variables [56, 57].
Table 7. Comparison between the previous study by Alsaber et al. [17] and the current study
|
Aspect |
Previous Study |
Current Study |
|
Study Object |
Association between ambient air pollution and RA disease activity |
Impact of climate-related fluctuations, CO2, and environmental factors on RA disease activity |
|
Study Period |
2013–2017 |
2020–2022 |
|
Exposure Variables |
PM10, NO2, SO2, O3, CO |
PM2.5, CO2, and meteorological variables (temperature, RH, wind speed, wind direction) |
|
Environmental Scope |
Air pollution only |
Combined air pollution + climate/meteorological factors |
|
Temporal Analysis |
No lag or moving average analysis (limitation acknowledged) |
Lag analysis (Lag 1–7), Moving average (MA) models |
|
Statistical Methods |
Correlation + hierarchical linear regression |
correlation + regression + lag models + moving average + PCA |
|
Handling Multicollinearity |
Not addressed |
Addressed using PCA |
|
Overall Conclusion |
Air pollution is associated with RA activity |
Environmental and climate-related factors show clearer and more robust associations with RA activity |
Note: PCA = principal component analysis.
Despite these improvements, the magnitude of the observed associations remained relatively small. This indicates that environmental exposure likely acts as a modulating factor rather than a primary determinant of RA activity. The low explanatory power of the models further reflects the multi-factorial nature of RA, where clinical, genetic, and lifestyle factors play dominant roles [58]. Overall, the consistency of findings across lagged, moving average, and PCA-based analysis strengthens the robustness of the results and underscores the importance of incorporating temporal exposure structures and multivariate approaches in studies investigating environmental effects on inflammatory disease.
Comparison with the previous study reported by Alsaber et al. [17] highlights important differences in both methodology and findings. In the earlier work, statistically significant associations were observed between RA disease activity and selected air pollutants, particularly NO2 and SO2; however, these relationships were relatively weak, as reflected by low correlation coefficients (r ≈ 0.07) and a small regression effect size. Moreover, the analysis was based on cross-sectional exposure matching without accounting for temporal variability in exposure. In contrast, the present study incorporates lag analysis and moving average models, enabling evaluation of delayed and cumulative exposure effects. In addition, the inclusion of PM2.5, CO2, and meteorological variables provides a broader environmental context. Collectively, these methodological enhancements yield a clearer, more comprehensive understanding of the relationship between environmental factors and RA disease activity. A detailed comparison between the present study and the previous work [17] is summarized in Table 7.
In conclusion, this study provides valuable insights into the intricate relationship between meteorological variables and RA indices, particularly highlighting the overall low average Disease Activity Score (DAS28) and noting instances of elevated disease activity in specific cases. The findings reveal a consistent decrease in average monthly wind speeds during the winter months and a predominant southwest wind direction throughout the year, alongside concerning trends in air quality in Kuwait. CO2 levels consistently exceed global averages, especially in certain regions, and the rise in fine particulate matter (PM2.5) from 2020 to 2022 indicates a significant pollution issue. Seasonal variations in CO2 levels align with global trends, driven by increased fossil fuel combustion during winter, while PM2.5 concentrations decrease in winter due to precipitation and the mixing of cleaner air masses.
This study provides a comprehensive evaluation of the relationship between environmental exposure and RA activity by integrating lagged analysis, cumulative exposure assessment, and multivariate modeling approaches. The findings indicate that environmental effects on RA activity are modest but temporally structured, rather than immediate. The incorporation of lagged exposure models revealed that the strongest associations occurred within a 2–3-day window before clinical assessment, suggesting a delayed biological response consistent with inflammatory activation pathways. The application of the PCA further strengthened the analytical framework by reducing multicollinearity and capturing integrated environmental patterns, which showed more consistent associations with RA indices than individual variables. This emphasizes the importance of considering environmental exposures as complex, interacting systems rather than isolated factors.
[1] Shin, J., Lee, J., Lee, J., Ha, E.H. (2019). Association between exposure to ambient air pollution and rheumatoid arthritis in adults. International Journal of Environmental Research and Public Health, 16: 1227. https://doi.org/10.3390/ijerph16071227
[2] Manisalidis, I., Stavropoulou, E., Stavropoulos, A., Bezirtzoglou, E. (2020). Environmental and health impacts of air pollution: A review. Frontiers in Public Health, 8: 14. https://doi.org/10.3389/fpubh.2020.00014
[3] Barnes, J., Bender, J., Lyons, T., Borland, A. (1999). Natural and man-made selection for air pollution resistance. Journal of Experimental Botany, 50(338): 1423-1435. https://doi.org/10.1093/jxb/50.338.1423
[4] Shepherd, G., Terradellas, E., Baklanov, A., et al. (2016). Global assessment of sand and dust storms.
[5] Harvard Health Publishing. (2024). Rheumatoid arthritis. https://www.health.harvard.edu/topics/rheumatoid-arthritis.
[6] Baldassari, A.R., Cleveland, R.J., Luong, M.N., et al. (2016). Socioeconomic factors and self-reported health outcomes in African Americans with rheumatoid arthritis from the Southeastern United States: The contribution of childhood socioeconomic status. BMC Musculoskeletal Disorders, 17(1): 10. https://doi.org/10.1186/s12891-016-0882-5
[7] Centers for Disease Control and Prevention. (2022). Rheumatoid arthritis (RA). https://www.cdc.gov/arthritis/rheumatoid-arthritis/.
[8] Deane, K.D., Demoruelle, M.K., Kelmenson, L.B., Kuhn, K.A., Norris, J.M., Holers, V.M. (2017). Genetic and environmental risk factors for rheumatoid arthritis. Best Practice & Research Clinical Rheumatology, 31(1): 3-18. https://doi.org/10.1016/j.berh.2017.08.003
[9] Hart, J.E., Källberg, H., Laden, F., et al. (2013). Ambient air pollution exposures and risk of rheumatoid arthritis. Arthritis Care & Research, 65(7): 1190-1196. https://doi.org/10.1002/acr.21975
[10] Heinlen, L., Humphrey, M. (2017). Skeletal complications of rheumatoid arthritis. Osteoporosis International, 28(10): 2801-2812. https://doi.org/10.1007/s00198-017-4170-5
[11] Rawla, P. (2019). Cardiac and vascular complications in rheumatoid arthritis. Reumatologia, 57(1): 27-36. https://doi.org/10.5114/reum.2019.83236
[12] Farquhar, H., Vassallo, R., Edwards, A.L., Matteson, E.L. (2019). Pulmonary complications of rheumatoid arthritis. Seminars in Respiratory and Critical Care Medicine, 40: 194-207. https://doi.org/10.1055/s-0039-1683995
[13] Jung, C.R., Hsieh, H.Y., Hwang, B.F. (2017). Air pollution as a potential determinant of rheumatoid arthritis: A population-based cohort study in Taiwan. Epidemiology, 28(Suppl.1): S54-S59. https://doi.org/10.1097/EDE.0000000000000732
[14] Ji, S., Ma, S. (2022). The effects of industrial pollution on ecosystem service value: A case study in a heavy industrial area, China. Environment, Development and Sustainability, 24(5): 6804-6833. https://doi.org/10.1007/s10668-021-01728-y
[15] Adami, G., Pontalti, M., Cattani, G., et al. (2022). Association between long-term exposure to air pollution and immune-mediated diseases: A population-based cohort study. RMD Open, 8(1): e002055. https://doi.org/10.1136/rmdopen-2021-002055
[16] Bourdrel, T., Bind, M.A., Béjot, Y., Morel, O., Argacha, J.F. (2017). Cardiovascular effects of air pollution. Archives of Cardiovascular Diseases, 110: 634-642. https://doi.org/10.1016/j.acvd.2017.05.003
[17] Alsaber, A., Pan, J., Al-Herz, A., Alkandary, D.S., Al-Hurban, A., Setiya, P. (2020). Influence of ambient air pollution on rheumatoid arthritis disease activity score index. International Journal of Environmental Research and Public Health, 17(2): 416. https://doi.org/10.3390/ijerph17020416
[18] Al-Awadhi, J. (2016). SO₂, NO₂ and BTEX concentrations in educational and industrial areas: Field measurements in Kuwait. Asian Journal of Atmospheric Environment, 10: 169-178. https://doi.org/10.5572/ajae.2016.10.4.169
[19] Otoum, A., Anang, Z., Abdul Rashid, N.K. (2024). Impact of non-conventional water use development on the well-being of refugees in Jordan. International Journal of Sustainable Development and Planning, 19(7): 2699-2708. https://doi.org/10.18280/ijsdp.190726
[20] Kumar, P., Patton, A.P., Durant, J.L., Frey, H.C. (2018). A review of factors impacting exposure to PM₂.₅, ultrafine particles and black carbon in Asian transport microenvironments. Atmospheric Environment, 187: 301-316. https://doi.org/10.1016/j.atmosenv.2018.05.046
[21] Ziska, L.H. (2016). The role of climate change and increasing atmospheric carbon dioxide on weed management: Herbicide efficacy. Agriculture, Ecosystems & Environment, 231: 304-309. https://doi.org/10.1016/j.agee.2016.07.014
[22] Alsaber, A., Al-Herz, A., Pan, J., AL-Sultan, A.T., Mishra, D. (2021). Handling missing data in a rheumatoid arthritis registry using random forest approach. International Journal of Rheumatic Diseases, 24: 1282-1293. https://doi.org/10.1111/1756-185X.14203
[23] Alsaber, A.R., Al-Herz, A., Alawadhi, B., et al. (2024). Machine learning-based remission prediction in rheumatoid arthritis patients treated with biologic disease-modifying anti-rheumatic drugs. Frontiers in Big Data, 7: 1406365. https://doi.org/10.3389/fdata.2024.1406365
[24] Ingegnoli, F., Ubiali, T., Schioppo, T., et al. (2021). Potential short-term air pollution effects on rheumatoid arthritis activity in metropolitan areas in northern Italy. International Journal of Environmental Research and Public Health, 18(16): 8490. https://doi.org/10.3390/ijerph18168490
[25] Kellogg, W.W. (2019). Climate Change and Society: Consequences of Increasing Atmospheric Carbon Dioxide. Routledge. https://doi.org/10.4324/9780429048739
[26] Keswani, A., Akselrod, H., Anenberg, S.C. (2022). Health and clinical impacts of air pollution and linkages with climate change. NEJM Evidence, 1(7): EVIDra2200068. https://doi.org/10.1056/EVIDra2200068
[27] Friedlingstein, P., O’Sullivan, M., Jones, M.W., et al. (2022). Global carbon budget 2022. Earth System Science Data, 14: 4811-4900. https://doi.org/10.5194/essd-14-4811-2022
[28] Das, R. (2023). Carbon dioxide challenge: A global emergency. NAM Today, VIII(1): 26-28.
[29] Barchielli, B., Cricenti, C., Gallè, F., et al. (2022). Climate changes, natural resources depletion, COVID-19 pandemic, and Russian-Ukrainian war: What is the impact on habits change and mental health? International Journal of Environmental Research and Public Health, 19: 11929. https://doi.org/10.3390/ijerph191911929
[30] Duarte, C.M., Jaremko, L., Jaremko, M. (2020). Potential systemic impacts of elevated CO₂ on the human proteome and health. Frontiers in Public Health, 8: 543322. https://doi.org/10.3389/fpubh.2020.543322
[31] Kabir, M., Habiba, U.E., Khan, W., et al. (2023). Climate change due to increasing CO₂ concentration and its environmental impacts in the 21st century: A mini review. Journal of King Saud University - Science, 35(8): 102693. https://doi.org/10.1016/j.jksus.2023.102693
[32] Di, D., Zhang, L., Wu, X., Leng, R. (2020). Long-term exposure to outdoor air pollution and the risk of development of rheumatoid arthritis: A systematic review and meta-analysis. Seminars in Arthritis and Rheumatism, 50(2): 266-275. https://doi.org/10.1016/j.semarthrit.2019.10.005
[33] Wong, C.M., Tsang, H.K., Lai, H.K., et al. (2016). Cancer mortality risks from long-term exposure to ambient fine particles. Cancer Epidemiology, Biomarkers & Prevention, 25(5): 839-845. https://doi.org/10.1158/1055-9965.EPI-15-0626
[34] Finckh, A., Gilbert, B., Hodkinson, B., et al. (2022). Global epidemiology of rheumatoid arthritis. Nature Reviews Rheumatology, 18(10): 591-602. https://doi.org/10.1038/s41584-022-00827-y
[35] Azzouzi, H., Ichchou, L. (2020). Seasonal and weather effects on rheumatoid arthritis: Myth or reality? Pain Research and Management, 2020: 5763080. https://doi.org/10.1155/2020/5763080
[36] Guedj, D., Weinberger, A. (1990). Effect of weather conditions on rheumatic patients. Annals of the Rheumatic Diseases, 49(3): 158-159. https://doi.org/10.1136/ard.49.3.158
[37] Al-Dousari, A., Ramadan, A., Al-Qattan, A., et al. (2020). Cost and effect of native vegetation change on aeolian sand, dust and microclimate in Kuwait. Journal of Taibah University for Science, 14(1): 628-639. https://doi.org/10.1080/16583655.2020.1761662
[38] Al Senafi, F., Anis, A. (2015). Shamals and climate variability in the Northern Arabian/Persian Gulf. International Journal of Climatology, 35: 4509-4528. https://doi.org/10.1002/joc.4302
[39] Fonseca, R., Francis, D. (2024). Satellite derived trends and variability of CO₂ concentrations in the Middle East. Frontiers in Environmental Science, 11: 1289142. https://doi.org/10.3389/fenvs.2023.1289142
[40] Al-Taani, A.A., Nazzal, Y., Howari, F.M., Yousef, A. (2019). Long-term trends in ambient fine particulate matter in the UAE. Environmental Monitoring and Assessment, 191: 143. https://doi.org/10.1007/s10661-019-7259-9
[41] Patberg, W.R. (1997). Correlation of erythrocyte sedimentation rate and outdoor temperature in a patient with rheumatoid arthritis. Journal of Rheumatology, 24(5): 1017-1018.
[42] Gorin, A.A., Smyth, J.M., Weisberg, J.N., et al. (1999). Rheumatoid arthritis patients show weather sensitivity in daily life. Pain, 81: 173-177. https://doi.org/10.1016/S0304-3959(99)00010-X
[43] Zhao, D., Cheng, J., Bao, P., et al. (2022). Effect of ambient temperature on outpatient admission for osteoarthritis and rheumatoid arthritis. BMC Public Health, 22: 172. https://doi.org/10.1186/s12889-021-11994-0
[44] De Roos, A.J., Koehoorn, M., Tamburic, L., Davies, H.W., Brauer, M. (2014). Proximity to traffic, ambient air pollution, and community noise in relation to rheumatoid arthritis. Environmental Health Perspectives, 122: 1075-1080. https://doi.org/10.1289/ehp.1307413
[45] Gasparrini, A., Armstrong, B., Kenward, M.G. (2010). Distributed lag non-linear models. Statistics in Medicine, 29: 2224-2234. https://doi.org/10.1002/sim.3940
[46] WHO. (2024). Ambient (outdoor) air pollution. https://www.who.int/news-room/fact-sheets/detail/ambient-(outdoor)-air-quality-and-health.
[47] Fatmi, Z., Carpenter, D.O., Santoso, M., Sannoh, F., Khwaja, H.A., Zeb, J. (2024). Air pollution we breathe: Assessing the air quality and human health impact in a megacity of Southeast Asia. Science of the Total Environment, 942: 173403. https://doi.org/10.1016/j.scitotenv.2024.173403
[48] Patberg, W.R., Rasker, J.J. (2004). Weather effects in rheumatoid arthritis: From controversy to consensus. Journal of Rheumatology, 31(7): 1327-1334.
[49] Cianconi, P., Betrò, S., Janiri, L. (2020). The impact of climate change on mental health: A systematic descriptive review. Frontiers in Psychiatry, 11: 74. https://doi.org/10.3389/fpsyt.2020.00074
[50] Gan, R.W., Deane, K.D., Zerbe, G.O., et al. (2013). Relationship between air pollution and RA-related autoantibodies. Annals of the Rheumatic Diseases, 72: 2002-2005. https://doi.org/10.1136/annrheumdis-2012-202949
[51] Brook, R.D., Rajagopalan, S., Pope, C.A., et al. (2010). Particulate matter air pollution and cardiovascular disease: An update to the scientific statement from the American Heart Association. Circulation, 121(21): 2331-2378. https://doi.org/10.1161/CIR.0b013e3181dbece1
[52] Wei, Y., Wang, Y., Di, Q., et al. (2019). Short term exposure to fine particulate matter and hospital admission risks and costs in the Medicare population: Time stratified, case crossover study. BMJ, 367: l6258. https://doi.org/10.1136/bmj.l6258
[53] Vallée, V. (2026). Predicting cardiovascular events with time-lagged inflammatory dynamics: Stochastic delay modeling. Computational and Structural Biotechnology Journal, 35: 0005. https://doi.org/10.34133/csbj.0005
[54] Buxton, M.A., Meraz-Cruz, N., Sanchez, B.N., et al. (2019). Air pollution and inflammation: Findings from concurrent repeated measures of systemic and reproductive tract cytokines during term pregnancy in Mexico City. Science of the Total Environment, 681: 235-241. https://doi.org/10.1016/j.scitotenv.2019.05.041
[55] So, R., Di Gessa, G., Scholes, S., et al. (2025). Long-term exposure to air pollution and incidence of asthma and chronic obstructive pulmonary disease among adults aged 50 years and older: The English Longitudinal Study of Ageing. Journal of Global Ageing, 2(2): 234-254. https://doi.org/10.1332/29767202Y2025D000000031
[56] Jolliffe, I.T., Cadima, J. (2016). Principal component analysis: A review and recent developments. Philosophical Transactions of the Royal Society A: Mathematical, Physical and Engineering Sciences, 374(2065): 20150202. https://doi.org/10.1098/rsta.2015.0202
[57] Dominici, F., Peng, R.D., Bell, M.L., et al. (2006). Fine particulate air pollution and hospital admission for cardiovascular and respiratory diseases. JAMA, 295(10): 1127-1134. https://doi.org/10.1001/jama.295.10.1127
[58] McDermott, G.C., Sparks, J.A. (2023). Invited perspective: Air pollutants, genetics, and the mucosal paradigm for rheumatoid arthritis risk. Environmental Health Perspectives, 131(3): 031303. https://doi.org/10.1289/EHP12167