Abin Suarsa* | Agus Sutandi | Iis Dewi Fitriani | Mohamad Hilal Nu'man | Moch Tirta K. Gunawan | Shofura Naila Syahidatulhaq | Zahra Hardyanti
© 2026 The authors. This article is published by IIETA and is licensed under the CC BY 4.0 license (http://creativecommons.org/licenses/by/4.0/).
OPEN ACCESS
This study investigates the intricate relationships between Environmental Awareness (EA), Trust Label (TL), Eco-Friendly Attitude (EFA), Social & Lifestyle (SL), and Purchase Intention (PI) in the context of low-carbon coffee in Indonesia. This research aims to uncover the mechanisms that mediate the translation of EA into actual purchasing behaviour, addressing the prevalent 'green gap'. A quantitative approach is used by sampling through an online questionnaire. Data were collected from 300 coffee consumers in urban Indonesia, selected through non-probability purposive sampling. The hypothesis was tested using Partial Least Squares Structural Equation Modeling (PLS-SEM) with SmartPLS 4, assessing the direct effects and indirect mediation effects. The results revealed that EA did not directly affect PI. Instead, the effect is fully mediated by EFA and SL. TL emerged as the most dominant antecedent of SL, exerting a strong and significant influence on SL (β = 0.598, p < 0.001) and EFA (β = 0.499, p < 0.001). The most powerful avenue for PI is through TL → SL → PI (β = 0.236, p < 0.001). This underscores that consumption is driven more by social identity and lifestyle expressions than by cognitive awareness alone. This study contributes empirically to the green consumer behavior literature by examining the specific mediation structure particularly the pathway TL → SL → PI in the understudied context of carbon-labeled coffee in an emerging market. While individual mediators (EFA, SL) have been documented in prior research, their integrated application to low-carbon coffee consumption in Indonesia provides novel insights for sustainability management in developing economies.
low carbon footprint coffee, Trust Label, Social & Lifestyle, Purchase Intention, green gap, Partial Least Squares Structural Equation Modeling
The issue of sustainability has become a major concern in global development. Climate change, environmental degradation, and rising carbon emissions are driving companies to integrate sustainability principles into their business strategies. In the context of agribusiness, particularly coffee, sustainability is not only about the production process, but also how companies manage relationships with consumers through information transparency, reputation management, and low-carbon product innovation. The concept of sustainability management requires companies to combine economic, social, and environmental dimensions in strategic decision-making [1, 2].
Coffee, as one of the global commodities, has a significant carbon footprint throughout its supply chain, from cultivation, processing, distribution, to consumption [3-7]. Therefore, managing coffee's carbon footprint is an important part of a company's sustainability strategy. One of the instruments widely used to convey sustainability commitments to consumers is the carbon label or eco-friendly labels. These labels serve as a communication tool that signals to consumers about the company's efforts to reduce environmental impact.
However, the effectiveness of sustainability labels is greatly influenced by Trust Label (TL). Without trust, labels are just formal symbols that don't add value in driving purchase intent behavior [8-10]. Therefore, building a TL is an important part of sustainability management.
Several studies show a gap (green gap) between Environmental Awareness (EA) and Purchase Intention (PI) for environmentally friendly products [11-14]. Consumers can have a high level of awareness about environmental issues, but they don't always translate them into real behavior. This condition is a challenge for companies in designing an effective sustainability strategy.
In this context, Social & Lifestyle (SL) and Eco-Friendly Attitude (EFA) are important intermediary factors. SL serves as a form of social expression, in which the decision to buy low-carbon products is driven not only by cognitive factors but also by the representation of one's identity and social group [15]. Similarly, an EFA has been shown to play a central role in bridging awareness with actual behavior [16].
However, this practice faces challenges. First, skepticism toward labels remains high in emerging markets [17, 18]. Second, consumers often prioritize price and convenience over sustainability. Third, regulations on carbon labeling standards in Indonesia are still developing and are not yet uniform. These challenges make sustainability management more strategic, not only following trends, but also making sustainability a long-term competitive advantage.
Several previous studies have discussed consumer behavior towards green products [19-22]. However, research explicitly linking consumer behavior to sustainability management in the context of carbon-footprint coffee remains limited, especially in developing countries such as Indonesia.
While previous studies have extensively discussed consumer behavior toward green products, research explicitly examining consumer behavior in the specific context of low-carbon coffee remains limited, especially in emerging markets such as Indonesia. Most green consumption research predominantly focuses on developed economies, leaving a significant gap in understanding sustainability management in developing countries, where carbon labeling standards are still evolving, and consumer skepticism toward labels remains high. This study shows how these variables can serve as the basis for consumer-based sustainability management strategies and provides empirical evidence from Indonesia, which is relevant to emerging markets with increasing levels of sustainability awareness.
Based on the above description, the purpose of this study is to explore the relationship between EA, TL, SL, and EFA to PI of low-carbon coffee. Specifically, this research tests whether trust in carbon labels operates as a primary driver of social identity-based consumption, rather than as a direct amplifier of environmental consciousness. By examining this structure in an emerging market context, this research provides practical insights for sustainability communication strategies in developing economies.
This study uses a quantitative approach with the Partial Least Squares Structural Equation Modeling (PLS-SEM) method. This design was chosen because it could analyze the causal relationships among complex latent variables, including the mediating roles of SL and EFA in linking EA with PI of low-carbon coffee. In addition, PLS-SEM is suitable for exploratory research and is oriented towards theoretical development in the realm of sustainability management [23].
With this design, the research not only tests the strength of relationships between variables but also provides an empirical basis for devising consumer-based sustainability management strategies in the coffee industry.
2.1 Population and sample
The research population is coffee consumers in Indonesia who are familiar with sustainability issues or have at least heard of environmentally friendly or carbon-labeled coffee products. The sampling technique used is non-probability purposive sampling, implemented via online surveys distributed through social media platforms (Instagram, Facebook, and online groups of coffee lover communities) as well as sustainable coffee-related communities in Indonesia. This approach was chosen to efficiently target urban consumers who are more likely to engage with sustainability trends and premium coffee products. Strict respondent screening criteria were implemented to ensure data quality, including: (1) being at least 18 years old, (2) having consumed coffee regularly (at least once per week) in the past six months, and (3) self-awareness of product sustainability issues.
Respondent verification is carried out by (1) initial screening questions about the frequency of coffee consumption, (2) checking the consistency of responses across questionnaire items to detect untrustworthy response patterns, and (3) data deletion with a very short response time (< 3 minutes for a 17-item questionnaire). This process ensures the internal validity of the collected data.
A total of 300 eligible respondents participated in this study. Sample limitations to note: this sample was taken from urban coffee consumers in Indonesia who are active online and have access to social media. These findings are most representative of urban, technology-oriented, and upper-middle-income demographics that are conscious of sustainable products. Generalization to Indonesia’s rural population or to non-premium coffee consumers must be done with caution. Future research should include rural and urban samples to provide a more comprehensive understanding of sustainable coffee purchasing behaviors across Indonesian demographics. This sample size is considered adequate because it exceeds the minimum requirement of 10 times the number of indicators in the structural path of the most complex model [23], thus ensuring the robustness of the PLS-SEM analysis.
2.2 Research instruments
The research instrument was a closed questionnaire with a 5-point Likert Scale (1 = strongly disagree, 5 = strongly agree). The variables and indicators used were compiled from prior literature and adapted to the context of low-carbon footprint coffee.
The research variables include: EA, EFA, SL, TL, and PI.
This instrument is tested for validity and reliability through construct validity tests, composite reliability (CR) tests, and Average Variance Extracted (AVE). All indicators met the criteria of being valid (containing > 0.70) and reliable (CR > 0.70; AVE > 0.50).
The questionnaire items used in this study were adapted from prior literature and tailored to the context of low-carbon footprint coffee. The measurement items presented in Table 1 represent the final indicators retained after reliability and validity testing during the measurement model evaluation. The way that section titles and other headings are displayed in these instructions is meant to be followed in your paper.
2.3 Data collection procedure
Data collection is conducted online via digital survey platforms, as the target population comprises urban consumers who are generally active on social media and familiar with technology. The questionnaire was distributed through social media.
2.4 Data analysis techniques
Data analysis is carried out through two stages:
The data is analyzed using SmartPLS 4 software.
Table 1. Measurement items
|
Construct |
Item Code and Questionnaire Statement |
|
EA |
EA1 I understand that the coffee production process can produce carbon emissions [24]. EA2 I learned that consuming eco-friendly coffee can reduce the negative impact on nature [5]. EA3 I am aware that coffee consumption with a low carbon footprint has a positive impact on society [24]. |
|
EFA |
EFA1 I think that buying eco-friendly coffee is a positive thing [25]. EFA2 I feel proud when I buy eco-friendly coffee [26]. EFA3 I consider that the benefits of eco-friendly coffee are worth the price [27]. |
|
SL |
SL1 My social environment supports the consumption of eco-friendly coffee [28]. SL2 I often hear friends or family talk about eco-friendly coffee [28]. SL3 Consumption of eco-friendly coffee is in accordance with my lifestyle [25]. SL4 I feel comfortable when consuming eco-friendly coffee in public places [29]. |
|
TL |
TL1 I believe in "eco-friendly" labels on coffee packaging [30]. TL2 I feel like the "low carbon footprint" label increases my confidence in the product [31]. TL3 I believe that eco-labels on coffee products can be verified for their truth [30]. TL4 I feel that eco-labels help me make informed purchasing decisions [27]. |
|
PI |
PI1 I plan to buy eco-friendly coffee in the near future [32]. PI2 I intend to try a low-carbon coffee that I have never tried before [33]. PI3 I am interested in buying eco-friendly coffee on a regular basis [34]. |
3.1 Characteristics of respondents
A total of 300 respondents participated in this study. The majority of respondents were coffee consumers aged 20-35 years (62%), with a minimum level of education (74%). Most live in urban areas (Bandung, Jakarta, Yogyakarta, and Surabaya) and are used to buying coffee both in packaged form and through modern coffee shops. About 68% of respondents reported having heard of the terms “carbon footprint” and “sustainability label”, although their understandings of them varied.
This characteristic reflects the urban consumer segment that is the main target of coffee companies’ consumer-based sustainability management strategies.
3.2 Test outer model
External model analysis was conducted to assess the validity and reliability of the indicators used in the study. The results of the external model test are presented in Table 2.
Table 2. Results of outer loading convergent validity test
|
|
Variable |
||||
|
|
EA |
TL |
EFA |
SL |
PI |
|
EA1 |
0.802 |
|
|
|
|
|
EA2 |
0.763 |
|
|
|
|
|
EA3 |
0.763 |
|
|
|
|
|
TL1 |
|
0.851 |
|
|
|
|
TL2 |
|
0.859 |
|
|
|
|
TL3 |
|
0.840 |
|
|
|
|
TL4 |
|
0.843 |
|
|
|
|
EFA1 |
|
|
0.809 |
|
|
|
EFA2 |
|
|
0.814 |
|
|
|
EFA3 |
|
|
0.848 |
|
|
|
SL1 |
|
|
|
0.851 |
|
|
SL2 |
|
|
|
0.798 |
|
|
SL3 |
|
|
|
0.876 |
|
|
SL4 |
|
|
|
0.800 |
|
|
PI1 |
|
|
|
|
0.897 |
|
PI2 |
|
|
|
|
0.790 |
|
PI3 |
|
|
|
|
0.885 |
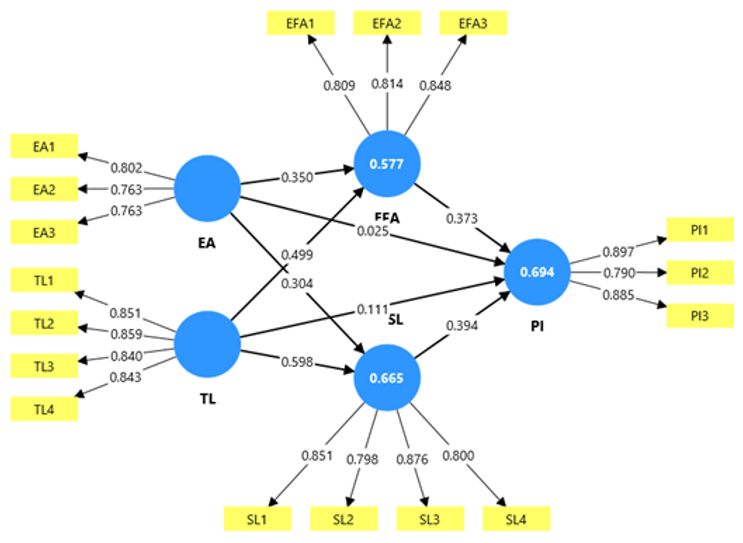
The convergent validity test showed that all indicators had factor loadings above 0.70; hence, the research model is shown in Figure 1.
Figure 1 shows that the indicators used explain the latent variables well. The estimated AVE is shown in Table 3.
Table 3. Average Variance Extracted (AVE) convergent validity test results
|
Variable |
AVE |
Information |
|
EA |
0.602 |
Valid |
|
PI |
0.737 |
Valid |
|
EFA |
0.679 |
Valid |
|
SL |
0.692 |
Valid |
|
TL |
0.719 |
Valid |
Based on Table 3, the AVE values for all variables were above 0.50, namely: EA (0.602), PI (0.737), EFA (0.679), SL (0.692), and TL (0.719). Thus, all variables can be declared valid.
In terms of reliability, the Cronbach’s Alpha values for all variables in the good category are shown in Table 4.
Table 4. Alpha Cronbach
|
Variable |
Alpha Cronbach |
rho_c |
AVE |
Information |
|
EA |
0.670 |
0.820 |
0.602 |
Reliable |
|
PI |
0.821 |
0.894 |
0.737 |
Reliable |
|
EFA |
0.763 |
0.864 |
0.679 |
Reliable |
|
SL |
0.851 |
0.900 |
0.692 |
Reliable |
|
TL |
0.870 |
0.911 |
0.719 |
Reliable |
EA has Cronbach's α > 0 (0.670; slightly below 0.70) but is retained because CR (rho_c) = 0.752 > 0.70 and AVE = 0.563.50. In the context of PLS-SEM, CR is generally seen as more appropriate than Cronbach's alpha in the SEM framework based on the weights of the estimated indicators [35].
The validity of the discriminator was tested using the Fornell-Larcker criteria. Table 5 below shows that the square root of AVE for each construct (diagonal values) exceeds the correlations between constructs, indicating adequate discriminant validity.
Table 5. Discriminant validity (Fornell-Larcker criterion)
|
Construct |
EA |
EFA |
SL |
TL |
PI |
|
EA |
0.750 |
0.512 |
0.468 |
0.501 |
0.312 |
|
EFA |
0.512 |
0.683 |
0.607 |
0.499 |
0.615 |
|
SL |
0.468 |
0.607 |
0.720 |
0.598 |
0.686 |
|
TL |
0.501 |
0.499 |
0.598 |
0.758 |
0.398 |
|
PI |
0.312 |
0.615 |
0.686 |
0.398 |
0.681 |
Table 6. Heterotrait-monotrait ratio (HTMT) results
|
Construct |
EA |
EFS |
SL |
TL |
PI |
|
EA |
- |
0.612 |
0.541 |
0.582 |
0.387 |
|
EFA |
0.612 |
- |
0.721 |
0.598 |
0.743 |
|
SL |
0.541 |
0.721 |
- |
0.710 |
0.814 |
|
TL |
0.582 |
0.598 |
0.710 |
- |
0.471 |
|
PI |
0.387 |
0.743 |
0.814 |
0.471 |
- |
As an additional test, the HTMT criterion is also used. Table 6 shows that all HTMT ratios are below the 0.90 threshold, thus demonstrating a satisfactory discriminant validity according to the HTMT criteria.
3.3 Test inner model (R²)
The analysis of the R² value indicates how much of the variability in the dependent variables is explained by the independent variables in the model, as shown in Table 7.
Table 7. R² test results
|
Dependent Variable |
R² |
R² Adjusted |
|
PI |
0.694 |
0.690 |
|
EFA |
0.577 |
0.574 |
|
SL |
0.665 |
0.662 |
Table 7 explains as follows:
This fairly high R² value indicates that the research model has good predictive power and can explain consumer behavior towards low-carbon coffee.
3.4 Model fit test
The fit model evaluated with several indicators can be seen in Table 8.
Table 8. Model conformity test results
|
Evaluation Criteria |
Standard |
Results |
Interpretation |
|
SRMR |
< 0.10 |
0.066 |
Good/Excellent |
|
NFI |
> 0.70 |
0.808 |
Acceptable/Acceptable |
|
R² - PI |
> 0.50 |
0.694 |
Good/Substantial |
|
R² - EFA |
> 0.50 |
0.577 |
Good/Moderate |
|
R² - SL |
> 0.50 |
0.665 |
Good/Substantial |
|
Q² - PI |
> 0.00 |
0.518 |
Strong |
|
Q² - EFA |
> 0.00 |
0.559 |
Strong |
|
Q² - SL |
> 0.00 |
0.647 |
Strong |
|
Effect Size (f²) |
See table in section 3.7 |
See table in section 3.7 |
Details explained |
Table 8 explains as follows:
3.5 Test hypothesis (direct effects)
The results of hypothesis testing using bootstrapping yielded important findings, as shown in Table 9.
Statistical significance was evaluated using bootstrapping with 5,000 subsamples, and the results are reported using standardized path coefficients, p-values, and 95% bootstrapped confidence intervals. Table 9 shows that:
Table 9. Result path coefficient bootstrapping direct effects
|
Path Coefficients |
Original Sample (O) |
Sample Mean (M) |
Standard Deviation (STDEV) |
t-Statistics (|O/STDEV|) |
p-Values |
Note |
|
EA→PI |
0.025 |
0.022 |
0.056 |
0.445 |
0.328 |
Not supported |
|
EA→EFA |
0.350 |
0.354 |
0.070 |
4.995 |
0.000 |
Supported |
|
EA→SL |
0.304 |
0.313 |
0.071 |
4.318 |
0.000 |
Supported |
|
EFA→PI |
0.373 |
0.366 |
0.074 |
5.055 |
0.000 |
Supported |
|
SL→PI |
0.394 |
0.395 |
0.079 |
4.965 |
0.000 |
Supported |
|
TL→PI |
0.111 |
0.121 |
0.067 |
1.665 |
0.048 |
Marginal (Not Strong) |
|
TL→EFA |
0.499 |
0.496 |
0.079 |
6.296 |
0.000 |
Supported |
|
TL→SL |
0.598 |
0.590 |
0.080 |
7.504 |
0.000 |
Supported |
3.6 Mediation test (indirect effects)
Indirect effect testing revealed that TL have a strong influence on PI through mediation mechanisms, as shown in Table 10.
Indirect effect testing revealed that TL has a strong influence on PI through a mediation mechanism, as presented in Table 10. The results confirm that EFA and SL function as mediating variables that transmit the influence of EA and TL on PI. From Table 10, it can be explained that:
Table 10. Path coefficient bootstrapping results: Indirect effects
|
Path Coefficients |
Original Sample (O) |
Sample Mean (M) |
Std. Dev |
t-Statistics (O/ST) DEV) |
p-Values |
|
TL → SL→ PI |
0.236 |
0.232 |
0.054 |
4.338 |
0.000 |
|
TL → EFA → PI |
0.186 |
0.181 |
0.044 |
4.187 |
0.000 |
|
EA → SL → PI |
0.120 |
0.124 |
0.039 |
3.058 |
0.001 |
|
EA → EFA → PI |
0.131 |
0.130 |
0.039 |
3.369 |
0.000 |
3.7 Effect size (f²)
Table 11 shows that the f² assessment indicates substantial variation in each predictor’s explanatory contribution within the structural model.
Table 11. Effect size test results (f²)
|
Variable |
EA |
PI |
EFA |
SL |
TL |
|
EA |
0.001 |
0.189 |
0.180 |
||
|
PI |
|||||
|
EFA |
0.154 |
||||
|
SL |
0.136 |
||||
|
TL |
0.015 |
0.384 |
0.696 |
EA exhibits a negligible influence on PI (f² = 0.001), suggesting that increases in environmental consciousness do not meaningfully enhance consumers' purchase decisions. Nonetheless, EA provides small-to-moderate explanatory power for EFA (f² = 0.189) and SL (f² = 0.180), implying that awareness more strongly shapes attitudinal and lifestyle-related dimensions than direct behavioral intentions.
EFA demonstrates a moderate effect on PI (f² = 0.154), while SL shows a small effect (f² = 0.136). These values indicate that both constructs play a meaningful, albeit not dominant, role in predicting PI.
TL emerges as the most influential construct in the model. Although its effect on PI is minimal (f² = 0.015), it exerts a substantial influence on EFA (f² = 0.384) and an even stronger effect on SL (f² = 0.696). These results highlight that trust embedded in product labels significantly shapes consumers' attitudinal evaluations and lifestyle orientations, positioning it as a central driver in the model.
Overall, the f² outcomes confirm that TL contributes the largest effect within the structural pathways, whereas EA and attitudinal constructs exhibit more modest contributions to explaining PI. This pattern underscores the pivotal role of trust-related cues in influencing environmentally oriented consumer decision-making.
This study provides empirical evidence on the mechanisms that drive low-carbon coffee PI in Indonesia. The results of the PLS-SEM analysis reveal a complex mediation model. In particular, the influence of EA on PI is fully channeled through EFA and SL. It is most important that the TL of eco-friendly coffee emerges as the most powerful exogenous variable that exerts a strong direct influence on both mediators, but exerts a weak direct effect on the PI itself. Of the identified pathways, the strongest influences were TL → SL → PI.
4.1 The important but indirect role of Trust Labels
TL serves as an environmental quality assurance that is difficult to verify directly by consumers [9, 36, 37]. This study confirms that the direct influence of TL on PI is relatively weak. This means that even though consumers believe in eco-friendly TL, it does not automatically encourage them to buy. On the other hand, the TL functions more as a trigger for changes in attitudes and SL symbols, which then influence the PI decision. These results are in line with research showing that TL eco-friendly products have a strong effect on the formation of green consumer identities, but the direct influence on purchasing behavior is smaller [38-40].
Thus, the TL can be understood not only as a functional attribute of a product, but as a social signal that shapes consumers' perception of their social status, lifestyle, and values. In the Indonesian context, where coffee consumption is often associated with urban lifestyles and social identities [9, 38, 41, 42]. So that the symbolic function of labels becomes more and more relevant.
4.2 Environmental awareness and the "green gap"
The results of this study found that EA had no direct effect on the PI of coffee with a low carbon footprint. These findings support the concept of the green gap, which is the gap between attitudes or EA and actual behavior [12, 43, 44]. Consumers can have a high level of awareness, but economic, social, and psychological factors are often barriers to turning them into real behaviors.
Nevertheless, EA has been shown to play an important role in shaping EFA and SL. This is consistent with the Theory of Planned Behavior (TPB) [16] which states that attitudes are the result of the cognitive evaluation of a behavior. The higher a person's awareness of environmental impacts, the more likely they are to develop a positive attitude towards eco-friendly consumption.
Therefore, EA should be seen as an antecedent factor that influences attitudes and lifestyles, rather than as a direct driver of consumption behavior. In this context, a marketing communication strategy that only emphasizes the environmental education aspect may not be enough. Manufacturers need to connect environmental issues with SL values that are relevant to consumers.
4.3 The role of Eco-Friendly Attitude in encouraging Purchase Intention
The findings of this study show that EFA has a significant effect on the intention to buy coffee with a low carbon footprint. This is consistent with the TPB, which states that a positive attitude towards a behavior will increase the likelihood that a person will do so [16].
Previous studies have also supported this finding, that positive attitudes towards eco-friendly products increase consumers' tendency to buy them even at a premium price [15, 45, 46]. Similar results were also found that EFA is one of the strongest predictors of green consumption behavior [14, 47-49].
In the context of this study, EFA is formed from a combination of EA and TL. This means that consumers who are knowledgeable about the environmental impact and TL tend to have a more positive attitude towards low-carbon coffee, which ultimately increases PI.
4.4 Social & Lifestyle as the strongest mediation channel
In this study, SL factors have been shown to significantly influence PI, with a higher path coefficient than EFA. This shows that coffee consumption has a low carbon footprint not only in terms of sustainability, but is also closely linked to SL identity. Consumers who want to display an eco-friendly self-image tend to be more interested in products with a low carbon footprint label. These findings are in line with research that emphasizes that social factors such as group norms and lifestyle aspirations play a major role in shaping green consumption behaviors [50-54].
In the Indonesian context, the trend of coffee consumption in modern cafes and the increasing penetration of social media have made coffee not only a drink, but also a symbol of the urban lifestyle [42, 55, 56]. Therefore, a marketing strategy for coffee with a low carbon footprint needs to connect sustainability messages with aspects of social identity and lifestyle aspirations of consumers.
4.5 Integration and theoretical implications
Although individual constructs (EA, EFA, PI) are adapted from previous theories and research, the novelty contribution of this research lies in:
This study aims to analyze the factors that affect consumer PI for low-carbon coffee using the PLS-SEM approach, based on data from 300 respondents in Indonesia. The results showed that the TL was the most dominant variable, with a major influence on SL and EFA, which then played an important role in increasing PI. On the other hand, EA has been shown to have no direct effect on PI, but rather works indirectly through attitudes and lifestyles.
Eco-mindedness has been shown to positively affect PI, according to the TPB, aligning with SDGs 12 (Responsible Consumption and Production), while SL are the strongest mediating channels that bridge the influence of TL on PI. These findings confirm that the decision to buy low-carbon coffee is influenced more by social and symbolic factors than by cognitive awareness alone.
Thus, the most powerful pathways that drive consumer PI are: TL impact SL, and impact PI.
I would like to thank the Ministry of Education, Culture, Research, and Technology, the Directorate General of Higher Education, Research, and Technology of the Republic of Indonesia, for their research grants, which have supported this research significantly.
[1] Pinzaru, F., Dobrescu, P., Vițelar, A., Moldoveanu, I., Săniuță, A. (2023). Linking sustainability-driven factors and online knowledge sharing in business: A PLS-SEM analysis. Sustainability, 15(8): 6444. https://doi.org/10.3390/su15086444
[2] Markovic, S., Koporcic, N., Samara, G., Barkemeyer, R. (2023). Sustainability and interactive network branding in fast-changing business environments. Business Ethics, Environment & Responsibility, 32(3): 877-881. https://doi.org/10.1111/beer.12557
[3] Bunn, C., Läderach, P., Ovalle Rivera, O., Kirschke, D. (2015). A bitter cup: Climate change profile of global production of Arabica and Robusta coffee. Climatic Change, 129: 89-101. https://doi.org/10.1007/s10584-014-1306-x
[4] dos Muchangos, L.S., Mejia, C., Gupta, R., Sadreghazi, S., Kajikawa, Y. (2025). A systematic review of life cycle assessment and environmental footprint for the global coffee value chain. Environmental Impact Assessment Review, 111: 107740. https://doi.org/10.1016/j.eiar.2024.107740
[5] Nab, C., Maslin, M. (2020). Life cycle assessment synthesis of the carbon footprint of Arabica coffee: Case study of Brazil and Vietnam conventional and sustainable coffee production and export to the United Kingdom. Geo: Geography and Environment, 7(2): e00096. https://doi.org/10.1002/geo2.96
[6] Proença, J.F., Torres, A.C., Marta, B., Silva, D.S., Fuly, G., Pinto, H.L. (2022). Sustainability in the coffee supply chain and purchasing policies: A case study research. Sustainability, 14(1): 459. https://doi.org/10.3390/su14010459
[7] Usva, K., Sinkko, T., Silvenius, F., Riipi, I., Heusala, H. (2020). Carbon and water footprint of coffee consumed in Finland—life cycle assessment. The International Journal of Life Cycle Assessment, 25: 1976-1990. https://doi.org/10.1007/s11367-020-01799-5
[8] Testa, F., Iraldo, F., Vaccari, A., Ferrari, E. (2013). Why eco-labels can be effective marketing tools: Evidence from a study on Italian consumers. Business Strategy and the Environment, 24(4): 252-265. https://doi.org/10.1002/bse.1821
[9] Cai, Z., Xie, Y., Aguilar, F.X. (2017). Eco-label credibility and retailer effects on green product purchasing intentions. Forest Policy and Economics, 80: 200-208. https://doi.org/10.1016/j.forpol.2017.04.001
[10] Taufique, K.M.R., Vocino, A., Polonsky, M.J. (2017). The influence of eco-label knowledge and trust on pro-environmental consumer behaviour in an emerging market. Journal of Strategic Marketing, 25(7): 511-529. https://doi.org/10.1080/0965254X.2016.1240219
[11] ElHaffar, G., Durif, F., Dubé, L. (2020). Towards closing the attitude-intention-behavior gap in green consumption: A narrative review of the literature and an overview of future research directions. Journal of Cleaner Production, 275: 122556. https://doi.org/10.1016/j.jclepro.2020.122556
[12] Joshi, Y., Rahman, Z. (2015). Factors affecting green purchase behaviour and future research directions. International Strategic Management Review, 3(1-2): 128-143. https://doi.org/10.1016/j.ism.2015.04.001
[13] Young, W., Hwang, K., McDonald, S., Oates, C.J. (2009). Sustainable consumption: Green consumer behaviour when purchasing products. Sustainable Development, 18(1): 20-31. https://doi.org/10.1002/sd.394
[14] White, K., Habib, R., Hardisty, D.J. (2019). How to SHIFT consumer behaviors to be more sustainable: A literature review and guiding framework. Journal of Marketing, 83(3): 22-49. https://doi.org/10.1177/0022242919825649
[15] Biswas, A., Roy, M. (2015). Green products: An exploratory study on the consumer behaviour in emerging economies of the East. Journal of Cleaner Production, 87: 463-468. https://doi.org/10.1016/j.jclepro.2014.09.075
[16] Ajzen, I. (1991). The theory of planned behavior. Organizational Behavior and Human Decision Processes, 50(2): 179-211. https://doi.org/10.1016/0749-5978(91)90020-T
[17] Nguyen, T.T.H., Yang, Z., Nguyen, N., Johnson, L.W., Cao, T.K. (2019). Greenwash and green purchase intention: The mediating role of green skepticism. Sustainability, 11(9): 2653. https://doi.org/10.3390/su11092653
[18] Shams, R. (1995). Eco-labelling and environmental policy efforts in developing countries. Intereconomics, 30: 143-149. https://doi.org/10.1007/BF02927269
[19] Zhuang, W.C., Luo, X.G., Riaz, M.U. (2021). On the factors influencing green purchase intention: A meta-analysis approach. Frontiers in Psychology, 12: 644020. https://doi.org/10.3389/fpsyg.2021.644020
[20] Barbu, A., Catană, Ș.A., Deselnicu, D.C., Cioca, L.I., Ioanid, A. (2022). Factors influencing consumer behavior toward green products: A systematic literature review. International Journal of Environmental Research and Public Health, 19(24): 16568. https://doi.org/10.3390/ijerph192416568
[21] Zhang, X.Y., Dong, F. (2020). Why do consumers make green purchase decisions? Insights from a systematic review. International Journal of Environmental Research and Public Health, 17(18): 6607. https://doi.org/10.3390/ijerph17186607
[22] Groening, C., Sarkis, J., Zhu, Q.Y. (2018). Green marketing consumer-level theory review: A compendium of applied theories and further research directions. Journal of Cleaner Production, 172: 1848-1866. https://doi.org/10.1016/j.jclepro.2017.12.002
[23] Hair, J.F., Black, W.C., Babin, B.J., Anderson, R.E. (2014). Multivariate Data Analysis (7th ed.). Pearson Education Limited Harlow, Essex.
[24] van Rikxoort, H., Schroth, G., Läderach, P., Rodríguez-Sánchez, B. (2014). Carbon footprints and carbon stocks reveal climate-friendly coffee production. Agronomy for Sustainable Development, 34: 887-897. https://doi.org/10.1007/s13593-014-0223-8
[25] Windiana, L., Mazwan, M.Z., Mahdalena, G. (2021). Consumer attitudes and purchasing interests of coffee shop which implement green marketing and non-green marketing in Malang, Indonesia. E3S Web of Conferences, 232: 02010. https://doi.org/10.1051/e3sconf/202123202010
[26] Jang, Y.J., Kim, W.G., Lee, H.Y. (2015). Coffee shop consumers' emotional attachment and loyalty to green stores: The moderating role of green consciousness. International Journal of Hospitality Management, 44: 146-156. https://doi.org/10.1016/j.ijhm.2014.10.001
[27] Liu, C.C., Chen, C.W., Chen, H.S. (2019). Measuring consumer preferences and willingness to pay for coffee certification labels in Taiwan. Sustainability, 11(5): 1297. https://doi.org/10.3390/su11051297
[28] Az-zahrah, N., Junipriansa, D., Widokarti, J.R. (2025). Determinants of green purchase behavior of local coffee shop: The moderating impact of price sensitivity. Journal of Consumer Sciences, 10(1): 97-117. https://doi.org/10.29244/jcs.10.1.97-117
[29] Ko, J.H., Jeon, H.M. (2024). The impact of eco-friendly practices on Generation Z's green image, brand attachment, brand advocacy, and brand loyalty in coffee shop. Sustainability, 16(8): 3126. https://doi.org/10.3390/su16083126
[30] Gorton, M., Tocco, B., Yeh, C.H., Hartmann, M. (2021). What determines consumers' use of eco-labels? Taking a close look at label trust. Ecological Economics, 189: 107173. https://doi.org/10.1016/j.ecolecon.2021.107173
[31] Birkenberg, A., Narjes, M.E., Weinmann, B., Birner, R. (2021). The potential of carbon neutral labeling to engage coffee consumers in climate change mitigation. Journal of Cleaner Production, 278: 123621. https://doi.org/10.1016/j.jclepro.2020.123621
[32] Chen, M.F. (2020). The impacts of perceived moral obligation and sustainability self-identity on sustainability development: A theory of planned behavior purchase intention model of sustainability-labeled coffee and the moderating effect of climate change skepticism. Business Strategy and the Environment, 29(6): 2406-2419. https://doi.org/10.1002/bse.2510
[33] Samoggia, A., Busi, R. (2023). Sustainable coffee capsule consumption: Understanding Italian consumers' purchasing drivers. Frontiers in Sustainable Food Systems, 7: 1088877. https://doi.org/10.3389/fsufs.2023.1088877
[34] Wibowo, S.F., Najib, M., Sumarwan, U., Asnawi, Y.H. (2022). Rational and moral considerations in organic coffee purchase intention: Evidence from Indonesia. Economies, 10(12): 308. https://doi.org/10.3390/economies10120308
[35] Fornell, C., Larcker, D.F. (1981). Evaluating structural equation models with unobservable variables and measurement error. Journal of Marketing Research, 18(1): 39-50. https://doi.org/10.1177/002224378101800104
[36] Delmas, M.A., Grant, L.E. (2014). Eco-labeling strategies and price-premium: The wine industry puzzle. Business & Society, 53(1): 6-44. https://doi.org/10.1177/0007650310362254
[37] Riskos, K., Dekoulou, P., Mylonas, N., Tsourvakas, G. (2021). Ecolabels and the attitude-behavior relationship towards green product purchase: A multiple mediation model. Sustainability, 13(12): 6867. https://doi.org/10.3390/su13126867
[38] Lee, T.H., Fu, C.J., Chen, Y.Y. (2020). Trust factors for organic foods: Consumer buying behavior. British Food Journal, 122(2): 414-431. https://doi.org/10.1108/BFJ-03-2019-0195
[39] Nuttavuthisit, K., Thøgersen, J. (2017). The importance of consumer trust for the emergence of a market for green products: The case of organic food. Journal of Business Ethics, 140: 323-337. https://doi.org/10.1007/s10551-015-2690-5
[40] Yang, Y.Y., Xue, F., Qiao, G.H. (2024). The impact of information acquisition ability on consumers' trust in eco-labels in China: Insight of food sustainability. Frontiers in Sustainable Food Systems, 8: 1449848. https://doi.org/10.3389/fsufs.2024.1449848
[41] Samoggia, A., Riedel, B. (2018). Coffee consumption and purchasing behavior review: Insights for further research. Appetite, 129: 70-81. https://doi.org/10.1016/j.appet.2018.07.002
[42] Albab, R.U., Briyan Pratiwi, R.Z. (2024). Disability and family social relations in the film An Irish Goodbye: Semiotic analysis of Roland Barthes. Kanal: Jurnal Ilmu Komunikasi, 12(2): 40-51. https://doi.org/10.21070/kanal.v12i2.1768
[43] Carrión-Bósquez, N.G., Ortiz-Regalado, O., Veas-González, I., Naranjo-Armijo, F.G., Guerra-Regalado, W.F. (2025). The mediating role of attitude and environmental awareness in the influence of green advertising and eco-labels on green purchasing behaviors. Spanish Journal of Marketing - ESIC, 29(3): 330-350. https://doi.org/10.1108/SJME-08-2023-0217
[44] Simanjuntak, M., Nafila, N.L., Yuliati, L.N., Johan, I.R., Najib, M., Sabri, M.F. (2023). Environmental care attitudes and intention to purchase green products: Impact of environmental knowledge, word of mouth, and green marketing. Sustainability, 15(6): 5445. https://doi.org/10.3390/su15065445
[45] Sindhu, P.M., Nair, A., Gupta, A., Garg, G. (2025). Assessing green consumer behaviour: The impact of premium pricing on eco-friendly product adoption. International Journal of Environmental Science, 11(9s): 631-638. https://doi.org/10.64252/a6tjnh60
[46] Chen, C.F., Zhang, D.P., Zhu, L., Zhang, F.H. (2024). Promoting green choices: How price premium displays influence consumer preference for green products. Resources, Conservation and Recycling, 207: 107682. https://doi.org/10.1016/j.resconrec.2024.107682
[47] Hristova, V., Haralampiev, K., Vlaev, I., Karabeliova, S. (2025). Predicting pro-environmental behavior: The leading influence of environmental attitudes. Behavioral Sciences, 15(3): 291. https://doi.org/10.3390/bs15030291
[48] Liao, Y.K., Wu, W.Y., Pham, T.T. (2020). Examining the moderating effects of green marketing and green psychological benefits on customers' green attitude, value and purchase intention. Sustainability, 12(18): 7461. https://doi.org/10.3390/su12187461
[49] Zaremohzzabieh, Z., Ismail, N., Ahrari, S., Samah, A.A. (2021). The effects of consumer attitude on green purchase intention: A meta-analytic path analysis. Journal of Business Research, 132: 732-743. https://doi.org/10.1016/j.jbusres.2020.10.053
[50] Grunert, K.G., Hieke, S., Wills, J. (2014). Sustainability labels on food products: Consumer motivation, understanding and use. Food Policy, 44: 177-189. https://doi.org/10.1016/j.foodpol.2013.12.001
[51] Li, D.L., Cheng, G., Wang, C.Y. (2022). The influence of moral identity on green consumption. Frontiers in Psychology, 13: 1020333. https://doi.org/10.3389/fpsyg.2022.1020333
[52] Zheng, C., Ling, S., Cho, D. (2023). How social identity affects green food purchase intention: The serial mediation effect of green perceived value and psychological distance. Behavioral Sciences, 13(8): 664. https://doi.org/10.3390/bs13080664
[53] Feng, W.T., Wang, L.J., Gao, C.X. (2022). The influence of social crowding on consumers' preference for green products. Frontiers in Psychology, 13: 832869. https://doi.org/10.3389/fpsyg.2022.832869
[54] Gravelines, Z., Banytė, J., Dovalienė, A., Gadeikienė, A. (2022). The role of green self-identity and self-congruity in sustainable food consumption behaviour. Organizations and Markets in Emerging Economies, 13(2): 336-356. https://doi.org/10.15388/omee.2022.13.83
[55] Ridaryanthi, M., Ahmad, A.L., Dwityas, N.A. (2022). Coffee culture in Indonesia: A symbolic interactionism point of view. Jurnal Komunikasi: Malaysian Journal of Communication, 38(2): 215-230. https://doi.org/10.17576/JKMJC-2022-3802-13
[56] Widyaningsih, A., Kusumawardhani, P., Zerlina, D. (2021). Coffee culture and urban settings: Locating third place in the digital era. The cases of About Life Coffee Brewers in Tokyo and Kopi Tuku in Jakarta. In Proceedings of the ARTEPOLIS 8 - the 8th Biannual International Conference (ARTEPOLIS 2020), pp. 119-130. https://doi.org/10.2991/assehr.k.211126.014