Hasanain Anwer Faris Khalaf* | Nada Abdulmueen Hasan
© 2026 The authors. This article is published by IIETA and is licensed under the CC BY 4.0 license (http://creativecommons.org/licenses/by/4.0/).
OPEN ACCESS
Urban studies have engaged with the concept of functional dynamics as one of the fundamental drivers in reshaping the spatial structure of cities, given their role in directing the distribution of urban activities and reorganizing spatial relationships within the urban fabric. The dimensions through which functional dynamics influence spatial patterns are multifaceted, encompassing spatial, temporal, structural, social, economic, and environmental dimensions. Within this context, the research objective is directed toward "revealing the spatial dimensions of functional dynamics that influence the formation of spatial patterns". The research employed a quantitative methodology to measure and analyze the relationship between the spatial dimensions of functional dynamics comprising the spatial distribution of functions and the spatial relationships between functions and spatial patterns through a comparative analysis of three temporal phases (1920, 1958, 2023) of the historic center of Al-Kadhimiya in Baghdad, Iraq, using GIS. The research concluded that the spatial pattern of Al-Kadhimiya Center transitioned from organic monocentric concentration toward a more complex polycentric structure accompanied by increased building density and block compactness; that functional relationships produced a pattern grounded in functional specialization within urban nodes; that a complex spatial pattern emerged, balancing local proximity and general spatial separation, supported by increased accessibility and network connectivity; and the results are consistent with the spatial dimensions of functional dynamics being associated with changes in spatial patterns over time, as evidenced by the comparative spatial analysis carried out across the three study periods.
functional dynamics, spatial dimensions, spatial patterns, spatial distribution of functions, spatial relationships between functions
Functional dynamics are one of the factors shaping patterns of spatial interaction within the urban environment. Changes in the uses of urban spaces, and individuals' responses to shifts in the functions and services offered at points of interest, lead to changes in spatial interaction, the creation of new spatial links, and the reconfiguration of urban mobility flows [1]. Understanding these dynamics does not come from viewing the city’s functions as a static system within the urban space, but rather from studying them within an integrated urban system in which the components of place, time, and function interact in an interrelated manner. The various dimensions of functional dynamics provide an analytical framework that helps explain how urban functions evolve and reflect the changing and evolving nature of the contemporary urban system [2]. Consequently, these dimensions connect to morphological and organizational transformations in cities [3].
Several studies have pointed to the impact of functional dynamics and their various dimensions on spatial patterns. Aithal et al. [4] examined temporal changes in land use and the dynamic interactions of transport infrastructure, which lead to the production of diverse spatial patterns. Loureiro et al. [5] showed how dynamics of social factors, networks of family and community, economic activities in informal settlements, and self-organization processes generate spatial patterns with resilience, organic, and adaptive characteristics that are able to respond to continuous transformations. Shen and Karimi [6] and Zhang et al. [7] found that the changes in spatial density and spatial centrality of functions, the hierarchical organization of centers, the sequential change in land uses and functions within urban growth stages, the density of economic activities and their spatial distribution and the size of their centers, added to the creation of spatial locations that drew urban activities, and heightened levels of functional attraction, leading to a shift in the structure of the monocentric spatial pattern to a polycentric structure. Haryanto et al. [8] described the gradual change of urban spaces, land use, building density and the dynamic economic and demographic interactions, coupled with population growth and business expansion, resulting in the production of complex spatial patterns responding to market and social pressures. The study by Boratinskii et al. [9] considered the changes of the spatial redistribution of urban activities in the city, identification of multifunctional centers, and temporary functional patterns represented by exceptional events and disasters to understand how activities are redistributed and to form a polycentric spatial pattern. The study Jian et al. [10] revealed the characteristics of the urban structure represented by the density of buildings and heights, the degree of clustering of built masses and their spatial cohesion, and elements of vegetation cover, water bodies and ratios of solid surfaces, while the increase of the density of buildings led to the intensification of hotspots and the formation of a compact and cohesive spatial pattern within urban centers.
A review of previous studies indicates that they have directly and indirectly addressed the impact of functional dynamics on spatial patterns across multiple dimensions. Aithal et al. [4] and Loureiro et al. [5] concentrated on the overall impact of these dynamics on the formation of spatial patterns. Shen and Karimi [6] and Zhang et al. [7] investigated the temporal, structural, and economic dimensions, as well as the spatial dimension through indicators such as function distribution, urban centralization, and the formation of numerous centers. Haryanto et al. [8] introduced the socio-economic dimensions and their corresponding spatial transformations in the urban fabric and land use. Boratinskii et al. [9] considered the temporal dimension as a result of redistribution of urban activities and creation of multiple centers. Jian et al. [10] considered environmental and structural dimensions in the development of spatial patterns. The research problem was defined as “the absence of a comprehensive cognitive framework for the spatial dimensions of the functional dynamics influencing the formation of spatial patterns over time”. The aim of the research was to "reveal the impact of the spatial dimensions of functional dynamics in reshaping spatial patterns".
The research adopted the following steps to address the research problem and verify its objectives:
1. Defining the concept of spatial patterns, the concept of functional dynamics, and their various dimensions.
2. Building a theoretical framework for the spatial dimensions of functional dynamics that influence the formation of spatial patterns.
3. Measuring the indicators of the theoretical framework for three different time periods (1920, 1958, and 2023) for the historical center of Al-Kadhimiya in Baghdad, Iraq, relying on comparative analytical study and using GIS.
4. Reaching the most important findings and conclusions of the research.
5. Presenting a set of proposals and recommendations based on the results of the analysis.
The spatial pattern in urban studies generally refers to the arrangement, organization, or distribution of things, phenomena, or activities across a specific area or spaces. It describes how buildings, activities, services, and transportation networks are organized, along with the relationships between them within a specific space, thereby reflecting the city’s structure and the nature of its internal composition [11]. Spatial pattern is also viewed as a product of the complex dynamic interactions occurring within cities and the resulting impacts on functional performance, socioeconomic conditions, and environmental sustainability in urban areas. Therefore, this pattern is addressed through several fundamental concepts, such as fractal geometry, spatial flows and interactions, urban networks, and polycentric patterns [12]. Studying these helps reveal different forms of organization, such as the regular pattern, the dispersed pattern, etc., which can be applied in various disciplines [13]. These patterns help define how spaces and communities interact within the urban environment, thereby embodying a specific design approach that responds to social, economic, and environmental requirements [14].
Based on the foregoing, it is evident that spatial pattern represents the organizational expression of the distribution of elements, activities, and relationships within urban space, as the result of complex dynamic interactions that reflect the city’s structure and functional performance. It also provides an interpretive framework for understanding patterns of urban organization and analyzing the characteristics of spatial configuration, as well as how urban spaces interact and respond to social, economic, and environmental demands.
The following paragraphs will deal with both the pattern of distribution of spatial patterns and the static, variable spatial patterns of their direct relationship to the subject of research.
2.1 Distribution of spatial patterns
The distribution of spatial patterns can be analyzed by studying the distribution of points, as this study is an essential tool for understanding the patterns of formation within the urban structure, which contributes to the detection of spatial trends and the reorganization of the urban fabric. The points are represented by various elements within the city such as buildings, facilities or sites of urban activities; Among the most important of these distributions are [15]:
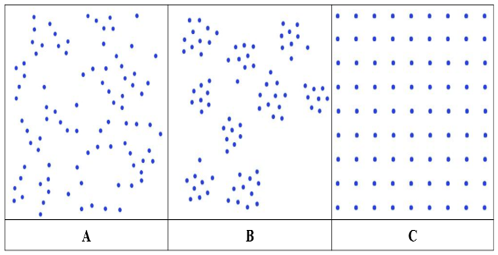
•Random distribution: it is formed when points are scattered across a certain space without a clear or predictable pattern. This type of distribution reflects the absence of centering or regularity in the distances between points, and is sometimes referred to as the default or standard pattern, because it represents a reference case to which other distribution patterns are compared; see Figure 1(A).
•Clustered distribution: occurs when points are concentrated in specific areas within space, indicating the presence of common factors or environmental, economic or social conditions that contribute to attracting these points towards certain locations. This distribution reflects functional convergence or spatial connotations that lead to the concentration of elements within specific urban spaces; see Figure 1(B).
•Uniform distribution: this forms when points are spaced evenly across limited spaces, resulting in a consistent and homogeneous pattern in the distribution. This distribution reflects the presence of planned organization or deliberate human intervention, leading to equal distances between points within the urban environment; see Figure 1(C).
It can be observed from the above that the analysis of spatial patterns through the distribution of points is considered a fundamental entry point for interpreting the characteristics of spatial organization within the urban structure. It indicates what type of placement urban elements have and what they reflect in terms of random, clustered or uniform patterns which are associated with various degrees of regularity, concentration or planning. These patterns also contribute to understanding spatial trends and the mechanisms of reorganizing the built fabric, providing an analytical basis for interpreting spatial and functional relationships that influence the formation of urban patterns.
2.2 Static and variable spatial patterns
This classification contributes to clarifying the effect of spatial patterns on the nature of organization and interaction within the city by highlighting the role of internal interaction between ecosystems and humans through time and space, supporting the formation of more resilient and sustainable urban environments [16]:
•Static spatial patterns: these are stable and permanent structures and arrangements that form the urban environment. Such patterns are characterized by their stability and their ability to withstand changes over time, and are often designed to ensure their long-term continuity. They are generally composed of physical structures and fixed urban components including streets, buildings, public squares, and different infrastructure elements [17]. They include urban planning and zoning, infrastructure networks such as transportation routes and utility distribution systems, and land-use management. These elements provide a relatively stable spatial framework for everyday activities and long-term urban planning [18]. Recent geospatial planning research further shows that the organization of land use, infrastructure, demographic distribution, and environmental constraints affects how cities balance spatial efficiency and resilience under changing conditions [19].
•Variable spatial patterns: These patterns are flexible and adaptable configurations within the urban context. They constantly evolve and reflect the nature of social interactions, economic changes, technological developments, and environmental transformations. These patterns are shaped by diverse urban activities, such as movement and mobility flows, spontaneous or informal land uses, temporary markets, and flexible public spaces that are highly adaptable to constantly changing needs and requirements, they lead to self-organization processes and reflect dynamic spatial patterns, demonstration the ability of urban areas to adapt to socio-economic transformations [20].
From the above, the classification of spatial patterns into static and variable provides a framework for the explanation of the nature of urbanism in terms of stability and adaptation. Static patterns are the spatial structure that sustains the continuity of the urban system. Variable patterns are the dynamics of interactions and transformations that change the urban space over time. This classification is helpful in explaining the ability of the cities to find a compromise between structural stability and functional resilience, thus ensuring the sustainability of the urban environment and its ability to adapt to various variables.
Functional dynamics in the urban context refer to the temporal and spatial transformations in the performance of urban functions and the city's ability to reconfigure its organizational and functional structure to maintain its flexibility and sustainability [21]. They reflect the nature of cities as complex, multi-layered systems; the city is not perceived merely as a collection of buildings or inhabitants but as a living fabric within which economic, social, and cultural functions continuously proceed [22]. It is also defined as the changing processes that urban functions experience within the urban fabric over time, encompassing not only morphological transformations in spatial form but also extending to changes in patterns of activity, the distribution of services, and economic and social interactions within the urban scope [3]. Thus, it reflects the city's ability to be resilient through its concepts such as continuity, transformation, adaptation and self-organization by adopting internal organizational mechanisms that allow the redistribution of functions and adjusting their relationships in response to internal and external forces such as policy changes, technological innovations, demographic shifts and environmental pressures. Functional dynamics are characterized by complexity, feedback, nonlinear evolution, multi-level interactions [23].
Functional dynamics involves the interaction of several dimensions, such as spatial, temporal, structural, socio-economic and environmental, which affect the paths of urban development [2]. The spatial dimension shows how functions are distributed and reorganized within the urban space and the resulting patterns of concentration or functional dispersion [3, 6]. The temporal dimension reflects successive shifts in land uses and changing jobs over time, revealing the rhythms of urban change [24, 25]. While the structural dimension expresses the structured framework of the distribution of activities, through the hierarchy of centers, infrastructure, and the shape of the urban fabric [26]. As for the social dimension, it focuses on human interactions, the level of equal access to services, and the resulting social cohesion or disparity within the city [27]. The economic dimension is concerned with the organization of productive and service activities and patterns of concentration and spatial specialization affecting the structure and development of the city [28]. While the environmental dimension demonstrates the interactive relationship between urban activities and ecosystems and their mutual influence on the efficiency and sustainability of functions within the urban system [29, 30].
From what has been presented, it is clear that functional dynamics represent a comprehensive analytical framework for understanding the continuous transformations in urban function performance, as a result of complex and multi-level interactions within the city. These dynamics reflect the urban system's ability to adapt and reorganize through space and time via mechanisms of resilience, continuity, and self-organization, while being influenced by multiple internal and external factors. They are also manifested through the interaction of their spatial, temporal, structural, social, economic, and environmental dimensions, which collectively contribute to the explanation of activity distribution patterns, urban transformation pathways, and spatial organization structure, thereby supporting the understanding of cities’ development and sustainability.
The following paragraph will discuss the spatial dimension of functional dynamics, focusing on its main components: the spatial distribution of functions and the spatial relationships between functions, on the one hand, and their impact on spatial patterns, on the other hand.
This dimension refers to how functions and activities are distributed and reorganized within urban areas [3], revealing emerging spatial patterns resulting from the continuous interaction between the physical structure and functional behavior, thus enabling the interpretation of the evolution of urban structure and its response to social, economic, and technological transformations [6]. This dimension also includes the distribution of specialized functions in specific locations or their dispersion within the urban fabric, allowing economic, social, and cultural functions to be spread across multiple urban nodes rather than concentrated in one center [3]; this dimension can be described by:
4.1 Spatial distribution of functions
The spatial distribution of urban functions reveals clear patterns of activity dispersal within the city. with this distribution shaped through a set of structural and morphological variables that determine the locations of functions and their degree of spatial concentration [31]. The Spatial density of functions is one of the most important explanatory elements of the level of clustering or dispersion within spatial units. Additionally, the types of points of interest reveal the nature of the distribution of activities along the streets and the direct relationship between function and the characteristics of the urban path. This distribution contributes to explaining how the functional structure of streets is formed as a result of the arrangement of commercial, service, and social uses [32, 33]. This distribution integrates with the horizontal level of functions, where functions tend to concentrate in sectors linked to major movement axes due to their high attraction capacity. The processes of concentration and changes in land prices are important factors in the reshaping of the location of jobs over time, as the location of some activities changes in response to changes in the urban environment, access levels, and estate value [34].
The spatial distribution of cultural, recreational, and service facilities within the urban environment exhibits a strong association with place structure and its organizational properties. The locations of these facilities are determined by a set of variables that have a direct impact on the pattern of their spread, the most important of which is the density of the road network that increases the ability of the areas to accommodate these facilities due to the ease of movement and access it provides and the density of buildings that reflects the level of urban development and increases the demand for cultural and recreational services [35]. At the level of urban blocks, the functional distribution demonstrates the impact of morphological variables such as the orientation, proximity, and size of urban blocks and the regularity of their spatial distribution. These variables help explain the functional differences between blocks and distinguish single-use environments from more diverse ones. This organization also illustrates the capacity of the urban block to accommodate various functions and the resulting varying degrees of specialization or functional mixing [36].
Zhong et al. [37] indicated the impact of the spatial distribution of functions on creating structural transformations in the spatial pattern and contributing to its evolution towards a polycentric structure and the emergence of secondary centers within the city. Wang et al. [38] demonstrated that changes in the spatial density of functions and land uses are clearly reflected in spatial patterns, as they lead to a transformation of the urban network from a grid pattern to a radial one and the emergence of a peripheral spatial pattern.
4.2 Spatial relationships between functions
These relationships are understood through the spatial interaction between urban functions, viewed as a dynamic process resulting from the heterogeneous distribution of activities within the urban fabric, where functional relationships emerge from the varying capacities of spatial units to accommodate and concentrate multiple functions, rather than as separate or static land-use patterns. This interaction is governed by spatial-functional variables, among which are the clustering and mixing of urban functions, which reflect both the degree of functional diversity and the strength of interconnection between activities within a given spatial domain [39-41]. Functional diversity directly affects the potential for substitution or integration between locations. This effect is reinforced by the intensity of human activity, which reflects the density of daily interactions and the functional attraction of different parts of the urban system. Spatial interaction is also conditioned by the distance between functional units, which regulates the intensity of their relationships according to functional composition and the degree of spatial integration among activities. Accessibility, generated partly through the efficiency and spatial configuration of transport networks, can reduce spatial barriers and strengthen functional connections [42, 43]. Recent transport-network research further indicates that heterogeneous spatial demand, stop distribution, route configuration, and first/last-mile connectivity jointly shape the operational accessibility of urban activity locations [44]. This interaction is also affected by the spatial heterogeneity of functional relationships, where the intensity and direction of interaction vary depending on the size of the spatial unit and the functional role it plays within the urban system [40].
A study by Li et al. [45] shows how indicators for the clustering and mixing of urban functions within functional integration affect spatial patterns. These indicators cause functional centralization to be reorganized within the urban fabric and increase levels of spatial connectivity, which leads to the formation of a complex central spatial pattern. Shen and Karimi [6] showed how accessibility and Inter-Functional spatial distance in spatial integration affect the movement of attraction nodes and the changing locations of function concentration. This led to the creation of subsidiary functional centers and a multi-centered spatial pattern.
Based on the foregoing, the key concepts of the spatial dimensions of functional dynamics and their associated indicators influencing spatial patterns can be summarized, as observed in Table 1.
Table 1. Vocabulary of spatial dimensions of the functional dynamics influencing spatial patterns
|
Main Vocabulary |
Secondary Vocabulary |
Indicators |
|
Spatial distribution of functions |
Spatial density of functions |
Functional density and concentration of urban functions |
|
Road network density |
||
|
Building density |
||
|
Morphological characteristics |
Urban block orientation |
|
|
Urban block proximity |
||
|
Urban block size |
||
|
Regularity of urban block distribution |
||
|
Spatial relationships between functions |
Functional integration |
Functional clustering and mixing |
|
Level of functional attraction |
||
|
Spatial integration |
Spatial accessibility |
|
|
Network connectivity |
||
|
Inter-Functional spatial distance |
The research adopted a quantitative approach supported by a temporal-spatial comparative analysis, aiming to reveal the impact of the spatial dimensions of functional dynamics in shaping the spatial patterns of the historic Al-Kadhimiya Center in Baghdad, Iraq. This approach focused on analyzing the transformations in the distribution of urban functions and examining the reciprocal spatial relationships between them, as well as evaluating the characteristics of the urban fabric over three successive time periods (1920, 1958, 2023). A set of measurable spatial indicators was also employed to compare these periods, allowing for the identification of trends in change and interpreting the nature of the impact of functional dynamics in reshaping the spatial pattern and its evolution over time.
5.1 Study area
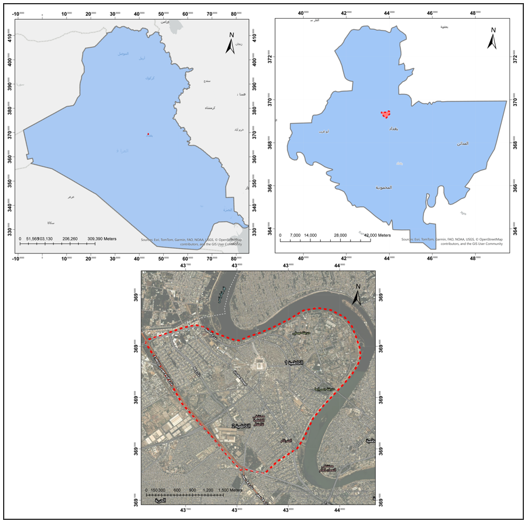
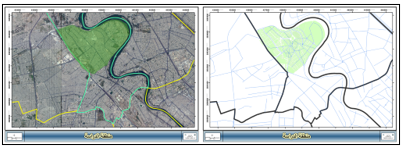
The historic Al-Kadhimiya Center in Baghdad, Iraq, has been chosen as an applied field for research due to its historical and functional uniqueness, and it has witnessed accumulated spatial transformations reflected in the distribution of activities and functions within it over time. The area also represents a suitable model for studying the relationship between functional dynamics and spatial patterns, given the changes in usage density, the evolution of the movement network, the variation in the characteristics of urban blocks, and the emergence of diverse patterns in the concentration and spread of functions within the urban space; see Figure 2.
5.2 Temporal periods
The research relied on three temporal periods representing different stages in the development of the study area, as illustrated in the following paragraphs:
5.2.1 The first temporal period: 1920
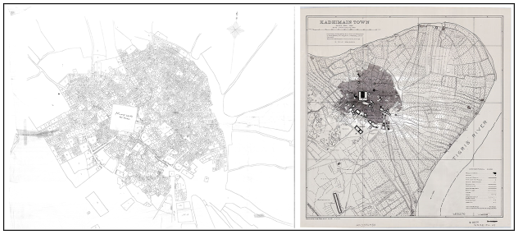
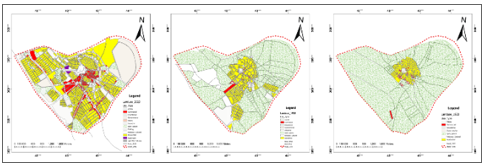
During this period, the center of Al-Kadhimiya was characterized by a cohesive and compact organic historic urban fabric that crystallized around the holy shrine, shaped by site-specific conditions, socio-religious determinants, and the prevailing construction technologies of the time. The area was further distinguished by a well-defined spatial hierarchy, transitioning from the private spaces of residential dwellings through semi-private organic alleyways and local urban spaces to public spaces and principal movement axes, a spatial organization that reinforced local connectivity, sustained spatial vitality, and ensured the continuity of daily use by both residents and visitors [46], as illustrated in Figure 3.
5.2.2 The second temporal period: 1958
During this period, the center of Al-Kadhimiya witnessed the development of expansion and obvious urban growth, as Al-Kadhimiya extended towards the south and southeast due to the population increase, the improvement of economic conditions, and the increasing job pressure on residential use. At the same time, structural transformations began to appear through the construction of straight and wide streets that led to the penetration of the traditional fabric; new road patterns emerged that combine organic, grid and radial, and as a result, commercial spread increased on the main axes as the shrine continued to dominate the urban landscape [47], as illustrated in Figure 4.
5.2.3 The third temporal period: 2023
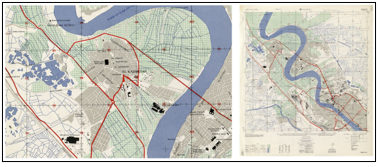
This period was marked by radical morphological transformations in the center of Al-Kadhimiya, precipitated by urban clearance operations initiated in the 1980s, through which significant portions of the historic fabric were demolished and replaced with modern multi-story structures and wide roads, accompanied by horizontal and vertical urban expansion driven by natural population growth and internal and external migration pressures. These processes resulted in the enlargement of the open space surrounding the shrine, the progressive erosion of human scale, and the growing dominance of vehicular movement and commercial land uses. They further contributed to the disappearance of numerous local urban spaces and the severance of their spatial relationships with organic alleyways, collectively undermining the spatial privacy, structural legibility, and hierarchical organization that had previously distinguished the historic urban fabric [47, 48], as illustrated in Figure 5.
5.3 Materials and methods
Map preparation and spatial data analysis were conducted using official and authoritative sources. Base maps and land-use data for the three temporal periods were primarily obtained from the Baghdad Municipality / Basic Design Department, the official institution responsible for planning and regulating the urban structure of the city. For the 2023 period, land-use data were obtained directly from the Baghdad Municipality in their latest available updated form. The dataset included land-use maps and spatial layers related to urban networks and built-fabric elements, which served as the base information for spatial analysis and indicator extraction within a GIS environment using ArcGIS Pro (version 3.6), as shown in Figure 6.
To ensure geometric consistency and metric accuracy across all analytical layers and temporal periods, all spatial data was projected using the WGS 1984 UTM Zone 38N coordinate system. The historical maps of 1920 and 1958 were matched with the base map of 2023 using fixed and identifiable ground control points, including the permanent boundaries of the Al-Kadhimiya shrine, the intersections of the main streets, and the junctions of the road network. A first-order polynomial (affine) transformation was applied (linear transformation) to correct scale, rotation and translation differences between source and reference data sets. A hexagonal tessellation grid with a unified cell area of 2000 m² was created and consistently applied across the three time periods as a common spatial aggregation layer for indicators requiring spatial comparison.
Land-use and functional data for the 1920 and 1958 periods were extracted through systematic digitization of the georeferenced historical maps and official land-use records, supported by urban documentation records and archival studies of the Al-Kadhimiya area. For the 1920 period, some land-use categories were directly indicated in the original map, providing a direct basis for functional classification. The functional categories used in the analysis were coded according to the classifications indicated in the official and historical source materials and then harmonized into a unified land-use classification to allow comparison across the three temporal periods. After digitization, the resulting vector layers were clipped to the study boundary, checked for geometric and topological consistency, and standardized before being used in the spatial analysis.
5.4 Measurement indicators and Geographic Information Systems parameters
The research relied on a set of spatial indicators to measure the spatial dimensions of functional dynamics and to reveal their impact on the spatial pattern of the historic Al-Kadhimiya Center. These indicators were organized into two main axes corresponding to the theoretical framework in this study. For each indicator, the measurement method, computational approach, and technical parameters applied within the ArcGIS Pro environment are specified to ensure transparency and reproducibility of the analytical process, as follows:
First: Indicators of the spatial distribution of functions: aimed at revealing the characteristics of concentration, extension, compactness, and variation within the urban fabric. The included indicators, spatial density for functions, road network density, and building density were adopted, in addition to morphological characteristics indicators represented in the direction, proximity, size, and regularity of urban block distribution.
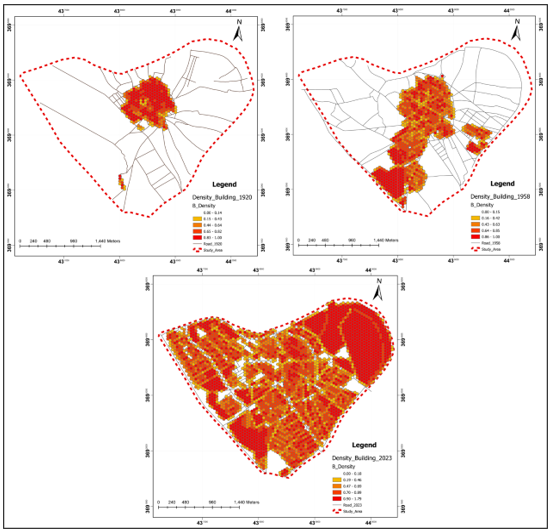
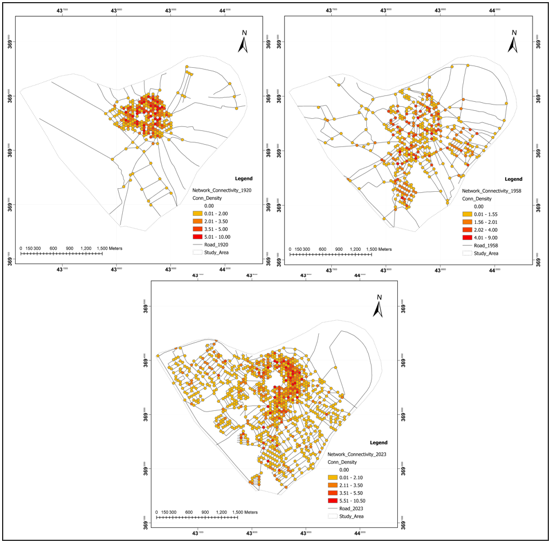
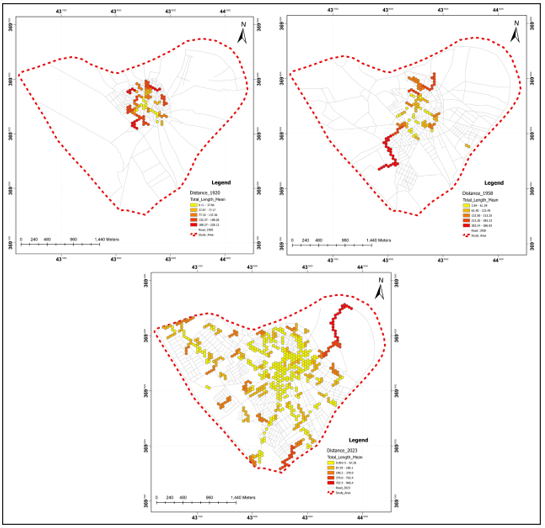
Second: Indicators of Spatial relationships between functions: These aim to measure the nature of spatial interaction between functions, the degree of their correlation, and the levels of integration within the urban space. Indicators of clustering and functional mixing, level of functional attraction, accessibility, degree of network connectivity, and inter- functions spatial distance have been adopted; Table 2 summarizes the measurement method or computational logic, the spatial unit or measurement basis, and the GIS tools and parameter settings used for each indicator, while Table 3 provides the numerical classification ranges used for the GIS indicator maps across the three temporal periods.
Table 2. Measurement methods and GIS parameters for the spatial dimension indicators of functional dynamics
|
Main Vocabulary |
Indicators |
Measurement Methods |
Spatial Unit / Measurement Basis |
GIS Tool and Parameters |
|
Spatial distribution of functions |
Functional density and concentration of urban functions |
Kernel Density Estimation (KDE) to identify concentration of urban functions |
Functional features / functional points |
Kernel Density: Input = functional points; Search radius = 150 m; Output cell size = 5 m → Classification: Natural Breaks (Jenks), 5 classes |
|
Road network density |
Road network density = Summarized road length in meters / cell area |
Road segments within hexagonal tessellation cells |
Summarize Within (hexagonal cells × road network, output = length in m) → Spatial Join → Density = Length/Cell Area → Classification: Natural Breaks (Jenks), 5 classes |
|
|
Building density |
Building density = Built-up area within cell / cell area |
Urban blocks/building polygons within hexagonal tessellation cells |
Summarize Within (hexagonal cells × building layer, output = area in m²) → Density = Area/Cell Area → Classification: Natural Breaks (Jenks), 5 classes |
|
|
Urban block orientation |
Dominant orientation angle of each urban block |
Urban block polygons |
Minimum Bounding Geometry: Input = urban blocks; Geometry Type = Rectangle by Area → Orientation extracted from MBG output → Classification: Natural Breaks (Jenks), 5 classes |
|
|
Urban block proximity |
Nearest distance between urban blocks |
Urban block polygons |
Near: Input = urban blocks; Near features = urban blocks; Search radius = unlimited → Output = NEAR_DIST (mean nearest distance) → Classification: Natural Breaks (Jenks), 5 classes |
|
|
Urban block size |
Block size = polygon area |
Individual urban block polygons |
Calculate Geometry Attributes: Input = urban blocks; Geometry property = Area (m²) → Mean, Median, SD calculated→ Classification: Natural Breaks (Jenks), 5 classes |
|
|
Regularity of urban block distribution |
Average Nearest Neighbor; CV of nearest-distance values |
Urban block centroids / block distribution |
Feature To Point (block centroids) → Average Nearest Neighbor: outputs = observed/expected distance, NN ratio, z-score, p-value → CV calculated from NEAR_DIST |
|
|
Spatial relationships between functions |
Functional clustering and mixing |
Functional mixing was measured using Shannon Entropy Index H=−∑Pi ln(Pi), normalized as H/ln(n). Functional clustering was then examined using Spatial Autocorrelation (Moran’s I) based on normalized Shannon values |
Land-use areas within hexagonal tessellation cells |
Intersect (cells × land-use) → Calculate functional proportions (Pi) → Shannon Entropy = −ΣPi ln(Pi); Normalized H/ln(n) → Spatial Autocorrelation (Moran's I) on normalized Shannon values → Outputs: Moran's I, z-score, p-value → Classification: Natural Breaks (Jenks), 5 classes |
|
Level of functional attraction |
Functional attraction= Σ(Area × Weight) / Total cell area |
Functional land-use polygons within hexagonal tessellation cells |
Assign weights: Shrine/Ataba = 5; Commercial = 4; Governmental/Educational/Cultural = 3; Industrial = 2; Residential/Storage/Garages = 1 → Score = Shape_Area × Weight → Summary Statistics (SUM_Score) → Attraction Index = SUM_Score / Cell Area → Classification: Manual Interval, 5 classes |
|
|
Spatial accessibility |
Weighted Cumulative Opportunity: accessibility score = Σ(functional weights within distance threshold) |
Functional points around hexagonal cell centroids |
Feature To Point (functional polygons → points; cells → centroids) → Summarize Nearby: summary features = weighted functional points; distance measurement = Straight line; distance = 500 m; statistic = SUM of Weight → Spatial Join to cells → Classification: Natural Breaks (Jenks), 5 classes |
|
|
Network connectivity |
Network connectivity density = (effective intersections / cell area) × 1000 |
Effective road intersections within hexagonal tessellation cells, standardized per 1,000 m² |
Planarize road network → Feature Vertices to Points (Both Start and End Vertex) → Collect Events (ICOUNT) → select effective intersections (ICOUNT ≥ 3) → Spatial Join with hexagonal cells → Conn_Density = (ICOUNT_Sum ÷ Shape_Area) × 1000 → Classification: Natural Breaks (Jenks), 5 classes |
|
|
Inter-Functional spatial distance |
Mean network-based shortest-path distance between functions |
Functional points aggregated within hexagonal tessellation cells |
Network Analyst / Closest Facility: Incidents = functional points; Facilities = functional points; impedance/cost = network length; snap/search tolerance = 50 m; Number of Facilities to Find = 2; exclude self-distance and Total_Length = 0 → retain nearest non-self distance → Spatial Join routes with cells → Mean Total_Length → Classification: Natural Breaks (Jenks), 5 classes |
Table 3. Classification ranges used for GIS indicator maps
|
Fig. |
Indicator |
Period |
Method |
Class 1 |
Class 2 |
Class 3 |
Class 4 |
Class 5 |
|
7 |
Functional density and concentration of urban functions |
1920 |
Natural Breaks (Jenks) |
0.01–63.22 |
63.23–186.79 |
186.8–321.85 |
321.86–491.39 |
491.4–732.77 |
|
1958 |
0.01–27.72 |
27.73–87.3 |
87.31–155.21 |
155.22–230.04 |
230.05–353.37 |
|||
|
2023 |
0.01–66.22 |
66.23–194.51 |
194.52–380.75 |
380.76–662.18 |
662.19–1055.34 |
|||
|
8 |
Road network density |
1920 |
Natural Breaks (Jenks) |
0.00–0.019 |
0.020–0.033 |
0.034–0.045 |
0.046–0.058 |
0.059–0.081 |
|
1958 |
0.00–0.021 |
0.022–0.034 |
0.035–0.045 |
0.046–0.064 |
0.065–0.087 |
|||
|
2023 |
0.00–0.020 |
0.021–0.033 |
0.034–0.044 |
0.045–0.056 |
0.057–0.086 |
|||
|
9 |
Building density |
1920 |
Natural Breaks (Jenks) |
0.00–0.145 |
0.146–0.426 |
0.427–0.641 |
0.642–0.820 |
0.821–1.00 |
|
1958 |
0.00–0.149 |
0.150–0.424 |
0.425–0.632 |
0.633–0.846 |
0.847–1.00 |
|||
|
2023 |
0.00–0.179 |
0.180–0.461 |
0.462–0.687 |
0.688–0.885 |
0.886–1.00 |
|||
|
10 |
Urban block orientation |
1920 |
Natural Breaks (Jenks) |
0.42–37.64 |
37.65–67.68 |
67.69–109.13 |
109.14–141.79 |
141.80–175.0 |
|
1958 |
0.22–35.36 |
35.37–64.38 |
64.39–116.66 |
116.67–147.06 |
147.07–179.0 |
|||
|
2023 |
0.34–35.76 |
35.77–75.26 |
75.27–116.92 |
116.93–148.37 |
148.38–179.0 |
|||
|
11 |
Urban block proximity |
1920 |
Natural Breaks (Jenks) |
0.00–0.00 |
0.01–2.22 |
2.23–4.13 |
4.14–6.60 |
6.61–56.14 |
|
1958 |
0.00–0.00 |
0.01–8.55 |
8.56–11.27 |
11.28–14.09 |
14.10–36.33 |
|||
|
2023 |
0.00–1.64 |
1.65–4.90 |
4.91–8.45 |
8.46–23.24 |
23.25–58.54 |
|||
|
12 |
Urban block size |
1920 |
Natural Breaks (Jenks) |
0.02–971.40 |
971.41–2443.03 |
2443.04–5807.39 |
5807.40–12004.37 |
12004.38–31021.0 |
|
1958 |
37.69–2895.91 |
2895.92–8657.10 |
8657.11–22350.07 |
22350.08–62323.94 |
62323.95–235544.0 |
|||
|
2023 |
0.00–4594.99 |
4595.00–19826.67 |
19826.68–83992.96 |
83992.97–418728.58 |
418728.59–662021.0 |
|||
|
14 |
Functional clustering and mixing |
1920 |
Natural Breaks (Jenks) |
0.00–0.12 |
0.13–0.30 |
0.31–0.48 |
0.49–0.68 |
0.69–0.91 |
|
1958 |
0.00–0.10 |
0.11–0.27 |
0.28–0.42 |
0.43–0.59 |
0.60–0.84 |
|||
|
2023 |
0.00–0.09 |
0.10–0.23 |
0.24–0.37 |
0.38–0.53 |
0.54–0.91 |
|||
|
15 |
Level of functional attraction |
1920 |
Manual Interval |
0.00–1.00 |
1.01–2.00 |
2.01–3.00 |
3.01–4.00 |
4.01–4.79 |
|
1958 |
0.00–1.00 |
1.01–2.00 |
2.01–3.00 |
3.01–4.00 |
4.01–5.00 |
|||
|
2023 |
0.00–1.00 |
1.01–2.00 |
2.01–3.00 |
3.01–4.00 |
4.01–5.00 |
|||
|
16 |
Spatial accessibility |
1920 |
Natural Breaks (Jenks) |
0.00–3.00 |
3.01–16.00 |
16.01–40.00 |
40.01–67.00 |
67.01–142.00 |
|
1958 |
0.00–3.00 |
3.01–11.00 |
11.01–22.00 |
22.01–52.00 |
52.01–136.00 |
|||
|
2023 |
3.00–20.00 |
20.01–71.00 |
71.01–147.00 |
147.01–289.00 |
289.01–503.0 |
|||
|
17 |
Network connectivity |
1920 |
Natural Breaks (Jenks) |
0.00–0.00 |
0.01–2.00 |
2.01–3.50 |
3.51–5.00 |
5.01–10.00 |
|
1958 |
0.00–0.00 |
0.01–1.55 |
1.56–2.01 |
2.02–4.00 |
4.01–9.00 |
|||
|
2023 |
0.00 – 0.00 |
0.01–2.10 |
2.11–3.50 |
3.51–5.50 |
5.51–10.50 |
|||
|
18 |
Inter-functional spatial distance |
1920 |
Natural Breaks (Jenks) |
0.11–37.86 |
37.87–77.17 |
77.18–132.36 |
132.37–188.26 |
188.27–228.0 |
|
1958 |
2.84–61.39 |
61.40–122.49 |
122.50–213.25 |
213.26–383.23 |
383.24 – 587.0 |
|||
|
2023 |
0.09–87.28 |
87.29–188.08 |
188.09–378.86 |
378.87–762.38 |
762.39–966.0 |
5.5 Study limitations and data comparability
Although official and authoritative sources of information were used, several limitations should be acknowledged regarding data comparability and the scope of the study. The three time periods differ in spatial resolution, level of detail, cartographic scale and source quality. The 2023 data were obtained directly from the Baghdad Municipality in their latest updated version and are the most accurate and detailed dataset used in the study. The 1958 maps, also obtained from official municipal sources, reflect the cartographic standards and survey techniques available at that time, which may differ from contemporary mapping practices, the 1920 maps constitute valuable historical documents; however, due to the cartographic conditions under which they were produced, they may involve a higher degree of positional uncertainty compared with the more recent datasets. These differences were considered when interpreting the comparative results of the spatial indicators.
With regard to spatial and temporal range, this study is specifically limited to the historical center of Al-Kadhimiya inside Baghdad, and its results cannot be generalized to other urban forms without further comparative research. In addition, the analysis is based on three discrete temporal snapshots, 1920, 1958, 2023. Although these periods represent key stages in the urban development of the study area, they enable a methodologically structured and systematic comparative analysis of the evolutionary trajectory of spatial patterns across time.
The analysis of spatial dimension indicators of the historic center of Al-Kadhimiya during the three temporal study periods revealed the following results.
6.1 Indicators of spatial distribution of functions
This section presents the results of the indicators used to measure the spatial distribution of functions across the three temporal periods. Table 4 provides a statistical summary of these indicators, followed by a detailed explanation of each indicator.
Table 4. Statistical summary of indicators measuring the spatial distribution of functions
|
Main Vocabulary |
Indicator |
Period |
Mean |
Median |
SD |
Min |
Max |
Unit |
NN Ratio |
Z-Score |
p-Value |
|
Spatial distribution of functions |
Functional density and concentration of urban functions |
1920 |
26.2 |
0 |
87.81 |
0.01 |
732.77 |
points/ km² |
N/A |
N/A |
N/A |
|
1958 |
36.90 |
0 |
71.90 |
0.01 |
353.37 |
N/A |
N/A |
N/A |
|||
|
2023 |
154.51 |
106.67 |
176.26 |
0.01 |
1055.34 |
N/A |
N/A |
N/A |
|||
|
Road network density |
1920 |
0.045 |
0.047 |
0.015 |
0 |
0.081 |
m/m2 |
N/A |
N/A |
N/A |
|
|
1958 |
0.038 |
0.038 |
0.013 |
0 |
0.087 |
N/A |
N/A |
N/A |
|||
|
2023 |
0.041 |
0.040 |
0.014 |
0 |
0.086 |
N/A |
N/A |
N/A |
|||
|
Building density |
1920 |
0.060 |
0 |
0.21 |
0 |
1 |
m2/m2 (0-1) |
N/A |
N/A |
N/A |
|
|
1958 |
0.157 |
0 |
0.31 |
0 |
1 |
N/A |
N/A |
N/A |
|||
|
2023 |
0.616 |
0.72 |
0.36 |
0 |
1 |
N/A |
N/A |
N/A |
|||
|
Urban block orientation |
1920 |
91 |
92 |
48 |
0.42 |
175 |
Degree |
N/A |
N/A |
N/A |
|
|
1958 |
85 |
63 |
52 |
0.22 |
179 |
N/A |
N/A |
N/A |
|||
|
2023 |
94 |
95 |
50 |
0.34 |
179 |
N/A |
N/A |
N/A |
|||
|
Urban block proximity |
1920 |
1.23 |
0 |
5.39 |
0 |
56.14 |
m |
N/A |
N/A |
N/A |
|
|
1958 |
6.66 |
8.39 |
5.64 |
0 |
36.33 |
N/A |
N/A |
N/A |
|||
|
2023 |
2.23 |
0 |
4.24 |
0 |
58.54 |
N/A |
N/A |
N/A |
|||
|
Urban block size |
1920 |
2873 |
1411 |
4439 |
0.02 |
31021 |
m2 |
N/A |
N/A |
N/A |
|
|
1958 |
5003 |
2567 |
15711 |
37.69 |
235544 |
N/A |
N/A |
N/A |
|||
|
2023 |
4644 |
1557 |
26265 |
0 |
662021 |
N/A |
N/A |
N/A |
|||
|
Regularity of urban block distribution |
1920 |
N/A |
N/A |
N/A |
N/A |
N/A |
Unitless statistical index |
1.06 |
1.55 |
0.12 |
|
|
1958 |
N/A |
N/A |
N/A |
N/A |
N/A |
0.90 |
-2.83 |
0.0046 |
|||
|
2023 |
N/A |
N/A |
N/A |
N/A |
N/A |
0.84 |
-10.07 |
< 0.001 |
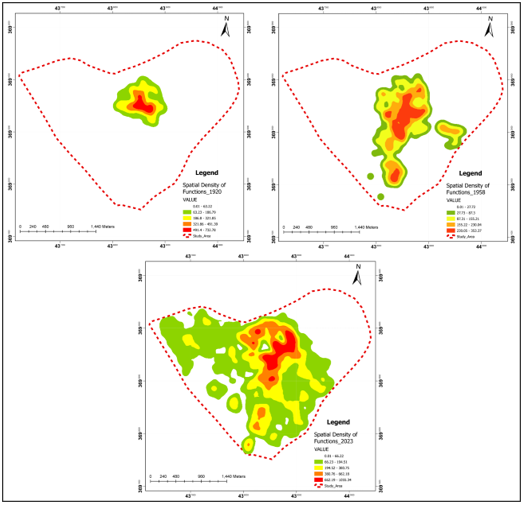
•Functional density and concentration of urban functions indicator: The results of the analysis of this indicator showed a clear discrepancy in the pattern of distribution of activities over the three temporal periods. In 1920, the highest density values were concentrated within the urban core, reflecting a concentrated functional pattern with limited extension to the periphery, but in 1958, the results showed a relative expansion in the density range, with the continued dominance of the central area, along with the emergence of secondary foci with medium densities, and in 2023, the spatial density distribution of functions clearly expanded, as it was no longer limited to one center, but several functional foci of varying density appeared within the urban fabric. These transformations indicate a gradual change in the spatial pattern of functions from monocentric to a more multiple and widespread distribution; see Figure 7.
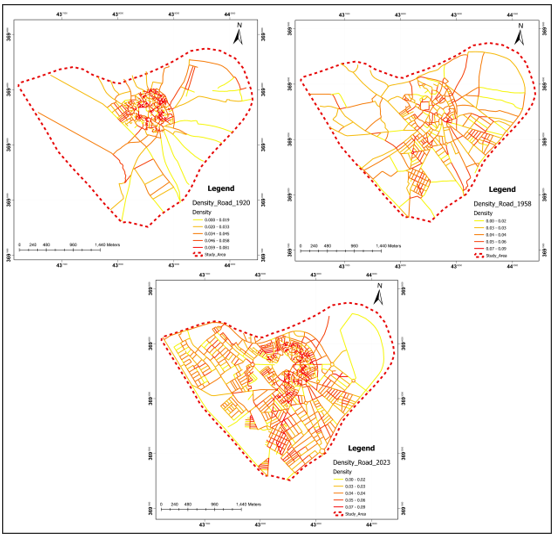
•Road network density indicator: The results of this indicator showed a clear transformation in the structure of the urban network during the three temporal periods. In 1920 the average density was around (0.045) indicating a concentration of the road network in the central part of the area and a limited extension of the network towards the peripheries, indicating a more closed spatial structure and a lower coverage of the urban space. But in 1958, the average density relatively decreased to about (0.038), which was associated with the expansion of road networks outside the central core, suggesting a growth of the network and an increased ability to cover larger parts of the urban fabric. In 2023, the average increased again to about (0.041), with a clearer expansion in the distribution of the road network and an increased degree of connectivity within the area, which reflects a more integrated and connected network structure and a greater capacity to link parts of the area within a more organized spatial framework; see Figure 8.
•Building density indicator: The results of the analysis of this indicator showed a clear transformation in the structure of urban sprawl within urban spaces over time. In 1920 the average density was about (0.060), which indicates the concentration of the urban mass within the urban core, with the periphery remaining less built, which reflects a coherent but limited urban pattern. As for the period of 1958, the average density increased to about (0.157), indicating a gradual urban expansion represented by the extension of buildings outside the central core, which reflects a transitional phase in the spatial pattern from concentration to extension. In 2023, the average density increased significantly to about (0.616), which indicates the formation of a more dense and cohesive urban fabric, with the shrinking of voids and the increasing continuity of urban blocks. This reflects a more complete and complex spatial pattern compared to the previous stages; as illustrated in Figure 9.
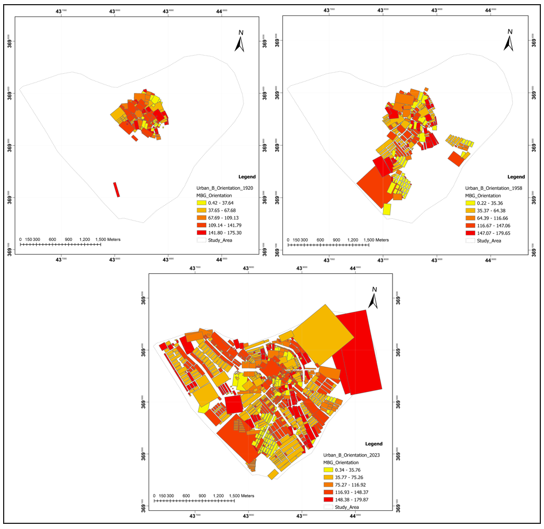
•Urban block orientation indicator: The results of this indicator showed variability across the three temporal periods, with an average direction of (91°) in 1920, decreasing to (85°) in 1958, and then increasing to (94°) in 2023. This indicates a general trend close to the horizontal axis, and the high values of the standard deviation across all periods, which ranged between (48°–52°), suggest a clear dispersion in the directions of urban masses, reflecting their non-conformity to a unified urban direction within the urban fabric. This behaviour, in turn, reveals an irregular spatial pattern in terms of orientation, as the masses are distributed in multiple directions, limiting the clarity of directional regularity in the urban structure; see Figure 10.
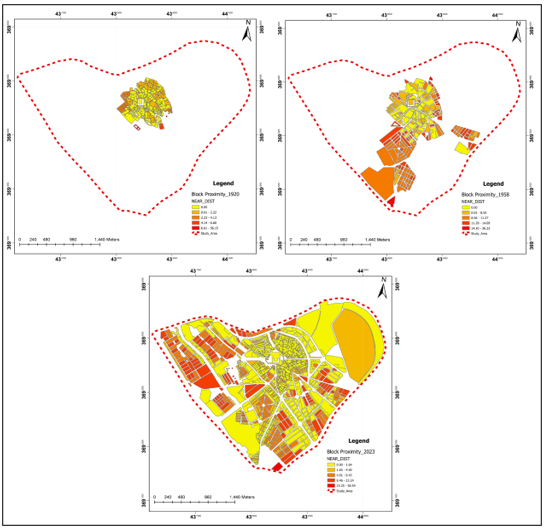
•Urban Block Proximity Indicator: The analysis of this indicator showed a clear variation in the degree of compactness and spatial separation within the urban fabric across the three temporal periods. In 1920, the mean distance value reached approximately 1.23, with a median of zero, indicating a high degree of inter-block proximity and the adjacency of a significant proportion of blocks, reflecting a compact urban fabric with limited open spaces. By 1958, the mean distance increased to approximately 6.66, signalling a growing separation between blocks and wider intervening voids, reflecting a transition toward a more open and less compact spatial configuration. In 2023, the mean distance declined to approximately 2.23, with the median returning to zero, indicating renewed block proximity and the re-emergence of clear adjacency conditions. This proximity, however, was not uniformly distributed across the entire urban space, as residual open spaces and inter-block distances persisted in certain areas, reflecting a partially compact and spatially heterogeneous pattern within the urban fabric, as illustrated in Figure 11.
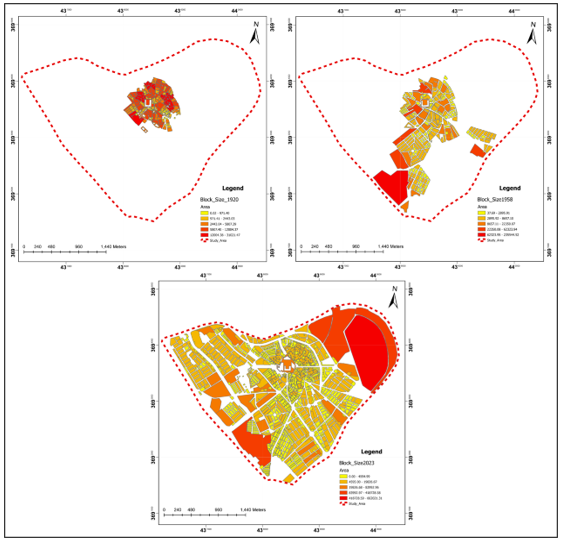
•Urban block size indicator: The results of the index showed a clear change in the structure of spatial division over time. In 1920, the average area of blocks was about (2873), with a median of (1411), which indicates the predominance of small blocks with a limited number of larger blocks. The standard deviation of (4439) also indicates that there is a marked variation in the block sizes, despite the predominance of small subdivisions, which reflects a relatively finely divided urban fabric, but in 1958, the average increased to (5003), and the median to (2567), with a significant increase in the standard deviation (15711), which indicates the appearance of larger blocks and a decrease in the degree of homogeneity in the structure of spatial division. This reflects a shift towards a less regular urban fabric and more diverse in the sizes of its blocks, and in 2023, the average reached about (4644), while the median decreased to (1557), with a very high standard deviation (26265), which indicates a sharp contrast between small and very large blocks, thereby reflecting a multi-scale spatial pattern, characterized by heterogeneity and complexity within the urban fabric; see Figure 12.
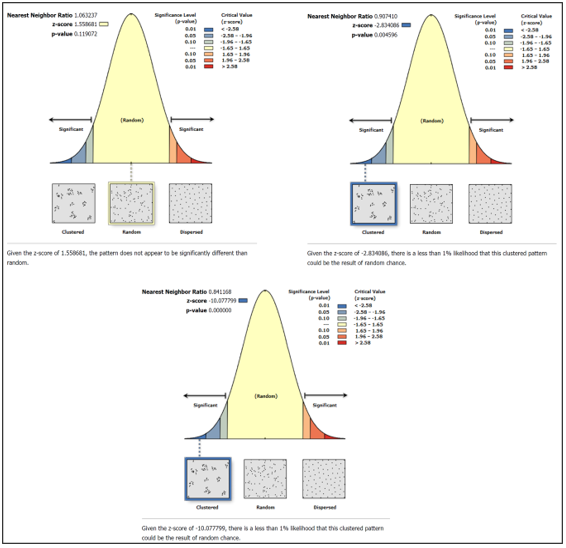
•Regularity of urban block distribution Indicator: The results of the analysis of the average nearest neighbor indicator showed a clear change in the pattern of distribution of urban blocks over time. In 1920, the value of the nearest neighbor coefficient was about (1.06), with a value of (z = 1.55), indicating that the distribution of urban blocks was close to a random pattern, without a clear statistical tendency towards regular clustering or dispersion. As for 1958, the value of the coefficient decreased to about (0.90), with a negative statistical significance (z = -2.83), which indicates a shift in distribution towards the clustered pattern as a result of the concentration of urban growth in specific areas instead of spreading in a balanced manner within the urban fabric. In 2023, the value of the coefficient further decreased to about (0.84), with a value of (z = -10.07), reflecting a highly clustered spatial pattern of urban blocks, indicating that the urban fabric has become denser and more contiguous, as the blocks are concentrated within close urban ranges instead of being distributed regularly or spaced apart; see Figure 13.
6.2 Indicators of spatial relationships between functions
This section presents the results of the indicators used to measure the spatial relationships between functions across the three temporal periods. Table 5 provides a statistical summary of these indicators, followed by a detailed discussion and interpretation of each indicator.
Table 5. Summary statistics of the indicators measuring spatial relationships between functions
|
Main Vocabulary |
Indicator |
Period |
Mean |
Median |
SD |
Min |
Max |
Unit |
Moran's I |
Z-Score |
p-Value |
|
Spatial relationships between functions |
Functional clustering and mixing (Shannon) |
1920 |
0.37 |
0.37 |
0.26 |
0 |
0.91 |
Unitless (0-1) |
N/A |
N/A |
N/A |
|
1958 |
0.24 |
0.26 |
0.21 |
0 |
0.84 |
N/A |
N/A |
N/A |
|||
|
2023 |
0.25 |
0.26 |
0.21 |
0 |
0.91 |
N/A |
N/A |
N/A |
|||
|
Functional clustering and mixing (Moran's I) |
1920 |
N/A |
N/A |
N/A |
N/A |
N/A |
Moran's I, Z, P |
0.68 |
74.35 |
< 0.001 |
|
|
1958 |
N/A |
N/A |
N/A |
N/A |
N/A |
0.51 |
55.57 |
< 0.001 |
|||
|
2023 |
N/A |
N/A |
N/A |
N/A |
N/A |
0.44 |
48 |
< 0.001 |
|||
|
Level of functional attraction |
1920 |
1.002 |
0.90 |
0.68 |
0 |
4.79 |
Index (0–5) |
N/A |
N/A |
N/A |
|
|
1958 |
1.003 |
0.76 |
0.77 |
0 |
5 |
N/A |
N/A |
N/A |
|||
|
2023 |
1.14 |
0.95 |
0.80 |
0 |
5 |
N/A |
N/A |
N/A |
|||
|
Spatial accessibility |
1920 |
15.60 |
0 |
27.93 |
0 |
142 |
Weighted score |
N/A |
N/A |
N/A |
|
|
1958 |
14.20 |
3 |
23.37 |
0 |
136 |
N/A |
N/A |
N/A |
|||
|
2023 |
149.4 |
111 |
145.4 |
3 |
503 |
N/A |
N/A |
N/A |
|||
|
Network connectivity |
1920 |
0.18 |
0 |
0.83 |
0 |
10 |
Intersection/1000 m2 |
N/A |
N/A |
N/A |
|
|
1958 |
0.18 |
0 |
0.60 |
0 |
9 |
N/A |
N/A |
N/A |
|||
|
2023 |
0.47 |
0 |
1.05 |
0 |
10.50 |
N/A |
N/A |
N/A |
|||
|
Inter-functional spatial distance |
1920 |
123 |
132 |
68 |
0.11 |
228 |
m |
N/A |
N/A |
N/A |
|
|
1958 |
226 |
181 |
178 |
2.84 |
587 |
N/A |
N/A |
N/A |
|||
|
2023 |
159 |
91 |
205 |
0.09 |
966 |
N/A |
N/A |
N/A |
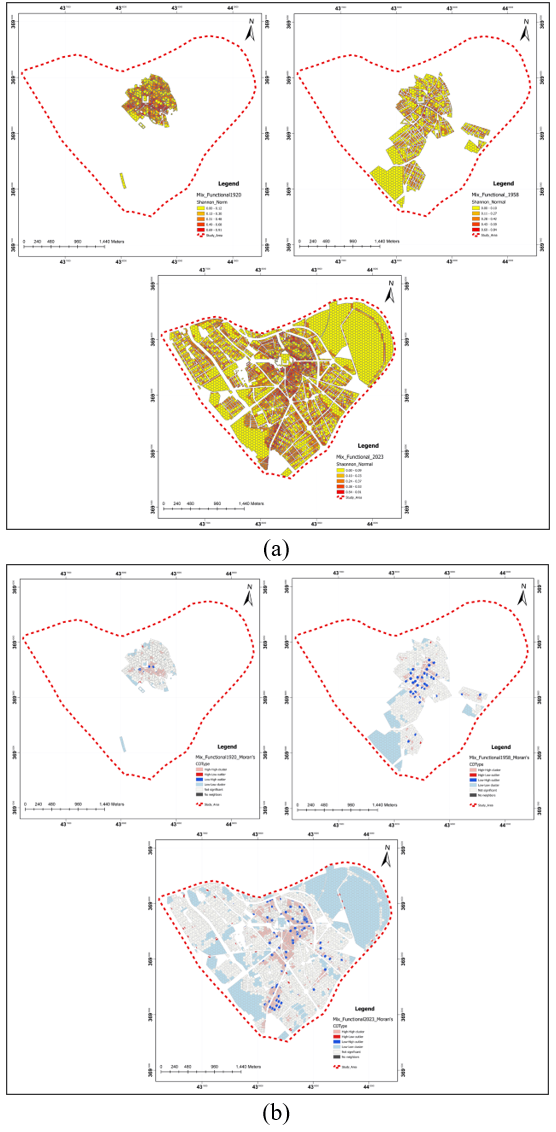
•Functional clustering and mixing indicator: The results of this indicator showed a clear variation in the nature of the spatial distribution of functional diversity across the three time periods. In the 1920 period, the (Shannon) index recorded a value of about (0.37), which indicates limited to average functional diversity, while the (Moran's I) index showed a positive spatial correlation to an average degree, reflecting the concentration of functional diversity within the urban core, but in the 1958 period, the (Shannon) value decreased to about (0.24), coinciding with the decrease in the value of (Moran's I) indicating a decrease in functional diversity and weakness in spatial agglomeration compared to 1920, and in the 2023 period, (Shannon's) value rose slightly to about (0.25), however, (Moran's I) continued to decline. Although functional diversity remained spatially clustered, the intensity of clustering became weaker over time. This reflects a gradual shift towards a more dispersed pattern of functional mixing while maintaining localized concentrations persist within specific urban areas; as illustrated in Figure 14.
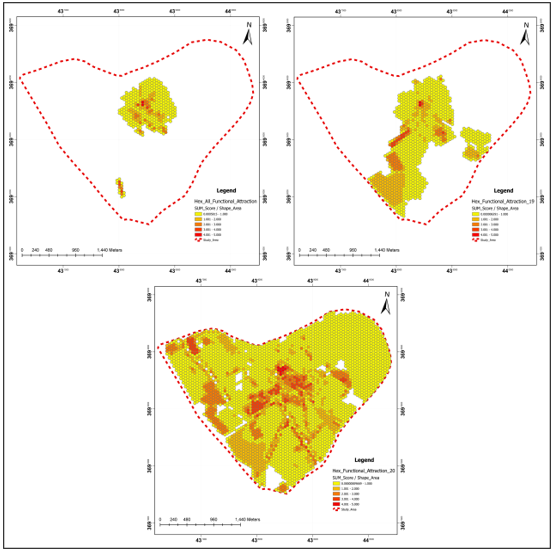
•Functional attraction level indicator: The results of the analysis of this indicator gradually showed the pattern of spatial distribution of attraction levels within the urban space over time. In 1920, the index recorded an average of about (1.002), with a clear concentration of high values within the urban core, reflecting a monocentric spatial pattern. As for 1958, the average remained almost constant at about (1.003), but the spatial distribution showed the beginning of an extension of attractions outside the traditional center, indicating a transitional stage in the redistribution of functional attraction. In 2023, the mean increased to approximately (1.14) accompanied by a notable increase in spatial variation, reflecting an expansion in the range of functional attraction and its distribution across multiple urban concentrations and signaling a structural transition from monocentric concentration toward a polycentric spatial configuration; as illustrated in Figure 15.
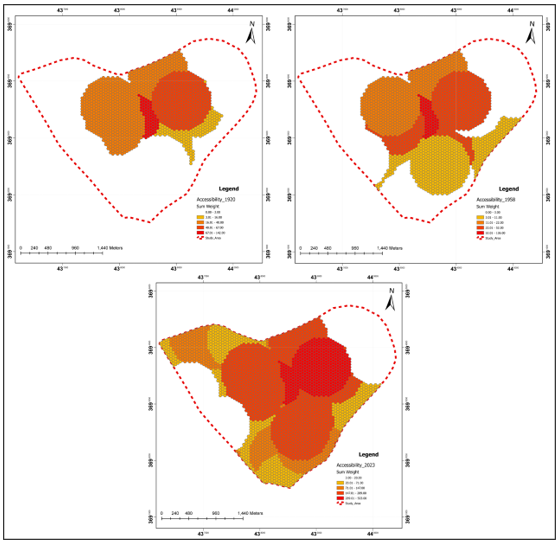
•Spatial accessibility indicator: The results of this indicator showed a clear difference in the pattern of distribution of access to urban functions in the studied periods. In 1920, the values were relatively low, with the average around (15.6), and access was concentrated in the urban core. In 1958, the mean declined to (14.2); however, the spatial distribution demonstrated a relative expansion in the accessibility range, particularly along urban axes. in 2023, the average increased significantly to (149.4), with a wide spread of high values within the urban fabric and the emergence of several access points, reflecting a shift towards a more widespread spatial pattern and a plurality of access centers, supported by the evolution of the traffic network; as illustrated in Figure 16.
•Network connectivity degree indicator: The analysis of the network connectivity degree indicator showed that there was an evident spatial and temporal change in the structure of the urban network over the study periods. The values of the indicators were relatively small in 1920, and the connections were also concentrated within a spatially limited range that is a manifestation of a simple network structure with limited connectivity. In 1958, the extension of the connections beyond the central zone was increased which indicated a transitional period in the evolution of the urban network and spatial connectivity. The findings in 2023 indicated a significant rise of the degree of connectedness of a network as well as a more widespread spread of connections across the urban landscape which was indicative of a more integrated and coherent network structure as shown on Figure 17.
•Inter-Functional spatial distance indicator: The results of the analysis of this indicator showed a clear discrepancy between the three temporal periods. In 1920, the average distance reached about (123 m), which indicates a clear functional convergence and the concentration of activities within a compact urban core with limited extension, but in 1958, the average increased to about (226 m), which indicates increasing divergence as a result of the extension of functions outside the center, In 2023, the average declined to approximately (159 m), while remaining higher than the 1920 values, reflecting a more complex spatial pattern that combines local proximity within multiple centers and relative separation at the scale of the broader urban fabric; as illustrated in Figure 18.
The results of the spatial dimension analysis of functional dynamics in the historic center of Al-Kadhimiya reveal pronounced structural transformations in the spatial pattern across the studied temporal periods. To explain these transformations within a dynamic and evolving urban context, the results are discussed within the two main concepts, as follows:
First: Spatial distribution of functions
The analytical results suggest a gradual evolution in the spatial pattern from a monocentric urban pattern to a more plural and complex one. This is consistent with the observed changes in the functional density and building density indicators, where increasing density levels contributed to the transition of the urban fabric from the traditional monocentric concentration to a more intensified spatial pattern with increased continuity of urban blocks and the gradual decline of open spaces. The road network density indicator further demonstrated a significant association with spatial reconfiguration, as increasing network density improved the accessibility and reduced the spatial isolation, contributing to the dispersion of activities beyond the traditional center and the formation of extended spatial patterns and urban centers linked to movement axes. The morphological indicators—including urban block size, orientation, proximity, and the regularity of urban block distribution—revealed that incremental urban growth was associated with an increasingly heterogeneous and multiscalar urban form, as the spatial pattern shifted from a near-random distribution to a denser and more strongly clustered configuration.
Second: Spatial relationships between functions
The analytical results reveal that these indicators appear to have played a significant role in reshaping spatial patterns. The functional clustering and mixing indicator demonstrated that increased spatial clustering of functions does not necessarily imply higher levels of functional diversity; rather, it contributed to producing a pattern grounded in functional specialization within discrete spatial foci. This transition was reinforced by the functional attraction level indicator, which was associated with the redistribution of activities leading to the transition of the spatial pattern from monocentric concentration toward a polycentric structure. In addition, accessibility, supported by a higher degree of network connectivity, also contributed to the restructuring of spatial relationships through the lowering of spatial barriers and the increase of integration among various parts of the urban fabric. The Inter-Functional spatial distance indicator also showed that the changes in levels of proximity and separation were not random, but rather part of the establishment of a complex spatial pattern combining local proximity within multiple centers and relative separation at the level of the larger urban fabric.
The research addressed the subject of functional dynamics and their influence on spatial patterns, demonstrating that the spatial pattern in cities does not constitute a static condition, but rather represents a product of complex dynamic interactions among functional dynamics across their various dimensions. The spatial pattern was examined as an expression of the organizational distribution of activities and relationships within the urban space reflecting the structural configuration of the city and its compositional attributes. In light of this, the spatial pattern can be conceptualized as an organizational outcome of the dynamic interactions between functions within the urban system. Through the analysis of point distribution patterns (random, clustered, uniform) as a fundamental analytical input for understanding the nature and directional tendencies of spatial organization within the urban fabric, the distribution of spatial patterns can be interpreted as an indicator reflecting the degree of functional concentration, dispersal, or regularity produced by the interaction of functions within the urban space. Functional dynamics can be conceptualized as continuous processes of transformation, redistribution, and adaptation, reflecting the nature of the city as a complex, multi-level system. As a key factor associated with reshaping the spatial patterns of the city over time, they are conditioned by spatial, temporal, structural, economic, social, and environmental dimensions.
The research presented a theoretical framework for the spatial dimension of functional dynamics and its influence on spatial patterns, organized around two principal constructs. The first concept was the spatial distribution of functions, encompassing the spatial density of functions, including (Functional density and concentration of urban functions, road network density, and building density) alongside morphological characteristics comprising urban (block orientation, size, proximity, and spatial distribution regularity). The second concept represented the spatial relationships between functions, encompassing functional integration, including (functional clustering and mixing, and functional attraction levels) and spatial integration, (Spatial accessibility, network connectivity degree, and inter-functional spatial distance).
The research revealed that the spatial distribution of functions appears to have played an important role in reshaping the spatial patterns of historic centers and driving their transition toward increasing complexity. Changes in functional density and concentration were associated with dismantling the monocentric pattern and directing the urban fabric toward an extended, polycentric urban structure. Road network density appears to have functioned as an effective factor associated with reducing spatial isolation and reorganizing the urban fabric by channeling functional extension beyond the traditional core, producing a spatial pattern characterized by continuity and intense urban cohesion resulting from the rapid densification of the built fabric at the expense of open spaces. These transformations, including the absence of directional regularity in urban blocks, reflect a spatially heterogeneous condition, whereby the spatial pattern of the city gradually transitioned from random distribution toward a highly dense and clustered configuration that underscores the structural complexity of the contemporary urban environment. At the level of spatial relationships, the research suggests that the nature of functional integration appears to have played a central role in the new spatial organization of activities, whereby dense functional clustering and mixing were associated with a spatial pattern grounded in functional specialization within urban nodes rather than functional diversity. Functional attraction levels, supported by increased accessibility, were associated with the redistribution of activities leading to the transition of the spatial pattern from monocentric concentration toward a polycentric structure. Furthermore, inter-functional spatial distance was linked to the formation of a complex spatial pattern that combines local proximity within multiple centers and relative separation at the scale of the broader urban fabric.
The study concluded that the changes taking place in the historic center of Al-Kadhimiya are consistent with a dynamic interaction between functional and spatial factors that coincided with the reshaping of the spatial pattern in the direction of a more complex structure with multiple activity centers, a process that took place gradually between the successive periods of the study.
This section advances a set of recommendations and suggestions for decision-makers, urban designers, and urban planners on how to guide and inform interventions aimed at reorganizing the urban fabric and directing functional extension beyond the traditional core toward a polycentric spatial structure, in relation to the key constructs of functional dynamics and their associated secondary variables, as follows:
•Redirecting the spatial distribution of functions to support the actual transition from a monocentric to a polycentric pattern through promoting the positioning of activities beyond the traditional core, rather than relying solely on formal spatial expansion.
•Leveraging the enhanced density and connectivity of the road network in modern times by focusing urban activities on highly efficient axes to ensure better spatial balance and prevent any form of overconcentration.
•Controlling the building density with appropriate policies that control heterogeneous densification without compromising the continuous character of the urban fabric and urban open spaces.
•Directing the relationship between accessibility and functional attraction beyond specific spatial zones, employing it as a strategic instrument for redistributing activities and generating new functional attraction foci within the urban fabric.
•Addressing the variation in inter-functional spatial distance by achieving a balance between local proximity within centers and regulated separation at the city scale, thereby enhancing functional efficiency without generating spatial randomness.
•Mitigating the pronounced concentration in urban activities revealed by the functional clustering and mixing indicators Shannon entropy and Moran’s I through promoting functional diversity beyond the central core and reducing mono-functional spatial dominance.
•Improving spatial accessibility efficiency by connecting peripheral areas to the urban network, thereby reducing spatial gaps and enhancing integration among the constituent parts of the urban fabric.
•Regulating the morphological characteristics of the urban fabric, particularly the dispersal and irregularity of urban block orientation, through guiding urban growth in ways that enhance spatial structural clarity and curtail spatial randomness.
•Reducing and regulating variation in urban block sizes, given its critical role in achieving spatial cohesion and limiting unorganized morphological complexity within the urban fabric.
The authors wish to express their sincere gratitude to the Department of Architectural Engineering at the University of Technology, Baghdad, for their academic support throughout the preparation of this research. The authors are very grateful to the Baghdad Municipality for the access to the spatial and land-use data used in the analysis and to the Cambridge University Library for their excellent cooperation, prompt responsiveness, effective communication and for the maps and information kindly provided. The authors also thank the reviewers for their valuable comments and constructive suggestions which helped to improve the quality and clarity of the research.
[1] Zhang, Y., Liu, W., Zhu, X., et al. (2023). Spatial interaction analysis of urban functional districts based on taxi trajectories. The International Archives of the Photogrammetry, Remote Sensing and Spatial Information Sciences, XLVIII-1/W2-2023: 383-390. https://doi.org/10.5194/isprs-archives-XLVIII-1-W2-2023-383-2023
[2] Yang, T., Zhang, Y. (2025). Urban systems science and cross-scale dynamics: A conceptual framework to advance integrated planning and governance. Transactions in Planning and Urban Research, 4(1): 3-13. https://doi.org/10.1177/27541223251325264
[3] Niu, H., Li, L., Zhao, P. (2025). Analysing the dynamics of urban functional areas in a rapidly changing spatial structure: Using points of interest data. Cities, 165: 106079. https://doi.org/10.1016/J.CITIES.2025.106079
[4] Aithal, B.H., Vinay, S., Venugopal Rao, K., Ramachandra, T.V. (2014). Prediction of spatial patterns of urban dynamics in Pune, India. In 11th IEEE India Conference: Emerging Trends and Innovation in Technology, INDICON 2014, Pune, India, pp. 1-6. https://doi.org/10.1109/INDICON.2014.7030404
[5] Loureiro, V., Medeiros, V., Guerreiro, M.R. (2017). Configuration of self-organizing informality: Socio-spatial dynamic in favelas. In Proceedings of the 11th Space Syntax Symposium, pp. 1-17. http://hdl.handle.net/10071/14581.
[6] Shen, Y., Karimi, K. (2018). Urban evolution as a spatio-functional interaction process: The case of central Shanghai. Journal of Urban Design, 23(1): 42-70. https://doi.org/10.1080/13574809.2017.1337496
[7] Zhang, J., He, X., Yuan, X.D. (2020). Research on the relationship between urban economic development level and urban spatial structure—A case study of two Chinese cities. PLoS ONE, 15(7): e0235858. https://doi.org/10.1371/JOURNAL.PONE.0235858
[8] Haryanto, R., Indriastjario, I., Saidah, K., Sugiri, A. (2020). The transformation from residential to commercial space towards dynamic space formation in central Jakarta. Planning Malaysia, 18(4): 287-298. https://doi.org/10.21837/pm.v18i14.832
[9] Boratinskii, V., Loopmans, M., Osaragi, T. (2024). Reshuffling city life: Spatial and functional dynamics of urban activity in Tokyo during COVID-19. International Journal of Urban Sciences, 28(1): 21-47. https://doi.org/10.1080/12265934.2023.2172065
[10] Jian, L., Xia, X., Wang, Y., Liu, X., Zhang, Y., Yang, Q. (2024). Spatiotemporal dynamic relationships and simulation of urban spatial form changes and land surface temperature: A case study in Chengdu, China. Frontiers in Public Health, 12: 1357624. https://doi.org/10.3389/fpubh.2024.1357624
[11] Chou, Y.H. (1995). Spatial pattern and spatial autocorrelation. Lecture Notes in Computer Science (including subseries Lecture Notes in Artificial Intelligence and Lecture Notes in Bioinformatics), 988: 365-376. https://doi.org/10.1007/3-540-60392-1_24
[12] Batty, M. (2013). The New Science of Cities. MIT Press. https://doi.org/10.7551/mitpress/9399.001.0001
[13] Huynh, H.N., Makarov, E., Legara, E.F., Monterola, C., Chew, L.Y. (2018). Characterisation and comparison of spatial patterns in urban systems: A case study of U.S. cities. Journal of Computational Science, 24: 34-43. https://doi.org/10.1016/j.jocs.2017.12.001
[14] Taghipour, M., Soltanzadeh, H., Bazr Afkan, K. (2015). The role of spatial organization in social interaction of residents of residential complexes (Case study: Two residential complexes in Shiraz, Iran). Research Journal of Applied Sciences, Engineering and Technology, 10(1): 86-93. https://doi.org/10.19026/rjaset.10.2558
[15] Dale, M.R.T., Fortin, M.J. (2014). Spatial Analysis: A Guide for Ecologists, 2nd ed. Cambridge University Press. https://doi.org/10.1017/CBO9780511978913
[16] Dadashpoor, H., Saeidi Shirvan, S. (2024). Definition and evolution of urban spatial structure. In The Encyclopedia of Human Geography, pp. 261-271. https://doi.org/10.1007/978-3-031-25900-5_207-1
[17] Lynch, K. (1960). Image of the City. MIT Press.
[18] Carmona, M. (2021). Public Places Urban Spaces: The Dimensions of Urban Design. Routledge. https://doi.org/10.4324/9781315158457
[19] Chaoui, G., Yaagoubi, R., Mastere, M. (2025). Integrating geospatial technologies and multi-criteria decision analysis for sustainable and resilient urban planning. Challenges in Sustainability, 13(1): 122-134. https://doi.org/10.56578/cis130109
[20] Batty, M. (2012). Building a science of cities. Cities, 29(SUPPL. 1): S9-S16. https://doi.org/10.1016/J.CITIES.2011.11.008
[21] van Bergen, J. (2023). ShoreScape: A landscape approach to the natural adaptation of urbanized sandy shores. Delft University of Technology. https://doi.org/10.7480/ABE.2023.09
[22] Živković, J. (2018). Urban form and function. In Encyclopedia of the UN Sustainable Development Goals, pp. 1-10. https://doi.org/10.1007/978-3-319-71063-1_78-1
[23] Xie, Y. (1996). A generalized model for cellular urban dynamics. Geographical Analysis, 28(4): 350-373. https://doi.org/10.1111/J.1538-4632.1996.TB00940.X
[24] Du, F., Wang, J., Mao, L., Kang, J. (2024). Daily rhythm of urban space usage: Insights from the nexus of urban functions and human mobility. Humanities and Social Sciences Communications, 11(1): 49. https://doi.org/10.1057/s41599-023-02577-y
[25] Tavares, A.O., Monteiro, M., Barros, J.L., Santos, P.P. (2019). Long-term land-use changes in small/medium-sized cities. Enhancing the general trends and local characteristics. European Planning Studies, 27(7): 1432-1459. https://doi.org/10.1080/09654313.2019.1588854
[26] ESPON EGTC. (2007). Study on urban functions. https://archive.espon.eu/programme/projects/espon-2006/studies-and-scientific-support-projects/study-urban-functions.
[27] Dempsey, N., Bramley, G., Power, S., Brown, C. (2011). The social dimension of sustainable development: Defining urban social sustainability. Sustainable Development, 19(5): 289-300. https://doi.org/10.1002/SD.417
[28] Dominguez-Delgado, A., Domínguez-Torres, H., Domínguez-Torres, C.-A. (2020). Energy and economic life cycle assessment of cool roofs applied to the refurbishment of social housing in southern Spain. Sustainability, 12(14): 5602. https://doi.org/10.3390/su12145602
[29] Alberti, M. (2008). Advances in Urban Ecology: Integrating Humans and Ecological Processes in Urban Ecosystems. Springer, US. https://doi.org/10.1007/978-0-387-75510-6
[30] Palumbo, M.E., Mundula, L., Balletto, G., Bazzato, E., Marignani, M. (2020). Environmental dimension into strategic planning. The case of metropolitan city of Cagliari. In Lecture Notes in Computer Science, pp. 456-471. https://doi.org/10.1007/978-3-030-58820-5_34
[31] Alobaydi, A., Alobaydi, D., Abdullah, S. (2025). Assessing the influence of urban street network on land use distribution in historic urban cores. Iraqi Journal of Architecture and Planning, 24(2): 128-140. https://doi.org/10.36041/iqjap.2025.158242.1149
[32] Li, J., Ma, Y., Jiang, J., Chen, W., Yu, N., Pan, S. (2021). The research about spatial distribution of urban functions based on POI data. In Lecture Notes in Computer Science, pp. 372-381. https://doi.org/10.1007/978-3-030-70626-5_39
[33] Lin, X., Yang, T., Law, S. (2025). From points to patterns: An explorative POI network study on urban functional distribution. Computers, Environment and Urban Systems, 117: 102246. https://doi.org/10.1016/J.COMPENVURBSYS.2024.102246
[34] Matsumura, K. (2003). Spatial development of urban functions in the center of Koriyama City. Geographical Review of Japan, 76(5): 312-332. https://doi.org/10.4157/GRJ.76.312
[35] He, D., Chen, Z., Ai, S., Zhou, J., Lu, L., Yang, T. (2021). The Spatial Distribution and Influencing Factors of Urban Cultural and Entertainment Facilities in Beijing. Sustainability, 13(21): 12252. https://doi.org/10.3390/SU132112252
[36] Zhao, Z., Zheng, X., Fan, H., Sun, M. (2021). Urban spatial structure analysis: Quantitative identification of urban social functions using building footprints. Frontiers of Earth Science, 15(3): 507-525. https://doi.org/10.1007/S11707-021-0904-Y
[37] Zhong, C., Huang, X., Arisona, S.M., Schmitt, G. (2013). Identifying spatial structure of urban functional centers using travel survey data: A case study of Singapore. In Proceedings of the First ACM SIGSPATIAL International Workshop on Computational Models of Place, New York, USA, pp. 28-33. https://doi.org/10.1145/2534848.2534855
[38] Wang, J., Mao, Q., Dang, A. (2007). An evolvement model for a metropolis: A case study on the evolution of spatial and functional patterns of Beijing City. In Proceedings, 6th International Space Syntax Symposium, İstanbul, Turkey.
[39] Xiao, H., Yang, T. (2022). Extracting spatial interaction patterns between urban road networks and mixed functions. arXiv preprint arXiv:2211.01545. https://doi.org/10.48550/arXiv.2211.01545
[40] Liu, L., Huang, H., Yang, J. (2024). Enhancing detailed planning from functional mix perspective with spatial analysis and multiscale geographically weighted regression: A case study in Shanghai central region. Land, 13(12): 2154. https://doi.org/10.3390/land13122154
[41] Khudhir, N., Khalaf, S. (2026). The role of functional diversity in urban synergy for placemaking in urban centers. Iraqi Journal of Architecture and Planning, 25(1): 111-121. https://doi.org/10.36041/iqjap.2025.161057.1171
[42] Liu, L., Chen, H., Liu, T. (2020). Study on urban spatial function mixture and individual activity space from the perspectives of resident activity. IEEE Access, 8: 184137-184150. https://doi.org/10.1109/ACCESS.2020.3029177
[43] Surya, B., Ahmad, D.N.A., Sakti, H.H., Sahban, H. (2020). Land use change, spatial interaction, and sustainable development in the metropolitan urban areas, South Sulawesi Province, Indonesia. Land, 9(3): 95. https://doi.org/10.3390/land9030095
[44] Liu, L., Tao, L., Bai, H. (2026). An intelligent design framework for customized bus networks integrating capacity-constrained clustering and route optimization. Mechatronics and Intelligent Transportation Systems, 5(2): 148-165. https://doi.org/10.56578/mits050205
[45] Li, T., Zheng, X., Zhang, C., Wang, R., Liu, J. (2022). Mining spatial correlation patterns of the urban functional areas in urban agglomeration: A case study of four typical urban agglomerations in China. Land, 11(6): 870. https://doi.org/10.3390/LAND11060870
[46] Abbas, S.S. (2008). The change of genotype in old traditional areas in Baghdad City: Analytical study using geographic information system. Iraqi Journal of Architecture and Planning, 7(14): 8. https://iqjap.uotechnology.edu.iq/journal/vol7/iss14/8.
[47] Kawther, K. (2011). The development of the planning and architectural thought of the holy city of Kadhimia in line with the spirit of the time. Journal of Planner and Development, 24: 71-98.
[48] Abdullah, S.F.K., Hussein, M.M., Alsaffar, N.H. (2023). The effect of morphological changes on the urban DNA structure in the historical city centers: Al-Kadhimiya historical centre in Iraq. Journal of the International Society for the Study of Vernacular Settlements, 10(1): 333-345.