Sabeeh Lafta Farhan* | Raghad Mahdi Alameedy | Marwa Taher Yousef Al Waeli
© 2026 The authors. This article is published by IIETA and is licensed under the CC BY 4.0 license (http://creativecommons.org/licenses/by/4.0/).
OPEN ACCESS
This study evaluates levels of urban vitality across the four neighborhoods of the historic center of Najaf—Al-Huwaish, Al-Amara, Al-Buraq, and Al-Mashraq—using a comparative spatial analysis approach with a cross-sectional design. Data were gathered through maps, aerial imagery, field surveys, observations of pedestrian and vehicular movement, and analyses of land use, morphological characteristics, public spaces, and accessibility; these metrics were subsequently integrated into a composite urban vitality index. The results revealed distinct spatial variations: Al-Huwaish recorded the highest value (88.00), followed by Al-Buraq (74.85), Al-Mashraq (61.55), and Al-Amara (52.25). The findings indicate a spatial correlation between high vitality and proximity to the Holy Shrine, as well as the density of commercial activities and pedestrian traffic, though no causal relationship was established. The study underscores the need for differentiated planning interventions that balance congestion management, the protection of residential functions, and the preservation of the heritage urban fabric. It also recommends improving connectivity and local services, alongside the evidence-based, periodic monitoring of commercial transformations.
urban vitality, historic center of Najaf, traditional neighborhoods, composite urban vitality index, land use, urban conservation
Historic centers in cities are among the most important components shaping the urban and cultural identity of communities [1]. These centers reflect the paths of urban, social, and economic development that a city has undergone over long periods [2]. They are often characterized by a rich traditional urban fabric imbued with architectural and historical values [3], in addition to being urban spaces that hold the memory of the place and reflect the social and cultural lifestyles of its inhabitants [4]. Numerous studies in urban planning and conservation have confirmed that historic centers are not merely physical remnants of the past [5], but rather living urban systems where spatial, social, and economic dimensions interact continuously [6].
With the accelerating pace of urban transformation in contemporary cities, these centers face increasing challenges related to preserving their heritage values while simultaneously responding to the demands of modern urban development [7]. Urban conservation literature indicates that the main challenge in managing historic centers lies in achieving a balance between preserving the traditional urban fabric and fostering urban vitality that ensures the continued use of these areas as active urban spaces [8, 9].
This issue becomes even more complex in historic religious cities, where the urban fabric is shaped by the continuous interaction of religious, social [10], and economic functions within a relatively limited urban space [11]. In such cities, the historic center is not merely a static heritage area [12], but a vibrant urban space that accommodates ongoing religious, cultural, and commercial activities [13, 14]. Numerous studies have shown that major religious sites often constitute urban centers of attraction that directly influence the organization of economic activity and human movement within the city [15].
The city of Najaf is one of the most prominent religious cities in the Islamic world, occupying a distinguished spiritual and scholarly position due to its association with the shrine of Imam Ali ibn Abi Talib [16], which represents the axis of the city's urban organization and its main religious and economic center of attraction [17]. This association has led to the formation of a distinctive traditional urban fabric around the holy shrine [18], characterized by a network of narrow alleyways and organic passageways connecting residential units, traditional markets, and religious institutions. This spatial organization reflects a traditional urban pattern characterized by functional hierarchy and the integration of residential, commercial, and religious spaces [19].
The historical center of Najaf consists of four main quarters that represent the traditional urban core of the old city: Al-Huwaish, Al-Amara, Al-Buraq, and Al-Mashraq [20]. Throughout history, these quarters have formed interconnected urban and social units, characterized by traditional architectural styles and an organic spatial organization that reflects the gradual development of the city over successive centuries [21]. These quarters were also linked to a range of social and economic activities connected to the religious and intellectual life that distinguishes Najaf [22].
However, these areas have witnessed rapid urban transformations in recent decades due to urban sprawl, economic and social changes, and the pressures resulting from the millions of religious pilgrims the city receives annually. These transformations have contributed to a range of challenges affecting the sustainability of the traditional urban fabric, including the deterioration of some heritage buildings, changes in land use patterns, increased population density, and a decline in the efficiency of some public spaces within the historic center [23].
Despite the existence of several initiatives and planning projects aimed at developing the historic center of Najaf, most of these efforts have focused on direct urban interventions without employing analytical tools capable of measuring levels of urban activity within the historic fabric [24]. The absence of such tools makes it difficult to understand the spatial dynamics of urban activity within these areas [25], which limits the effectiveness of planning policies aimed at preserving their architectural identity and enhancing their urban sustainability [26].
In this context, the concept of urban vitality has emerged as a key concept in contemporary urban studies. It refers to the level of social and economic activity occurring within an urban space as a result of the interaction between different activities [27], the density of human movement, and the diversity of land uses [28, 29]. Studying urban vitality in historical centers is an important tool for understanding how these areas function as active urban spaces and for identifying the factors that influence their sustainability [30].
Therefore, there is a need to develop an analytical framework for measuring urban vitality levels in the historic center of Najaf, particularly in the four quarters that form its traditional urban core. This research aims to assess urban vitality levels and analyze their spatial variations among these four quarters in the historic center of Najaf, relying on integrated morphological, functional, and dynamic indicators within a composite urban vitality index [31].
Accordingly, the research problem stems from the need to understand how urban vitality is formed within the four quarters of the historical center of Najaf [32], and to identify the urban and functional factors that influence its spatial distribution. In this context, the research poses the following main question:
How do urban vitality levels vary among the four historic quarters of Najaf, and which spatial and functional characteristics are associated with this variation?
Based on this question, the study proceeds from the hypothesis that urban vitality in the historical center of Najaf is distributed according to a spatial pattern related to proximity to the Holy Shrine and the density of associated economic activities. Analyzing this vitality using a composite index can contribute to supporting urban planning strategies aimed at revitalizing the historical center and enhancing its urban sustainability.
1.1 Contribution of scientific research
This research contributes to developing a deeper understanding of spatial variation patterns in urban vitality within the historical centers of religious cities, by providing a comparative assessment of the four neighborhoods in the historical center of the city of Najaf. Despite the historical and architectural significance of these areas, studies addressing the urban structure of Najaf's historical center remain limited, often focusing on historical or architectural aspects without a comprehensive analysis of the urban activities that constitute its daily vitality.
The main scientific contribution of this study lies in developing a composite index of urban vitality based on a set of spatial and functional indicators related to the density of commercial activity, pedestrian traffic density, land use diversity, public space efficiency, accessibility, and spatial connectivity. This index provides an analytical tool for measuring levels of urban vitality within historical centers and identifying spatial differences between their various areas.
The research also offers a comprehensive analytical reading of the urban fabric of the four quarters in Najaf's historical center by linking the morphological characteristics of the urban fabric to patterns of urban activity associated with religious and economic activity within the city. This analysis helps reveal spatial variations in urban vitality levels, which in turn helps prioritize planning interventions in these areas.
Furthermore, the research offers a set of planning recommendations that can support strategies for revitalizing historic centers in religious cities, achieving a balance between preserving the historical fabric and enhancing urban vitality. Therefore, the findings of this study can form a knowledge framework that can be used to support planning policies aimed at managing historic centers in cities with similar urban and religious characteristics.
The study employed a comparative spatial-analytical approach with a cross-sectional design, aiming to assess levels of urban vitality and explain spatial variations across four neighborhoods in the historic center of Najaf. The historic center was viewed as an interconnected urban system wherein the urban fabric, land use, movement networks, public spaces, and accessibility interact, thereby influencing the distribution of urban activity across its various parts.
The methodology was based on analyzing each neighborhood as an independent spatial unit and subsequently comparing the results with those of the other neighborhoods. The study units comprised the Al-Huwaish, Al-Amara, Al-Buraq, and Al-Mashraq neighborhoods, which constitute the traditional core of the old city surrounding the Shrine of Imam Ali. This approach enabled the identification of differences in morphological, functional, and mobility characteristics, as well as the determination of their relative relationship to urban vitality levels in each neighborhood.
The study combined the analysis of base maps, aerial photographs, and satellite imagery with field surveys of land use and urban characteristics, monitoring of pedestrian and vehicular movement, and assessments of public spaces and accessibility. Data were organized into a spatial database using Geographic Information Systems (GIS), facilitating land-use classification, the measurement of spatial indicators, and comparative analysis across the four neighborhoods.
Fieldwork was conducted between October 14–25, 2024, covering 16 observation points distributed equally among the four neighborhoods—with four points located in each. Observation points were purposively selected to represent key spatial and functional patterns, including entrances and axes leading to the Holy Shrine, markets and commercial streets, mixed-use paths, residential alleys, and local public spaces.
Observations were conducted over six days: four typical days and two days characterized by relatively high levels of religious and movement-related activity—specifically, Thursday evening and Friday. Observations took place during three daily time slots: morning (9:00–11:00), midday (13:00–15:00), and evening (17:00–19:00). Each observation session lasted 30 minutes per point, resulting in a total of 288 sessions and 144 cumulative hours of observation.
During each session, data were recorded regarding pedestrian and vehicle counts, path occupancy levels, surrounding activities, and the physical and functional characteristics of public spaces. Average readings were then calculated for each point and time slot, and results were aggregated at the neighborhood level to analyze pedestrian and vehicle movement, estimate congestion levels, and calculate urban vitality indicators.
The analysis process comprised four interconnected stages. The first stage involved characterizing the morphological structure, land uses, movement networks, and public spaces within each neighborhood. The second stage entailed processing raw data and converting them into comparable quantitative indicators. The third stage involved evaluating the indicators using a criterion-based scoring system and integrating the resulting scores into a composite urban vitality index. In the fourth stage, the results for the four localities were compared and then translated into distinct planning responses tailored to the characteristics, problems, and prevailing functions of each locality.
2.1 Study area
The study area comprises the historic center of the city of Najaf Al-Ashraf, which is considered one of the most prominent religious and historical centers in the Islamic world [33, 34]. The city originated and developed around the shrine of Imam Ali bin Abi Talib, which served as the primary nucleus for its urban layout [35, 36], in addition to acting as a religious and economic hub that attracts commercial and service activities as well as the flow of visitors [37].
These features reflect the morphological characteristics of the historic fabric and its adaptation to the pedestrian-oriented movement patterns prevalent in the old city; however, they do not serve as direct indicators of climatic comfort or social interaction, as assessing these dimensions requires independent environmental measurements and behavioral observations [24].
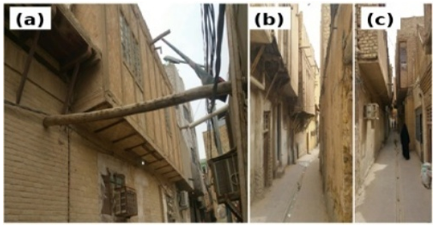
Figure 1 illustrates the visual and morphological characteristics of the traditional fabric, particularly the narrowness of the passageways, the close proximity of buildings, and the consistent low-rise architectural character. The spatial dimensions of certain alleys suggest limited accessibility for vehicles, a feature consistent with the predominance of pedestrian movement across large sections of the historic center. However, imagery alone is insufficient to assess patterns of social interaction or the level of environmental comfort within these spaces.
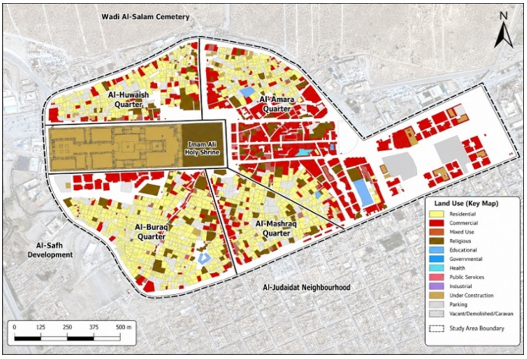
The historic center comprises four main traditional quarters—Al-Huwaish, Al-Amara, Al-Buraq, and Al-Mashraq—which are spatially and functionally linked to the Holy Shrine, the markets, and the surrounding pathways. This layout reflects an urban model wherein religious spaces, traditional markets, and residential areas integrate within an organic fabric that evolved historically around the religious core (Figure 2).
The historic center exhibits a complex functional structure characterized by the intermingling of religious, commercial, residential, and service-oriented uses. Proximity to the Holy Shrine correlates with a higher concentration of commercial and service activities, whereas residential use becomes more prevalent in areas relatively distant from the primary religious and commercial axes. To characterize this distribution and analyze its spatial variations, an analytical land-use map was created based on field survey data and GIS analysis.
The map also clarifies the functional variations among the four neighborhoods; some are more strongly associated with commercial and service activities, whereas others retain a residential, transitional, or mixed character. This spatial distribution supports an understanding of the subsequent differences in levels of urban vitality—not by positing a direct causal relationship, but by demonstrating the relative correlation between proximity to the Holy Shrine, land use patterns, and the intensity of urban activity.
Conversely, residential uses are increasingly concentrated in the peripheral areas of the study zone, particularly in neighborhoods that have largely retained their traditional residential character. A range of religious and service-oriented uses—integral to the city’s function—are also present, including religious schools, service institutions, and facilities catering to visitors.
This pattern suggests a functional gradient linked to the religious core: the density of commercial and service activities, as well as pedestrian traffic, is highest in areas closest to the shrine, whereas the residential function becomes more prominent as one moves relatively further away from the central axes. While this concentration may contribute to heightened urban vitality in certain neighborhoods, it also coincides with increased pressures—related to movement and functional demands—on the surrounding alleys, infrastructure, and public spaces.
2.2 Research sample
The spatial research sample consists of the four neighborhoods that form the traditional core of the historic center of Najaf Al-Ashraf:
•Al-Huwaish neighborhood.
•Al-Amara neighborhood.
•Al-Buraq neighborhood.
•Al-Mashraq neighborhood.
These neighborhoods were purposively selected as units for comparative spatial analysis based on several criteria: their integration into the historic fabric of the old city; their spatial and functional connection to the Holy Shrine; their retention of varying degrees of traditional urban characteristics; and the differences among them regarding land-use patterns, movement, and urban activity.
Al-Huwaish neighborhood represents an area close to the Holy Shrine, characterized by high levels of commercial and service activity as well as pedestrian traffic. Al-Amara neighborhood is predominantly residential in character, whereas Al-Buraq neighborhood combines residential and commercial functions in a more balanced manner. Al-Mashraq neighborhood serves as a transitional zone connecting parts of the historic center to the surrounding urban extensions.
Each neighborhood was treated as an independent spatial unit, and data were collected regarding its morphological characteristics, land use, pedestrian and vehicular movement, public space efficiency, and accessibility. The results were then compared across the four neighborhoods to identify relative differences in levels of urban vitality and to explain their relationship to the prevailing spatial and functional characteristics.
This sample does not represent a demographic or social sample of residents and visitors; rather, it is a spatial sample consisting of four specific urban units. Therefore, the results of the comparison are limited to the morphological, functional, and kinetic characteristics that could be measured within these locations; they do not extend to representing the views of all residents or visitors, nor their social behavioral patterns.
2.3 Data sources
The study relied on a range of spatial, urban, and field data related to the historic center of Najaf Al-Ashraf. Secondary sources included urban and base maps of the old city, aerial photographs and satellite imagery, land-use and urban planning schemes, and previous studies addressing the evolution of the historic center's urban and functional fabric.
Primary data were collected through a field survey conducted between October 14–25, 2024. This survey covered land uses, the morphological characteristics of buildings and alleyways, pedestrian and vehicular movement, the condition of public spaces, and accessibility and connectivity to main routes. Field photographs were also used to document the visual and urban characteristics of the four neighborhoods (*mahallas*), without relying on them to measure social or environmental dimensions outside the study's scope.
The collected data were organized into a spatial database using GIS, linking descriptive information to geographic locations, observation points, and neighborhood boundaries. This facilitated the creation of maps showing land use, activity distribution, and movement networks, as well as the comparison of urban and functional characteristics across the Al-Huwaish, Al-Amara, Al-Buraq, and Al-Mashraq neighborhoods.
A set of interconnected analysis tools was employed, including:
Analysis of urban maps, aerial photographs, and satellite imagery.
Morphological analysis of building coverage ratios, alleyway widths, and urban fabric compactness.
Land-use analysis, determining the proportions of residential, commercial, religious, and service-oriented uses.
Analysis of pedestrian and vehicular movement and congestion levels at observation points. Evaluating the efficiency of public spaces using an observation checklist covering physical condition, usability, amenities, and connectivity to pathways.
Analyzing accessibility and connectivity to major axes and the Holy Shrine.
Conducting a comparative spatial analysis of the four districts.
Integrating indicators into a composite index of urban vitality.
Analytical maps, tables, and charts were used to interpret the spatial relationships between land uses, movement networks, morphological characteristics, and levels of urban vitality. Additionally, field data were reviewed and cross-referenced with available maps and imagery to verify the consistency of spatial classification prior to calculating the indicators and conducting the final comparison among the four districts.
2.4 Composite urban vitality index
The study developed a composite urban vitality index to assess and compare urban vitality levels across the four historic quarters of Najaf. The index combines five spatial, functional, and movement-related dimensions: commercial and service activity, pedestrian movement, land-use diversity, public space efficiency, and accessibility. Each dimension was evaluated using a criterion-based scoring rubric derived from field observations, land-use mapping, and GIS analysis. The resulting indicator scores ranged from 0 to 100 and were subsequently combined using predetermined relative weights.
2.4.1 Definition of indicators and methods of measurement
The study adopted five sub-indicators to assess urban vitality in the four neighborhoods (Table 1). The commercial and service activity density index was measured by the ratio of commercial and service uses to total land uses in each neighborhood. The pedestrian traffic density index was measured based on the average pedestrian traffic recorded at observation points within each neighborhood.
The diversity of land uses was measured by the degree of distribution of residential, commercial, religious, and service uses, with a higher degree indicating greater functional diversity. The efficiency of public spaces was assessed using an urban monitoring form that included the physical condition of the space, its usability, the availability of facilities and services, and the continuity of surrounding activities. The accessibility index was measured based on the connectivity of the alley network, proximity to main roads, and accessibility to the holy shrine and essential services.
Table 1. Definition, measurement, and criterion-based scoring of urban vitality indicators
|
Indicator |
Raw Data |
Measurement Method |
Criterion-Based Scoring Method |
|
Commercial and service activity |
Proportion of commercial and service uses; number of active commercial and service units; active-frontage observations; temporal activity records; connection to major routes |
Calculated from the proportion of commercial and service uses, active-unit density, continuity of active frontages, continuity of activity during observation periods, and connection to major movement routes |
Weighted criterion-based score derived from commercial and service land-use share, active-unit density, frontage continuity, temporal continuity of activity, and connection to major routes, converted to a 0–100 scale |
|
Pedestrian movement |
Pedestrian counts at observation points; pedestrian share of total movement; observations by time period; path-occupancy records; pedestrian-route data |
Calculated from average pedestrian counts across observation points and periods, pedestrian share, continuity of movement throughout the day, path occupancy, and connectivity of pedestrian routes |
Weighted criterion-based score derived from average pedestrian counts, pedestrian share, temporal continuity, path occupancy, and route connectivity, converted to a 0–100 scale |
|
Land use diversity |
Proportions of residential, commercial, religious, service, and mixed land uses; number and spatial distribution of land-use categories |
Assessed according to the number of land-use categories, proportional balance among uses, degree of functional mixture, and spatial distribution of activities within each quarter |
Weighted criterion-based score based on the number, balance, mixture, and spatial distribution of land-use categories, converted to a 0–100 scale |
|
Public space efficiency |
Field observation checklist scores concerning physical condition, usability, amenities, services, and connectivity to surrounding routes |
Evaluated through a structured observation checklist covering the physical condition of public spaces, usability, availability of amenities and services, and connectivity with adjacent movement routes |
Weighted observation-checklist score based on physical condition, usability, amenities, and connectivity, converted to a 0–100 scale |
|
Accessibility |
Street- and alley-network data; distances to major routes, the Holy Shrine, and essential services; route-continuity records; entrance observations |
Assessed through GIS and field analysis of network connectivity, proximity to major routes and essential services, route continuity, accessibility to the Holy Shrine, and entrance legibility |
Weighted criterion-based score based on network connectivity, proximity to major routes and essential services, route continuity, and entrance legibility, converted to a 0–100 scale |
2.4.2 Criterion-based scoring of indicator values
Because the five indicators were derived from different types of spatial and field evidence, they were converted into comparable criterion-based scores rather than normalized against the highest and lowest values recorded among the four quarters. Each indicator comprised a set of subcriteria assessed on a six-point rating scale ranging from 0, indicating the absence of the assessed characteristic, to 5, indicating a very high level. The score of each indicator was calculated using the following equation:
$\mathrm{S}_{\mathrm{ij}}=20 \sum_{k=1}^{m j} W_{j k} R_{i j k}$
where, $S_{i j}$ is the criterion-based score of indicator $j$ for quarter $i ; R_{i j k}$ is the rating assigned to quarter $i$ for subcriterion k of indicator $j$, ranging from 0 to $5 ; W_{j k}$ is the relative weight of subcriterion $k$, with the sum of the subcriterion weights for each indicator equal to 1.00; and $m j$ is the number of subcriteria included in indicator $j$.
Accordingly, the final score represents the degree to which each quarter satisfies the spatial, functional, and movement-related criteria adopted for the respective indicator. The raw percentages and field counts presented in the results were used as inputs to the assessment rubric and were not directly converted into the final indicator scores. The detailed sub-criteria, weights, ratings, and resulting scores for the four quarters are presented in Appendix A. This formula converts the weighted average of 0–5 ratings into a score ranging from zero to 100.
2.5 Comparative analysis of the four neighborhoods
The study employed a comparative spatial analysis of the four neighborhoods—treating them as distinct urban units—to identify differences in their morphological, functional, and mobility characteristics, as well as their levels of urban vitality. The results of this comparison were used to define specific planning issues, objectives, and interventions for each neighborhood, rather than applying a uniform approach to the historic center as a whole.
2.5.1 Composite urban vitality index
A composite urban vitality index was used to integrate five key dimensions: commercial and service activity, pedestrian movement, land-use diversity, public space efficiency, and accessibility. After converting the raw values for each indicator into standardized scores ranging from 0 to 100, the index was calculated using the following equation:
CUVIi = 0.25Ci + 0.25Pi+ 0.20Li + 0.15Si + 0.15Ai
where,
Ci: Commercial and service activity score.
Pi: Pedestrian movement score.
Li: Land use diversity score.
Si: Public space efficiency score.
Ai: Accessibility score.
CUVIᵢ: Composite Urban Vitality Index value for quarter i.
These values represent standardized scores rather than the raw figures recorded in the field.
2.5.2 Indicator weights
Commercial and service activity, along with pedestrian movement, were assigned the highest relative weights due to their direct link to usage intensity and urban activity; meanwhile, lower weights were allocated to land-use diversity, the quality of public spaces, and accessibility (Table 2).
Table 2. Relative weights of urban vitality indicators
|
Indicator |
Relative Weight |
|
Commercial and service activity |
0.25 |
|
Pedestrian movement |
0.25 |
|
Land use diversity |
0.20 |
|
Public space efficiency |
0.15 |
|
Accessibility |
0.15 |
|
Total |
1.00 |
2.5.3 Calculation example
The value of the Al-Huwaish neighborhood index was calculated as follows:
CUVI = (95 × 0.25) + (90 × 0.25) + (85 × 0.20) + (70 × 0.15) + (95 × 0.15) = 88.00
This example illustrates how the five criterion-based indicator scores were combined into a single composite urban vitality value using their assigned relative weights.
2.5.4 Interpretation of indicator values
The indicator values have been classified into four levels to facilitate comparisons between locations and to prioritize planning interventions (Table 3).
Table 3. Classification of urban vitality levels
|
Index Value |
Urban Vitality Level |
|
80–100 |
Very High |
|
65–<80 |
High |
|
50–<65 |
Moderate |
|
<50 |
Low |
The classification reflects the relative level of vitality based on the indicators adopted in the study; it does not constitute a comprehensive assessment of the social, environmental, or urban quality of each neighborhood.
The results of the spatial and field analysis of the four neighborhoods in the historical center of Najaf revealed clear variations in morphological characteristics, land use distribution, movement patterns, and levels of urban vitality. This section presents the quantitative results according to the sequence of the study indicators, without introducing extensive theoretical interpretations, as their implications are discussed in the following section.
3.1 Results of the morphological analysis of the urban fabric
The results showed that the four neighborhoods are characterized by a compact urban fabric, with differences in building coverage, average alley width, and building density. Building coverage ranged between 68% and 82%, with Al-Huwaish neighborhood recording the highest percentage at 82%, followed by Al-Amara at 74%, then Al-Buraq at 70%, while Al-Mashraq recorded the lowest percentage at 68%.
The average alley width also ranged between 2.5 and 4 meters; Al-Huwaish recorded the narrowest average alley at 2.5 meters, while Al-Mashraq recorded the widest average at 4 meters. These results demonstrate a gradation in urban density, starting with Al-Huwaish as Al-Huwaish was the most morphologically compact quarter, recording the highest building coverage ratio and the narrowest average alley width.
The original values are given in Table 4 of morphological characteristics in the manuscript.
Table 4. Morphological characteristics of historical neighborhoods in the study area
|
Quarter |
Building Coverage Ratio |
Average Alley Width |
Building Density |
|
Al-Huwaish |
82% |
2.5 m |
Very High |
|
Al-Amara |
74% |
3.0 m |
High |
|
Al-Buraq |
70% |
3.5 m |
High |
|
Al-Mashraq |
68% |
4.0 m |
Moderate |
3.2 Land use analysis results
The land use analysis revealed a clear functional difference among the four neighborhoods (Table 5). Al-Huwaish recorded the highest percentage of commercial use at 55%, compared to 30% for residential use and 15% for religious and service use. This result reflects the high concentration of commercial and service activities in the neighborhood.
Table 5. Distribution of land uses in the historical neighborhoods of the study area
|
Quarter |
Residential Use |
Commercial Use |
Religious and Service Use |
|
Al-Huwaish |
30% |
55% |
15% |
|
Al-Amara |
65% |
20% |
15% |
|
Al-Buraq |
45% |
40% |
15% |
|
Al-Mashraq |
55% |
30% |
15% |
In contrast, Al-Amara recorded the highest percentage of residential use at 65%, while commercial use did not exceed 20%. Al-Buraq showed a more even distribution between residential use (45%) and commercial use (40%). Al-Mashraq recorded 55% for residential use and 30% for commercial use. These values confirm the existence of a difference in the functional structure of the four neighborhoods.
Al-Amara is characterized as a predominantly residential neighborhood, not as one with poor urban performance, because low commercial activity does not necessarily imply a low quality of residential environment.
3.3 Results of pedestrian and vehicle movement analysis
Monitoring data showed that pedestrian movement was the dominant pattern within the study area (Table 6). Al-Huwaish recorded the highest pedestrian traffic rate at 92%, compared to 8% for vehicles, and its congestion level was classified as very high. Al-Buraq recorded a pedestrian rate of 88% with a high level of congestion.
Table 6. Characteristics of pedestrian and vehicle movement in the four neighborhoods
|
Quarter |
Pedestrian Movement |
Vehicular Movement |
Congestion Level |
|
Al-Huwaish |
92% |
8% |
Very High |
|
Al-Amara |
80% |
20% |
Moderate |
|
Al-Buraq |
88% |
12% |
High |
|
Al-Mashraq |
82% |
18% |
Moderate |
Al-Mashraq recorded a pedestrian traffic rate of 82%, while Al-Amara recorded 80%, and the congestion level in both was classified as moderate. The results indicate that high pedestrian traffic rates are associated with neighborhoods that have a greater concentration of commercial and religious activities, particularly Al-Huwaish and Al-Buraq.
3.4 Composite urban vitality index results
After calculating the criterion-based scores of the five indicators and applying their relative weights, the composite urban vitality index was calculated for each quarter.
The results showed that Al-Huwaish recorded the highest index value of 88.00, placing it in the very high vitality category. Al-Buraq came in second with a value of 74.85, also in the high vitality category.
Al-Mashraq recorded a value of 61.55, classifying it as medium vitality, while Al-Amara recorded a value of 52.25, also falling within the medium vitality category. Detailed values for the index components are provided in the Table 7 in this manuscript.
Table 7. Composite urban vitality index values for the four neighborhoods
|
Quarter |
Commercial and Service Activity Score |
Pedestrian Movement Score |
Land Use Diversity Score |
Public Space Efficiency Score |
Accessibility Score |
CUVI Value |
Classification |
|
Al-Huwaish |
95 |
90 |
85 |
70 |
95 |
88.00 |
Very High |
|
Al-Buraq |
75 |
78 |
72 |
68 |
80 |
74.85 |
High |
|
Al-Mashraq |
60 |
55 |
65 |
62 |
70 |
61.55 |
Moderate |
|
Al-Amara |
40 |
50 |
55 |
60 |
65 |
52.25 |
Moderate |
3.5 Spatial distribution of urban vitality
A comparison of the index values reveals a spatial variation in the level of urban vitality among the four neighborhoods. Al-Huwaish and Al-Buraq recorded the highest values, while Al-Mashraq and Al-Amara recorded relatively lower values. This ranking aligns with the differences recorded in the density of commercial activity, pedestrian traffic, and accessibility.
The results indicate a correlation between levels of urban vitality and the degree of connection of the neighborhood to the commercial and religious axes near the Imam Ali Shrine. However, this correlation should be presented as a spatial relationship derived from the study's findings, not a definitive causal relationship, as the cross-sectional design does not establish causality.
The study results reveal a clear spatial variation in the morphological, functional, and dynamic characteristics of the four neighborhoods in the historical center of Najaf. This variation is not limited to differences in land use ratios or pedestrian traffic density, but also reflects the different roles each neighborhood plays within the urban fabric of the historical center. Therefore, levels of urban vitality should be interpreted in light of the specific functional and spatial characteristics of each neighborhood, rather than considering a high or low index value as an absolute judgment of the quality of the urban environment.
4.1 Morphological characteristics of the historical fabric
The results showed the continuity of the compact urban pattern in the four neighborhoods, with high building coverage and a narrow network of alleyways, particularly in the Al-Huwaish neighborhood. These characteristics are consistent with what studies of traditional Arab and Islamic cities have addressed regarding the interconnectedness of urban blocks, the organic nature of the traffic network, and the hierarchy of pathways between residential alleyways and commercial and religious axes.
This finding aligns with Bianca’s [4] and Hakim’s [10] analyses of the formation of the traditional urban fabric in Arab and Islamic cities through closely spaced urban units and terraced pathways suited to local daily activities. It also corroborates previous studies on Najaf, which demonstrated that the city's development around the holy shrine contributed to the creation of an urban structure with a clear religious focus and a compact urban fabric around the historical core.
However, morphological results alone do not allow for an assessment of climatic comfort or social interaction, as the study did not include thermal measurements or direct behavioral observations. Therefore, the significance of these results is limited to indicating the degree of urban compactness, building coverage ratios, alleyway widths, and their variations among the four quarters.
4.2 Land use and functional specialization
The results showed that commercial and service activities are more concentrated in Al-Huwaish and Al-Buraq, while residential use is higher in Al-Amara and Al-Mashraq. This pattern aligns with Jacobs's [6] theory linking urban vitality to the diversity of uses and the continuous presence of activities at different times. It also resonates with Montgomery's [7] model, which asserts that vitality arises from the interaction between functional diversity, pedestrian density, and spatial characteristics.
However, the study's findings also reveal that functional diversity is not evenly distributed among the four neighborhoods. Al-Huwaish is characterized by a high concentration of commercial and service activities linked to its proximity to religious centers, while Al-Buraq represents a more balanced model between residential and commercial uses. Al-Amara is distinguished by a clearer residential specialization, while Al-Mashraq plays a transitional role between the historical fabric and the surrounding urban areas.
The high residential use in Al-Amara should not be interpreted as evidence of poor urban performance. A decrease in commercial activity leads to a decrease in some components of the vitality index used in the study, but it may simultaneously reflect the continuity of the neighborhood's historical residential function. Thus, the index value in Al-Amara reflects a lower density of commercial activity and pedestrian traffic compared to other neighborhoods, and does not necessarily indicate a poor quality of life or a deteriorating residential environment.
4.3 Pedestrian movement and mobility structure
The results showed that the historic center relies heavily on pedestrian movement, with rates ranging from 80% to 92% across the four districts. This finding aligns with the literature emphasizing the importance of walkability and continuous movement in supporting the effective use of urban spaces. It also supports Gehl and Svarre's [5] argument regarding the role of pedestrian pathways in supporting street activity, particularly when they are connected to continuous commercial and service axes.
Al-Huwaish and Al-Buraq recorded the highest rates of pedestrian movement, coinciding with high rates of commercial and service use. This result indicates a spatial relationship between the concentration of activities and the density of pedestrian flow. However, the study does not prove that high pedestrian movement directly leads to increased social interaction, as its data measures the volume and percentage of movement, not the nature of social relationships or the duration of time spent within spaces.
The results also show that high pedestrian movement is not always a purely positive phenomenon; in Al-Huwaish, it was associated with a very high level of congestion. This means that high vitality may be accompanied by mobility and functional pressures, especially during pilgrimage seasons, necessitating a distinction between productive vitality and density that exceeds the capacity of the pathways.
4.4 The impact of the holy shrine on the spatial distribution of vitality
The results of the Urban Vitality Index indicate that the highest values are concentrated in the neighborhoods most connected to the Holy Shrine and its associated commercial axes. This finding aligns with previous studies on the city of Najaf, which highlighted the shrine's role in regulating urban growth, directing traffic patterns, and attracting economic and service activities.
The results also agree with studies that examined the impact of major religious events on reshaping traffic and land use within Najaf, as religious pilgrimages lead to increased demand for services, commerce, accommodation, and transportation in areas near the shrine. However, the current study adds to this literature by providing a quantitative comparison between the four neighborhoods, integrating commercial activity, pedestrian traffic, diversity of uses, efficiency of public spaces, and accessibility into a composite index.
Nevertheless, the relationship between proximity to the shrine and high vitality should be presented as a spatial relationship, not a definitive causal relationship. Because the study is cross-sectional and does not include a time analysis or a causal model that tests the effect of distance independently of the other variables.
4.5 Interpretation of urban vitality index values
Al-Huwaish recorded the highest index value, attributed to high commercial activity, pedestrian traffic, and ease of access. Al-Buraq came in second due to its diverse uses and a relative balance between residential and commercial functions. Al-Mashraq scored at an average level due to lower traffic density and commercial activity compared to Al-Huwaish and Al-Buraq, while maintaining a reasonable degree of spatial connectivity.
Al-Amara recorded the lowest relative value among the four neighborhoods, but remained within the medium vitality category according to the revised classification. This result does not imply that Al-Amara suffers from poor urban performance, but rather reflects the nature of the index, which gives high weight to commercial activity and pedestrian traffic. Since Al-Amara is a predominantly residential neighborhood, its low score reflects its functional specialization more than it indicates an overall deficiency.
Therefore, the vitality index should be interpreted as a tool for relative comparison between the study units, not as a sole criterion for judging the quality of each neighborhood. Highly vibrant areas may require interventions to reduce congestion and commercial pressure, while less active areas need to have their residential function protected and local services supported, rather than necessarily being transformed into densely populated commercial zones.
To clarify the position of the current study's findings within the literature on urban vitality and historic centers, Table 8 summarizes the points of agreement and implications drawn from comparing the results with the theoretical framework.
The comparison demonstrates that the study's findings align with the literature on the importance of land use diversity, pedestrian flow, and functional centralization in shaping urban vitality. However, the case of Najaf reveals that a decline in commercial activity does not necessarily represent urban weakness, as in the Al-Amara neighborhood, but may reflect the persistence of traditional residential functions. This finding underscores the need for differentiated planning interventions that consider the functional and heritage role of each neighborhood, rather than applying a uniform commercial revitalization policy to the entire historic center.
Table 8. Comparison of the current study's findings with the literature on urban vitality and historic centers
|
Comparison Dimension |
What the Literature Emphasizes |
Findings of the Current Study |
Implication |
|
Land use diversity |
Functional diversity supports the continuity of urban activity. |
Al-Buraq showed a greater balance between residential and commercial uses. |
Functional diversity is associated with relatively higher levels of urban vitality. |
|
Pedestrian movement |
Pedestrian flow is a key component of street activity. |
Al-Huwaish and Al-Buraq recorded the highest proportions of pedestrian movement. |
The concentration of commercial and religious activities is associated with greater pedestrian movement density. |
|
Religious centrality |
Religious sites contribute to reorganizing movement patterns and urban functions. |
Higher vitality levels were recorded in the quarters with stronger connections to the Imam Ali Shrine. |
The shrine represents a major spatial and functional attraction node. |
|
Residential specialization |
Lower commercial activity does not necessarily indicate poor urban performance. |
Al-Amara recorded lower commercial activity while maintaining a distinct residential character. |
The residential function should be protected rather than promoting generalized commercial expansion. |
|
Urban conservation |
Historic centers are living systems characterized by multiple values and functions. |
Planning problems and intervention priorities differed among the four quarters. |
The historic center requires differentiated planning responses. |
4.6 Implications for conservation and planning
The study's findings align with the historic urban landscape approach, which views historic centers as living systems where heritage values, economic, social, and mobility functions intertwine. From this perspective, conservation policies should not aim to standardize activity levels across the four neighborhoods, as each neighborhood has a distinct function within the historic center.
In Al-Huwaish, the priority is managing congestion, regulating commercial activity, and protecting the pathways leading to the shrine. In Al-Buraq, the priority is preserving functional diversity and improving spaces related to movement. In Al-Mashraq, the focus is on enhancing connectivity to the historic center and improving the continuity of pathways. In architecture, priority should be given to protecting the residential character and architectural heritage, while supporting daily services and small-scale economic activities that do not displace residents or alter the neighborhood's identity. Thus, the results confirm that planning for urban vitality does not mean maximizing commercial activity in all parts of the historic center, but rather achieving a balanced distribution of functions and traffic pressures in accordance with the spatial and heritage characteristics of each neighborhood.
The study's findings indicate that the four neighborhoods do not face the same planning challenges and do not require a single level or type of intervention. The high activity levels in some neighborhoods are linked to significant commercial and pedestrian pressure, while lower activity levels in others reflect a continued residential character or weak connections to central activities. Therefore, the study proposes differentiated planning responses based on the specific characteristics of each neighborhood, rather than applying a uniform revitalization policy to the entire historic center (Table 9).
Table 9. Differentiated planning responses for the four historic quarters of Najaf
|
Quarter |
Evidence Derived from the Results |
Main Planning Problem |
Planning Objective |
Priority Interventions |
|
Al-Huwaish |
Highest urban vitality value (88.00), 55% commercial use, 92% pedestrian movement, and a very high congestion level |
Excessive concentration of commercial activity and visitor movement, increasing pressure on the alley network and historic fabric |
Manage high urban vitality and reduce pressure without weakening economic and religious activity |
Organize pedestrian movement along the main routes; designate emergency access corridors; regulate loading and unloading times; control pavement occupation and street vending; redistribute part of the services to adjacent quarters; protect historic façades and buildings from uncontrolled commercial transformation |
|
Al-Buraq |
High urban vitality value (74.85), 40% commercial use, 45% residential use, and 88% pedestrian movement |
Potential imbalance between the residential function and commercial activity, accompanied by increasing movement pressure |
Preserve functional diversity and prevent the quarter from becoming a single-use commercial zone |
Protect mixed land use; improve small public spaces and pedestrian routes; support local economic activities; regulate conversions from residential to commercial use; rehabilitate historic buildings for compatible uses; improve connectivity with Al-Huwaish and Al-Mashraq |
|
Al-Mashraq |
Moderate urban vitality value (61.55), 30% commercial use, and 82% pedestrian movement |
Relative weakness in route continuity and connectivity between the historic center and the surrounding urban extensions |
Strengthen the quarter’s role as a transitional zone and improve its connection with the historic center |
Improve the continuity of pedestrian routes; develop a wayfinding system; rehabilitate entrances; provide distributed local services; address spatial discontinuities; improve lighting and urban furniture; avoid intensive commercial expansion that may threaten the historic urban character |
|
Al-Amara |
Lowest relative index value (52.25), 65% residential use, and 20% commercial use |
Risk of decline or displacement of the traditional residential function, combined with an insufficient level of local services |
Protect the residential and heritage character and improve daily services without imposing intensive commercial revitalization |
Protect historic residential buildings; regulate changes in property use; support adaptive reuse; provide essential neighborhood services; improve alley maintenance; restrict non-local vehicular traffic; offer incentives for housing rehabilitation; support small-scale craft and commercial activities compatible with residential use |
5.1 Planning response for Al-Huwaish neighborhood
Al-Huwaish represents the highest urban activity zone in the study area, due to the high concentration of commercial and service activities and the heavy pedestrian traffic. However, this high activity coincides with very high congestion and functional pressure on the alley network. Therefore, the priority is not to add new activities, but rather to manage existing activity and redistribute some of the pressure.
The proposed interventions include organizing entry and exit routes during peak hours, ensuring the continuity of emergency passages, setting loading and unloading times for goods, and regulating street vendors and informal commercial extensions. Some visitor-related services should also be directed to Al-Buraq and Al-Mashraq, thus reducing concentration around the religious center while maintaining the continuity of economic activity.
5.2 Planning response for Al-Buraq neighborhood
Al-Buraq exhibits a high level of activity resulting from the relative balance between residential and commercial uses. Therefore, the priority is to maintain functional diversity and prevent commercial activity from dominating the residential structure.
Small economic activities that serve both residents and visitors should be supported, and small public spaces and pathways connecting the neighborhood to the shrine and markets should be improved. Regulations should be established for changes in the use of residential buildings, and the rehabilitation of heritage buildings for uses compatible with their architectural value and urban scale should be encouraged.
5.3 Planning response for Al-Mashraq neighborhood
Al-Mashraq represents a transitional zone between the historical fabric and the surrounding urban extensions, and it recorded a moderate level of vitality. The main problem lies not in a lack of activity, but rather in a relative weakness in the continuity of spatial and functional connectivity.
Therefore, interventions focus on rehabilitating the entrances to the neighborhood, improving the visibility of pedestrian paths, providing a spatial guidance system, and addressing the disconnections between surrounding streets and historical alleyways. Local services and limited mixed-use developments can be supported without transforming the neighborhood into a dense commercial extension of the areas surrounding the shrine.
5.4 Planning response for Al-Amara neighborhood
Al-Amara recorded the lowest relative value on the index. However, this result is related to its traditional residential character and low density of commercial activity, and does not indicate poor overall urban performance. Therefore, the goal should not be solely to increase the index value through increased commerce, as this could alter the neighborhood's identity and displace its residents.
The priority should be protecting residential use, rehabilitating heritage buildings, improving daily services, and maintaining alleyways and infrastructure. Craft activities and small services that are compatible with the residential environment can be encouraged, along with regulations to prevent the excessive conversion of residential areas into hotels, warehouses, or intensive commercial uses.
5.5 Implementation and follow-up priorities
Planning responses can be implemented in three interconnected phases:
Immediate Phase: Organizing pedestrian traffic, protecting emergency corridors, and regulating commercial activity in Al-Huwaish and Al-Buraq.
Intermediate Phase: Rehabilitating spaces, pathways, and entrances in Al-Mashraq, and improving services and infrastructure in architecture.
Long-Term Phase: Adopting an integrated conservation and management plan for the historic center, including regulations for land-use changes, building restoration programs, and a periodic system for monitoring urban vitality.
It is suggested that the urban vitality index be recalculated periodically after the implementation of interventions, and that a high index value alone should not be considered a sign of success. In Al-Huwaish, a decrease in congestion while maintaining activity may be a positive outcome, whereas in Al-Amara, success lies in preserving the population and residential buildings and improving services, even if the intensity of commercial activity remains limited.
The proposed responses confirm that managing urban vitality in the historic center of Najaf does not require maximizing activity in all neighborhoods, but rather achieving a balance between economic activity, traffic flow, residential function, and heritage preservation. Priorities vary from managing congestion in Al-Huwaish to protecting functional diversity in Al-Buraq, improving connectivity in Al-Mashraq, and preserving the residential character of Al-Amara. Thus, the results of the Urban Vitality Index transform from a descriptive comparative tool into a practical basis for guiding planning decisions and identifying interventions according to the needs of each neighborhood.
The study's findings are limited to the spatial, functional, and movement-related dimensionsthat could be measured through land use analysis, the morphological characteristics of the urban fabric, pedestrian and vehicular traffic monitoring, and assessments of accessibility and the efficiency of public spaces. The study did not include measurements of urban climate or thermal comfort, nor did it conduct a comprehensive social survey of residents and visitors or a behavioral analysis of interaction patterns and time spent in public spaces. Therefore, the index results should not be interpreted as a comprehensive assessment of the social or environmental performance of the four quarters. Future studies could integrate climate measurements, questionnaires, interviews, and behavioral observation to develop a more comprehensive assessment of the environmental and social dimensions of urban vitality.
The study demonstrated that the historic center of Najaf Al-Ashraf retains distinct morphological characteristics of traditional urban fabric, specifically high building coverage ratios, closely spaced building masses, and a narrow network of alleyways. Building coverage ranged from 68% to 82%, while the average width of alleyways varied between 2.5 and 4 meters. These results reflect varying degrees of urban compactness across the four neighborhoods, although the study data did not allow for the determination of the direct climatic or social impacts of these characteristics.
Land-use analysis revealed functional and spatial variations within the historic center. Commercial and service activities were more prevalent in Al-Huwaish and Al-Buraq, whereas a residential character was more pronounced in Al-Amara and Al-Mashraq. High-intensity activities were concentrated in neighborhoods closest to the Holy Shrine and major movement axes, suggesting a spatial link between proximity to the religious core and the distribution of urban activities, without establishing a direct causal relationship.
Movement data indicated that the historic center relies heavily on pedestrian traffic, which accounted for 80% to 92% of all movement. Al-Huwaish and Al-Buraq recorded the highest rates of pedestrian movement, coinciding with elevated commercial and service activity; however, the high vitality in Al-Huwaish was also associated with extreme congestion, illustrating that high vitality can coincide with mobility and functional pressures on the historic urban fabric.
The composite urban vitality index showed clear variation among the neighborhoods: Al-Huwaish recorded the highest value at 88.00, followed by Al-Buraq (74.85), Al-Mashraq (61.55), and Al-Amara (52.25). These values serve as a tool for the relative comparison of the study units, rather than a comprehensive assessment of the quality of urban performance in each neighborhood. The results indicate a need for differentiated planning interventions: managing congestion in Al-Huwaish, preserving functional diversity in Al-Buraq, improving spatial connectivity in Al-Mashraq, and protecting the residential and heritage character of Al-Amara.
Appendix A. Criterion-based assessment matrix
A.1 Purpose and scoring procedure
This appendix documents the criterion-based assessment procedure used to derive the five urban vitality indicator scores for the four historic quarters of Najaf: Al-Huwaish, Al-Buraq, Al-Mashraq, and Al-Amara. Raw percentages, field counts, GIS measurements, route analyses, and structured observation records were treated as evidence inputs. They were not directly transformed through min-max normalization. Instead, each urban vitality indicator was divided into five operational subcriteria and assessed on a six-point ordinal rating scale ranging from 0 to 5.
The criterion-based score for each indicator was calculated using Eq. (A1):
Sij = 20Σk=15wjk rijk (A1)
Sij: the criterion-based score of indicator j for quarter i, ranging from 0 to 100;
rijk: the rating assigned to quarter i for subcriterion k of indicator j, ranging from 0 to 5;
wjk: the relative weight assigned to subcriterion k within indicator j; and
Σwjk = 1.00: the sum of the subcriterion weights within each indicator.
The multiplication factor of 20 converts the weighted rating, which ranges from 0 to 5, into an indicator score ranging from 0 to 100. The resulting score expresses the degree to which a quarter satisfies the defined spatial, functional, and movement-related criteria for that indicator.
Ratings were assigned by cross-referencing field observations, movement counts, land-use data, field photographs, observation checklists, and GIS-based spatial analysis. The ratings should be interpreted as structured case-specific assessments rather than universal benchmarks.
The general interpretation of the six-point rating scale is presented in Table A1.
Table A1. General interpretation of subcriterion ratings
|
Rating |
Assessment Level |
General Interpretation |
|
0 |
Absent |
The assessed characteristic was not observed or was functionally absent. |
|
1 |
Very Low |
The characteristic was present only to a very limited extent. |
|
2 |
Low |
The characteristic was weak, discontinuous, or spatially limited. |
|
3 |
Moderate |
The characteristic was present at an intermediate and functional level. |
|
4 |
High |
The characteristic was clearly present and spatially or functionally effective. |
|
5 |
Very High |
The characteristic was dominant, continuous, highly accessible, or strongly represented. |
A.2 Operational subcriteria and weights
The operational subcriteria, their relative weights, and the primary evidence sources used for each urban vitality indicator are summarized in Table A2.
Table A2. Subcriteria, relative weights, and primary evidence sources
|
Indicator |
Code |
Operational Subcriterion |
Weight |
Primary Evidence Source |
|
Commercial and service activity |
C1 |
Proportion of commercial and service uses |
0.30 |
Land-use survey and GIS land-use map |
|
Commercial and service activity |
C2 |
Density of active commercial and service units |
0.25 |
Field inventory of active units |
|
Commercial and service activity |
C3 |
Continuity of active commercial frontages |
0.20 |
Street-frontage observation and photographic documentation |
|
Commercial and service activity |
C4 |
Temporal continuity of commercial activity |
0.15 |
Morning, midday, and evening field observations |
|
Commercial and service activity |
C5 |
Connection of activities to major movement routes |
0.10 |
GIS route analysis and field verification |
|
Pedestrian movement |
P1 |
Average pedestrian count at observation points |
0.30 |
Pedestrian counts at the sixteen observation points |
|
Pedestrian movement |
P2 |
Pedestrian share of total recorded movement |
0.25 |
Pedestrian and vehicular movement counts |
|
Pedestrian movement |
P3 |
Temporal continuity of pedestrian flow |
0.20 |
Observations during the three daily time periods |
|
Pedestrian movement |
P4 |
Level of pedestrian path occupancy |
0.15 |
Field observation of path use and congestion |
|
Pedestrian movement |
P5 |
Connectivity of pedestrian routes |
0.10 |
GIS movement-network analysis and field verification |
|
Land use diversity |
L1 |
Proportional balance among land-use categories |
0.30 |
Calculated land-use proportions |
|
Land use diversity |
L2 |
Presence of mixed-use buildings and frontages |
0.25 |
Field land-use inventory |
|
Land use diversity |
L3 |
Number of represented land-use categories |
0.20 |
GIS land-use classification |
|
Land use diversity |
L4 |
Spatial intermixing of different functions |
0.15 |
GIS spatial overlay and field observation |
|
Land use diversity |
L5 |
Functional complementarity among uses |
0.10 |
Analysis of relationships among residential, commercial, religious, and service uses |
|
Public space efficiency |
S1 |
Physical condition of public spaces |
0.30 |
Structured field observation checklist |
|
Public space efficiency |
S2 |
Usability of public spaces |
0.25 |
Structured field observation checklist |
|
Public space efficiency |
S3 |
Availability of amenities and services |
0.20 |
Field inventory of amenities and supporting services |
|
Public space efficiency |
S4 |
Continuity of activities surrounding public spaces |
0.15 |
Activity observations during fieldwork |
|
Public space efficiency |
S5 |
Connectivity with surrounding pedestrian routes |
0.10 |
GIS and field connectivity analysis |
|
Accessibility |
A1 |
Connectivity of the street and alley network |
0.30 |
GIS network analysis |
|
Accessibility |
A2 |
Proximity to major movement routes |
0.25 |
GIS distance analysis |
|
Accessibility |
A3 |
Proximity to the Holy Shrine and essential services |
0.20 |
GIS proximity analysis and field verification |
|
Accessibility |
A4 |
Continuity and directness of access routes |
0.15 |
Route tracing and field observation |
|
Accessibility |
A5 |
Legibility of entrances and movement directions |
0.10 |
Entrance and wayfinding observations |
Methodological note on subcriterion weights
The subcriterion weights were ordered according to their operational importance within each indicator. The primary criterion most directly associated with the indicator was assigned a weight of 0.30; the second quantitative or functional criterion, 0.25; the third criterion, 0.20; the continuity or distribution criterion, 0.15; and the complementary criterion, 0.10. These are study-specific operational weights developed for the present comparative assessment. They are not proposed as universal weights and should not be generalized to other historic centers without contextual validation, expert review, or sensitivity testing.
A.3 Detailed ratings of the four historic quarters
The detailed criterion-based ratings assigned to the four historic quarters for each operational subcriterion are presented in Table A3.
Table A3. Criterion-based ratings assigned to the four historic quarters
|
Indicator |
Code |
Subcriterion Weight |
Al-Huwaish |
Al-Buraq |
Al-Mashraq |
Al-Amara |
|
Commercial and service activity |
C1 |
0.30 |
5 |
4 |
3 |
2 |
|
C2 |
0.25 |
5 |
4 |
3 |
2 |
|
|
C3 |
0.20 |
5 |
4 |
3 |
2 |
|
|
C4 |
0.15 |
4 |
3 |
3 |
2 |
|
|
C5 |
0.10 |
4 |
3 |
3 |
2 |
|
|
Pedestrian movement |
P1 |
0.30 |
5 |
4 |
2 |
2 |
|
P2 |
0.25 |
5 |
4 |
4 |
4 |
|
|
P3 |
0.20 |
5 |
4 |
2 |
2 |
|
|
P4 |
0.15 |
3 |
4 |
3 |
2 |
|
|
P5 |
0.10 |
3 |
3 |
3 |
2 |
|
|
Land use diversity |
L1 |
0.30 |
4 |
5 |
3 |
3 |
|
L2 |
0.25 |
5 |
3 |
3 |
3 |
|
|
L3 |
0.20 |
4 |
3 |
3 |
3 |
|
|
L4 |
0.15 |
4 |
3 |
4 |
2 |
|
|
L5 |
0.10 |
4 |
3 |
4 |
2 |
|
|
Public space efficiency |
S1 |
0.30 |
3 |
4 |
3 |
3 |
|
S2 |
0.25 |
4 |
3 |
3 |
3 |
|
|
S3 |
0.20 |
3 |
3 |
3 |
3 |
|
|
S4 |
0.15 |
4 |
3 |
3 |
3 |
|
|
S5 |
0.10 |
4 |
4 |
4 |
3 |
|
|
Accessibility |
A1 |
0.30 |
5 |
4 |
4 |
3 |
|
A2 |
0.25 |
5 |
4 |
4 |
3 |
|
|
A3 |
0.20 |
5 |
4 |
4 |
3 |
|
|
A4 |
0.15 |
4 |
4 |
2 |
4 |
|
|
A5 |
0.10 |
4 |
4 |
2 |
4 |
A.4 Verification of the indicator scores
Because the same subcriterion weights were applied within each indicator, the operational calculation can be written as:
S = 20[(0.30r1) + (0.25r2) + (0.20r3) + (0.15r4) + (0.10r5)]
Example 1: Commercial and Service Activity in Al-Huwaish
CAl-Huwaish = 20[(0.30 × 5) + (0.25 × 5) + (0.20 × 5) + (0.15 × 4) + (0.10 × 4)]
= 20[1.50 + 1.25 + 1.00 + 0.60 + 0.40]
= 20(4.75)
= 95
Example 2: Pedestrian Movement in Al-Buraq
PAl-Buraq = 20[(0.30 × 4) + (0.25 × 4) + (0.20 × 4) + (0.15 × 4) + (0.10 × 3)]
= 20[1.20 + 1.00 + 0.80 + 0.60 + 0.30]
= 20(3.90)
= 78
The resulting weighted ratings and converted indicator scores for all four quarters are summarized in Table A4.
Table A4. Verification of the criterion-based indicator scores
|
Indicator |
Quarter |
Weighted Rating Before Conversion |
Final Score |
|
Commercial and service activity |
Al-Huwaish |
4.75 |
95 |
|
Al-Buraq |
3.75 |
75 |
|
|
Al-Mashraq |
3.00 |
60 |
|
|
Al-Amara |
2.00 |
40 |
|
|
Pedestrian movement |
Al-Huwaish |
4.50 |
90 |
|
Al-Buraq |
3.90 |
78 |
|
|
Al-Mashraq |
2.75 |
55 |
|
|
Al-Amara |
2.50 |
50 |
|
|
Land use diversity |
Al-Huwaish |
4.25 |
85 |
|
Al-Buraq |
3.60 |
72 |
|
|
Al-Mashraq |
3.25 |
65 |
|
|
Al-Amara |
2.75 |
55 |
|
|
Public space efficiency |
Al-Huwaish |
3.50 |
70 |
|
Al-Buraq |
3.40 |
68 |
|
|
Al-Mashraq |
3.10 |
62 |
|
|
Al-Amara |
3.00 |
60 |
|
|
Accessibility |
Al-Huwaish |
4.75 |
95 |
|
Al-Buraq |
4.00 |
80 |
|
|
Al-Mashraq |
3.50 |
70 |
|
|
Al-Amara |
3.25 |
65 |
A.5 Verification of the composite urban vitality index
The five criterion-based indicator scores were combined using the relative weights adopted in the main methodology:
CUVIi = 0.25Ci + 0.25Pi + 0.20Li + 0.15Si + 0.15Ai (A2)
Example: CUVI Calculation for Al-Huwaish
CUVIAl-Huwaish = (95 × 0.25) + (90 × 0.25) + (85 × 0.20) + (70 × 0.15) + (95 × 0.15)
= 23.75 + 22.50 + 17.00 + 10.50 + 14.25
= 88.00
The weighted contributions of the five indicators and the resulting Composite Urban Vitality Index (CUVI) values for the four quarters are presented in Table A5.
Table A5. Weighted contributions and final CUVI values
|
Quarter |
Commercial Activity × 0.25 |
Pedestrian Movement × 0.25 |
Land Use Diversity × 0.20 |
Public Space Efficiency × 0.15 |
Accessibility × 0.15 |
CUVI |
|
Al-Huwaish |
23.75 |
22.50 |
17.00 |
10.50 |
14.25 |
88.00 |
|
Al-Buraq |
18.75 |
19.50 |
14.40 |
10.20 |
12.00 |
74.85 |
|
Al-Mashraq |
15.00 |
13.75 |
13.00 |
9.30 |
10.50 |
61.55 |
|
Al-Amara |
10.00 |
12.50 |
11.00 |
9.00 |
9.75 |
52.25 |
A.6 Interpretation and reporting safeguards
The assessment matrix demonstrates the complete calculation pathway from the subcriterion ratings to the five indicator scores and the final Composite Urban Vitality Index. The criterion-based scores should be interpreted as structured comparative assessments derived from multiple field and spatial evidence sources. They are not direct mathematical conversions of individual land-use percentages or pedestrian movement shares and do not constitute comprehensive evaluations of the social or environmental quality of the four quarters.
For reproducibility, the research archive should retain the original observation forms, movement-count sheets, land-use records, GIS outputs, photographic evidence, and the completed rating matrix used to assign each 0–5 score. The composite values should be reported as case-specific analytical results and not as universal urban-quality scores.
[1] Bandarin, F., van Oers, R. (2012). The Historic Urban Landscape: Managing Heritage in an Urban Century. John Wiley & Sons. https://doi.org/10.1002/9781119968115
[2] Lynch, K. (2013). “The image of the environment” and “the city image and its elements”: From the image of the city (1960). In The Urban Design Reader, pp. 125-138. https://doi.org/10.4324/9780203094235-16
[3] Relph, E. (1976). Place and Placelessness. Pion, London.
[4] Bianca, S. (2000). Urban Form in the Arab World: Past and Present. VDF Hochschulverlag AG. https://www.archnet.org/publications/10765.
[5] Gehl, J., Svarre, B. (2013). How to Study Public Life. Island Press, Washington. https://doi.org/10.5822/978-1-61091-525-0
[6] Jacobs, J. (1961). The Death and Life of Great American Cities. Random House, New York City.
[7] Montgomery, J. (1998). Making a city: Urbanity, vitality and urban design. Journal of Urban Design, 3(1): 93-116. https://doi.org/10.1080/13574809808724418
[8] Gehl, J. (2013). Cities for People. Island Press. https://www.jstor.org/stable/jj.41003893
[9] UNESCO. (2011). Recommendation on the historic urban landscape. https://whc.unesco.org/en/hul/.
[10] Hakim, B.S. (2013). Arabic Islamic Cities Rev: Building and Planning Principles. Routledge. https://doi.org/10.4324/9780203037874
[11] Carmona, M. (2021). Public Places Urban Spaces: The Dimensions of Urban Design. Routledge. https://doi.org/10.4324/9781315158457
[12] Hall, P. (2014). Cities of Tomorrow: An Intellectual History of Urban Planning and Design since 1880. Wiley-Blackwell.
[13] Ashworth, G.J., Tunbridge, J.E. (1990). The Tourist-Historic City. Routledge. https://doi.org/10.4324/9780080519470
[14] AlSayyad, N. (1991). Cities and Caliphs: On the Genesis of Arab Muslim Urbanism. Greenwood Press.
[15] de Waal, M.S., Rosetti, I., de Groot, M., Jinadasa, U. (Eds.) (2022). Living (World) Heritage Cities: Opportunities, Challenges, and Future Perspectives of People-Centered Approaches in Dynamic Historic Urban Landscapes. Sidestone Press.
[16] Chokur, M.F.S., Al-Khafaji, S.J. (2022). Urban and culture management in eventful cities: Najaf as a case study. International Journal of Health Sciences, 6(S5): 9335-9354. https://doi.org/10.53730/ijhs.v6nS5.11943
[17] Chatelard, G. (2017). Ashura rituals in Najaf: The renewal of expressive modes in a changing urban and social landscape. In Géraldine Chatelar. https://shs.hal.science/halshs-01963901v1.
[18] Sandes, C.A., Attiyah, A.N. (2022). Najaf, Iraq: Developing a sustainable approach to threatened heritage. In Routledge Handbook of Sustainable Heritage, pp. 213-225. https://doi.org/10.4324/9781003038955-19
[19] Abraham, G. (2004). Preserving Najaf’s Heritage. WIT Press.
[20] Mohammed, M., Hadi, E. (2011). The best way to deal with the centre of Najaf old town. Journal of Planner and Development, 23: 19-39. https://jpd.uobaghdad.edu.iq/index.php/jpd/article/view/158.
[21] Alqalami, T. (2024). Environmental and cultural adaptation in desert architecture: Comparative insights into the traditional built forms of Najaf and Al-Ahsa. SSRN. https://doi.org/10.2139/ssrn.5077648
[22] Al-Ansari, R.M. (2013). Najaf: Past and Present. Al-Mamoon House for Translation and Publishing, Baghdad.
[23] Al-Hinkawi, W.S., Al-Saadawi, B. (2019). Restoring the local heritage and its role in sustainable spatial development the great market in Al-Najaf—A case study. Engineering and Technology Journal, 37(1C): 49-58. http://doi.org/10.30684/etj.37.1C.8
[24] Mervin, S., Tabbaa, Y., Bonnier, E. (2014). Najaf, the Gate of Wisdom. History, Heritage and Significance of the Holy City of the Shi‘a. Unesco Publishing.
[25] Jasim, I.A., Hasan, H.M., Farhan, S.L., Bahat, K.H. (2021). Evaluating the urban structure of Al-Kut city according to sustainability. IOP Conference Series: Earth and Environmental Science, 779(1): 012021. https://doi.org/10.1088/1755-1315/779/1/012021
[26] Falah, S.M. (2018). The shrine that consumed its town: The role of religion and politics in reshaping the Iraqi city of Najaf. Doctoral dissertation, University of Cincinnati. https://www.researchgate.net/publication/331983137_Title_The_Shrine_that_Consumed_Its_Town_The_Role_of_Religion_and_Politics_in_Reshaping_the_Iraqi_City_of_Najaf.
[27] Pendlebury, J. (2008). Conservation in the Age of Consensus. Routledge. https://doi.org/10.4324/9780203892343
[28] Alexander, C., Ishikawa, S., Silverstein, M., Jacobson, M., Fiksdahl-King, I., Angel, S. (1977). A Pattern Language: Towns, Buildings, Construction. Oxford University Press.
[29] Whyte, W.H. (1980). The Social Life of Small Urban Spaces. Conservation Foundation, Washington.
[30] Pafka, E. (2023). Modelling, mapping and measuring urban densities. In The Routledge Handbook of Urban Design Research Methods, pp. 460-469. https://doi.org/10.4324/9781003168621-51
[31] Almusawi, A., Kheyroddin, R., Alalhesabi, M. (2025). The impact of the mega-event on urban morphology: Arbaeen event in Al-Najaf as a case study. Frontiers of Architectural Research, 14(2): 381-401. https://doi.org/10.1016/j.foar.2024.08.006
[32] Farhan, S.L., Merie, U.A.A.K., Alobaydi, D. (2023). Challenges and opportunities of the urban structures of holy cities: The case of old Najaf, Iraq. IOP Conference Series: Earth and Environmental Science, 1129(1): 012034. https://doi.org/10.1088/1755-1315/1129/1/012034
[33] Farhan, S.L. (2026). Eid Al-Ghadir and the reshaping of the urban fabric in Najaf: A morphological-social analysis of the sustainability of spatial identity in religious cities. International Planning Studies, 31(3): 417-439. https://doi.org/10.1080/13563475.2026.2637946
[34] Farhan, S.L., Attia, H.N., Rahim, L.A.L., Alobaydi, D. (2025). The role of temporary architecture in preserving intangible heritage during the Arbaeen pilgrimage in holy Karbala: A case study. Buildings, 15(11): 1787. https://doi.org/10.3390/buildings15111787
[35] Farhan, S.L., Hasan, S.A., Rahim, L.A.L., et al. (2025). Balancing heritage preservation and sustainable development in historic cities: A case study of Old Najaf in the context of global best practices. International Journal of Sustainable Development and Planning, 20(3): 1041-1051. https://doi.org/10.18280/ijsdp.200311
[36] Abid, S. (2016). An examination of heritage protection and conservation practices in the pilgrimage city of Najaf. Doctoral dissertation, University of Sheffield. https://etheses.whiterose.ac.uk/id/eprint/17278/.
[37] Al-Shammari, R. (2024). Historical centers: An exploratory comparison of sustainable applications in urban renewal projects–Najaf and Karbala, Iraq. Wasit Journal of Engineering Sciences, 12(3): 55-69. https://doi.org/10.31185/ejuow.Vol12.Iss3.543