Hariyono Seputro Youngky Pratama* | Antariksa | Anthon Efani | Wisnumurti
© 2026 The authors. This article is published by IIETA and is licensed under the CC BY 4.0 license (http://creativecommons.org/licenses/by/4.0/).
OPEN ACCESS
This study develops and pilot-tests a quadrant-based performance framework that extends existing waste management evaluation approaches by integrating four critical dimensions workforce (IW), materials (IM), methods (MT), and management (MN) with dual-axis importance-performance analysis (IPA). Applied to 30 respondents from three construction contractors in Greater Malang, East Java, Indonesia, the framework demonstrates preliminary diagnostic utility by simultaneously assessing perceived importance and actual implementation performance across 19 indicators. Results reveal that 10 indicators (53%) are positioned in Quadrant I, indicating high importance but low performance, requiring prioritized improvement. These include organizational structure for waste management (IW3), waste prevention by workers (IW6), prevention of material over-ordering (IM3), use of recycled materials (IM2), waste separation at source (MT1), construction design optimization (MT3), waste storage design (MT5), and regulatory compliance indicators (MN1–MN3). Cross-dimensional analysis reveals an observed pattern within this sample: underperforming indicators consistently involve upstream planning and governance mechanisms, while well-performing indicators involve operational execution. Sensitivity analysis across three baseline methods confirms classification robustness for all priority indicators. As this is a small-scale pilot study applied to three contractors in one metropolitan region, findings are not generalizable beyond this specific sample without further replication with larger and more diverse samples. The framework provides construction contractors and policymakers with a preliminary evidence-based diagnostic tool for strategic resource allocation in rapidly urbanizing regions.
quadrant-based framework, construction waste, performance assessment, waste management, sustainable construction
Construction is a significant contributor to global waste production, accounting for approximately 30% of total waste generation in developing countries. A substantial portion of this waste is currently disposed of in landfills, occupying volumes that clearly exceed those of domestic waste [1]. The construction industry stands as a primary source of Construction and Demolition Waste (C&DW), which has seen a marked increase in line with population growth and urbanization trends. C&DW comprises a combination of waste streams, including non-hazardous, hazardous, and inert materials. Assessing the waste management system is therefore critical to improving the overall performance of C&DW handling [2]. It has been reported that the construction industry generates approximately 450 to 500 million tons of C&DW annually, leading to increased resource consumption and a significant rise in waste generation [3].
The management of C&DW is a critical aspect of the construction industry [4], requiring serious attention to maintain environmental balance and promote sustainable development. Environmental performance (EP) is one of the key approaches used to assess the extent to which C&DW management practices are effectively implemented by construction contractors [5]. EP in practice provides both a scientific foundation and guidance for formulating environmental protection policies [6]. Contemporary approaches to C&DW management increasingly emphasize the integration of circular economy principles, waste hierarchy frameworks (reduce, reuse, recycle), and lifecycle thinking to optimize material recovery and minimize environmental impacts [7, 8].
Various studies have addressed C&DW Management in an effort to enhance the commitment of the construction industry [9-11]. Previous research has identified stakeholder awareness as a critical factor influencing C&DW management effectiveness [10, 11]. The life cycle assessment (LCA) approach has been adopted to evaluate the environmental impacts of different waste management strategies in buildings and to analyze the impact of global warming on urban waste management strategies [12, 13]. A system dynamics perspective has been employed to explore the interactions among variables affecting the EP of C&DW [14]. More recent developments include the integration of advanced technologies such as Building Information Modeling (BIM), Internet of Things (IoT), and machine learning for real-time waste monitoring, anomaly detection, and predictive analytics [15-17]. These studies underscore a range of methodological approaches and the ongoing challenges in understanding, assessing, and effectively implementing C&DW strategies.
Although previous studies have provided valuable insights into strategies and evaluations of C&DW management, several fundamental limitations remain [14, 18, 19]. Research indicates a lack of integration between evaluation model performance and practical field assessments, particularly in accommodating complex system dynamics [14, 18]. Some studies place greater emphasis on evaluating stakeholder awareness, yet fall short in exploring operational approaches within C&DW practices [19]. Furthermore, the LCA approaches strongly focus on environmental impacts but do not sufficiently address socio-economic factors [12, 13]. While recent frameworks have incorporated multi-criteria decision-making tools such as fuzzy logic, SWOT analysis, and structural equation modeling to address complexity [20-22], these approaches often lack visual diagnostic capabilities that enable practitioners to readily identify priority intervention areas and allocate limited resources strategically.
A critical gap persists in the availability of performance assessment frameworks that simultaneously evaluate importance and actual implementation across multiple dimensions, while providing actionable prioritization guidance suitable for resource-constrained contexts. Most existing frameworks adopt either sequential assessment methods (evaluating importance and performance separately) or focus on isolated dimensions without cross-dimensional comparative analysis [23, 24]. This limitation is particularly problematic for small and medium-sized enterprise (SME) contractors in developing economies, who require practical diagnostic tools that clearly indicate where to invest limited resources for maximum EP improvement. The absence of integrated, visually intuitive frameworks that bridge academic rigor with practitioner usability represents a significant barrier to translating C&DW management research into practice [25, 26].
To address these limitations, this study develops a quadrant-based performance framework that enables simultaneous assessment of importance and actual performance across four critical dimensions: workforce (IW), materials (IM), methods (MT), and management (MN). Unlike linear or sequential evaluation models, the quadrant-based approach facilitates visual identification of priority areas (important but underperforming) versus efficiency maintenance areas (performing well but less critical), providing actionable insights for strategic resource allocation. This framework synthesizes principles from importance-performance analysis (IPA), circular economy thinking, and total quality management (TQM) into a cohesive diagnostic tool specifically calibrated for developing economy contexts where institutional capacity and financial resources are constrained. By integrating multiple dimensions within a single analytical framework and employing Cartesian quadrant visualization, the approach addresses the fragmentation evident in existing C&DW assessment methodologies [27-29].
Building on these foundations, particularly the Waste Management Performance Evaluation Tool (WMPET) and its Indonesian adaptation in Surakarta [30, 31], this study extends existing evaluation methodologies by integrating dual-axis IPA with visual quadrant-based prioritization. While WMPET established comprehensive indicator frameworks for C&DW assessment, its linear evaluation structure does not simultaneously visualize importance-performance gaps or provide explicit resource allocation guidance. The quadrant-based extension addresses these limitations while maintaining WMPET's validated indicator foundation, adapting it to Greater Malang's specific developmental context.
In Greater Malang, East Java Province, the construction industry demonstrates robust growth aligned with regional economic expansion. Official statistics indicate that Malang City's economy grew 5.92% in 2025, reaching Gross Regional Domestic Product (GRDP) of Rp 108.15 trillion, with the construction sector contributing 12.56% (approximately Rp 13.6 trillion) to total economic output [32]. This positions construction as the third-largest economic sector after trade (28.50%) and manufacturing (27.65%). Furthermore, Gross Fixed Capital Formation (GFCF), a key indicator of infrastructure investment, grew 7.23% in 2025, signaling continued construction activity expansion [32]. The Construction Cost Index (IKK) for Greater Malang showed a declining trend from 102.75 (2023) to 97.61 (2025) for Malang City, reflecting reduced cost pressures that may further stimulate construction demand [33]. However, this rapid growth intensifies environmental pressures, particularly regarding C&DW management. The substantial construction sector contribution to regional GDP (Rp 13.6 trillion annually) translates to significant material throughput and waste generation volumes, making effective C&DW management increasingly critical for sustainable urban development. Although regulations and guidelines governing C&DW management exist [34], the assessment of their implementation still presents distinct challenges. The management of C&DW in Greater Malang has thus emerged as an urgent policy priority requiring systematic assessment approaches capable of diagnosing performance gaps and guiding strategic interventions. This context provides an appropriate empirical setting for framework development and pilot application, as Greater Malang represents characteristics common to rapidly urbanizing cities in Southeast Asia and other developing regions: high construction activity driven by economic growth, emerging environmental awareness, transitional regulatory frameworks, and predominance of SME contractors with limited technical capacity.
Construction contractors play a critical role in implementing sustainable C&DW management practices. Therefore, evaluating their EP in C&DW practices becomes a relevant and necessary area of investigation. This study aims to achieve two primary objectives: (1) to develop and conduct a preliminary pilot application of a quadrant-based performance framework in Greater Malang contractors as an exploratory study, extending existing evaluation methodologies by integrating IW, IM, MT, and MN with dual-axis IPA for comprehensive C&DW management assessment; and (2) to apply this framework to identify observed performance patterns, priority intervention areas, and strategic recommendations for contractors in Greater Malang. It is explicitly acknowledged that this is a small-scale pilot study with 30 respondents from three companies, and findings should be interpreted as exploratory observations pertaining to this specific sample rather than as validated conclusions generalizable to the broader Indonesian construction industry. The findings are expected to contribute both methodologically through the introduction of an integrated, visually intuitive assessment framework building on established tools [30, 31] and practically by providing preliminary evidence-based guidance for contractors and policymakers in rapidly urbanizing developing economy contexts. Ultimately, this research supports the development of more effective policies aimed at maintaining a clean and healthy environment and promoting sustainable development practices in the construction sector. This pilot study provides a preliminary proof-of-concept; full framework verification would require expanded samples, cross-regional replication, structural validity testing, and longitudinal assessment directions identified as necessary for future research building on this initial application.
2.1 Research design and approach
This study adopts a descriptive analytical research design combining framework development with exploratory pilot application. The descriptive component illustrates the current state of EP assessment in C&DW among construction contractors in Greater Malang, while the analytical component employs the quadrant-based framework to identify observed performance patterns, gaps, and prioritization strategies within this specific sample. This dual approach enables both diagnostic assessment and strategic recommendation formulation, addressing the practitioner-oriented objectives emphasized in recent C&DW literature [17, 18, 35].
The quantitative methodology was selected for its capacity to systematically measure, compare, and visualize performance across multiple dimensions and multiple contractors, thereby enabling pattern identification within the study context. This approach aligns with contemporary trends in C&DW management research that emphasize data-driven decision-making and evidence-based policy formulation [16, 22].
2.2 The quadrant-based performance framework: An integrated extension of Waste Management Performance Evaluation Tool
The framework developed in this study represents an integrative extension of the WMPET [30], incorporating dual-axis IPA and Cartesian quadrant visualization to enhance diagnostic capability and strategic guidance. While maintaining WMPET's validated four-dimensional structure and indicator foundation, adapted to Indonesian contexts [31], this framework introduces three methodological enhancements: (1) simultaneous importance-performance measurement enabling gap identification, (2) visual quadrant classification providing intuitive strategic interpretation, and (3) cross-dimensional comparative analysis revealing observable patterns. This extension addresses practitioner needs for actionable prioritization tools while building on established theoretical and empirical foundations. It is explicitly noted that the four-dimensional structure (IW, IM, MT, and MN) and the 19-indicator assignment are adopted from WMPET [30] and its Indonesian adaptation [31] and are not independently validated in the Greater Malang context through Exploratory Factor Analysis (EFA), Confirmatory Factor Analysis (CFA), or expert Delphi procedures. The dimensional structure is therefore assumed based on prior literature rather than empirically verified for this study's specific setting.
2.2.1 Four-dimensional structure
The framework evaluates C&DW performance across four interconnected dimensions, each addressing distinct yet complementary aspects of waste management implementation. These dimensions were adopted from the validated WMPET framework [30] and its Indonesian adaptation [31], with indicator wording adjusted for the Greater Malang context through expert consultation. The assignment of indicators to dimensions follows the original WMPET classification and has not been independently tested through factor analysis in the current study.
IW: This dimension encompasses human capital elements including contractor commitment to waste management, availability of specialized waste management personnel, organizational structure supporting environmental initiatives, technical competency in waste handling, knowledge about regulatory frameworks, and worker awareness regarding waste prevention practices. The IW recognizes that effective C&DW management fundamentally depends on human capabilities and institutional support systems that enable consistent implementation of environmental practices [36].
IM: This dimension addresses material selection, procurement planning, and material lifecycle management throughout construction processes. Key aspects include commitment to using recycled or reclaimed materials, prevention of material over-ordering through accurate quantity planning, systematic rework reduction to minimize waste from construction errors, and efficient material storage preventing damage-induced waste. The IM reflects circular economy principles emphasizing resource optimization and waste hierarchy implementation [37].
MT: This dimension evaluates operational procedures and technical approaches for waste minimization. Elements include waste separation practices at source, strategic planning for waste storage infrastructure from early project stages, systematic construction design optimization to reduce waste generation, timely reminders and monitoring of worker waste prevention behaviors, and regular evaluation of waste management performance. The MT emphasizes lean construction principles and systematic process management [38].
MN: This dimension encompasses governance structures, regulatory compliance, and administrative systems. Critical components include existence and enforcement of waste management policies and standard operating procedures, integration of environmental clauses in construction contracts, systematic monitoring and reporting of waste management activities, and efficiency of waste collection and transportation logistics. The MN reflects TQM principles and institutional theory recognizing that formal governance frameworks shape organizational environmental behavior [39, 40].
These four dimensions were adopted from established literature [30, 31] and adapted to the developing economy context. As noted above, the dimensional classification was not independently validated in the Greater Malang context, and this represents a limitation of the current pilot study. Table 1 presents the theoretical foundations mapping each dimension to its primary theoretical basis and core mechanism.
Table 1. Theoretical foundations of framework dimensions
|
Dimension |
Primary Theoretical Basis |
Core Mechanism |
Supporting Literatures |
|
Workforce (IW) |
Human Capital Theory + Capability Approach |
Workforce competency and enabling institutional environments jointly determine environmental behavior outcomes. Individual skills require organizational support systems to translate into consistent waste prevention actions. |
[36, 39, 40] |
|
Material (IM) |
Circular Economy Principles + Resource-Based View |
Material optimization as strategic resource management. Shifting from linear "take-make-dispose" to circular "reduce-reuse-recycle" models requires both contractor practices and ecosystem infrastructure. |
[37, 38] |
|
Method (MT) |
Lean Construction + Waste Hierarchy Framework |
Operational efficiency through systematic waste minimization procedures. Upstream intervention (prevention and planning) more effective than downstream correction (disposal). |
[38] |
|
Management (MN) |
Total Quality Management (TQM) + Institutional Theory |
Environmental performance (EP) requires systematic governance frameworks (policies, contracts, procedures) rather than ad-hoc practices. Formal institutions shape organizational behavior. |
[39, 40] |
Unified Framework Logic: The quadrant-based framework integrates these theoretical perspectives through importance-performance gap analysis. Gaps between perceived importance (normative recognition, reflecting theory acceptance) and actual performance (practical implementation, reflecting resource and capacity constraints) reveal where theoretical principles may not be translating into practice within the observed sample the critical bottleneck for environmental improvement in resource-constrained contexts.
2.2.2 Two-axis evaluation system
The framework employs a dual-axis measurement approach distinguishing between perceived importance and actual implementation performance for each indicator. This differentiation addresses a fundamental limitation in existing C&DW assessment tools that typically measure only one dimension (usually performance alone), thereby failing to identify priority gaps where high importance does not translate into proportionate implementation [18, 23].
The Importance Axis (X-axis) measures stakeholder perceptions regarding the significance of each indicator for effective C&DW management. Respondents rate importance on a five-point Likert scale ranging from 1 (not important at all) to 5 (extremely important). This measurement captures normative recognition and theoretical acceptance of C&DW management principles, reflecting what contractors believe should be prioritized based on their understanding of environmental requirements, regulatory expectations, and industry best practices.
The Performance Axis (Y-axis) measures actual implementation levels for each indicator in current contractor operations. Respondents rate performance on a five-point Likert scale ranging from 1 (not implemented at all) to 5 (fully implemented). This measurement captures practical reality and resource-constrained implementation, reflecting what contractors actually do given their financial capacity, technical capabilities, institutional support, and operational constraints.
The simultaneous measurement of both dimensions enables gap analysis identifying discrepancies between what contractors recognize as important and what they successfully implement. This gap-focused approach provides more actionable insights than single-dimension assessment by explicitly highlighting where capacity building, resource allocation, or institutional support is most urgently needed [41, 42].
2.2.3 Quadrant classification system
The framework employs Cartesian diagram analysis to classify indicators into four strategic quadrants based on their positioning relative to mean importance and mean performance scores across all respondents. The quadrant boundaries are established using grand mean values: the X-axis threshold represents the average importance score across all indicators, and the Y-axis threshold represents the average performance score across all indicators. This approach ensures that quadrant classification reflects relative positioning within the study sample, identifying which indicators are above or below average on each dimension.
Quadrant I (Concentrate Here): High importance, low performance. Indicators in this quadrant represent priority intervention areas requiring immediate attention and resource allocation. These indicators are widely recognized as important for effective C&DW management but suffer from significant implementation gaps, indicating barriers related to capacity, resources, or institutional support. Strategic response: Prioritize investments in capacity building, provide targeted technical assistance, strengthen institutional frameworks, and allocate resources to close implementation gaps.
Quadrant II (Keep Up the Good Work): High importance, high performance. Indicators in this quadrant represent strengths where contractors demonstrate both recognition of importance and successful implementation. These areas should be maintained and potentially leveraged as models for addressing Quadrant I deficiencies. Strategic response: Maintain current performance levels, document best practices for knowledge transfer, and ensure continued resource allocation to sustain these achievements.
Quadrant III (Low Priority): Low importance, low performance. Indicators in this quadrant are perceived as less critical and are not extensively implemented. These areas require monitoring but do not demand immediate intervention unless reassessment reveals their importance has been underestimated. Strategic response: Monitor for changing conditions, educate stakeholders if importance has been undervalued, and defer major investments until higher-priority areas are addressed.
Quadrant IV (Possible Overkill): Low importance, high performance. Indicators in this quadrant may represent areas where implementation exceeds perceived importance, potentially indicating resource misallocation or unrecognized value. These areas warrant investigation to determine whether importance has been underestimated or whether resources could be reallocated to higher-priority quadrants. Strategic response: Investigate reasons for high implementation despite low perceived importance, assess whether importance perceptions require updating, and consider resource reallocation to Quadrant I priorities if confirmed as less critical.
This quadrant-based classification provides visual, intuitive strategic guidance enabling contractors and policymakers to rapidly identify where interventions are most needed and how to allocate limited resources for maximum EP improvement [41, 42].
2.3 Population and sampling strategy
The research population consists of construction contractor companies operating in Greater Malang area, defined as the metropolitan region encompassing Malang City, Malang Regency, and Batu City. This geographic scope was selected based on its concentration of construction activity, economic significance within East Java Province, and representativeness of mid-tier Indonesian urban centers experiencing rapid infrastructure development.
Greater Malang's selection as the study site is empirically justified by its economic and construction activity profile. With construction contributing 12.56% to regional GDP (Rp 13.6 trillion in 2025) and GFCF growing 7.23% [32], the region exhibits construction intensity comparable to other rapidly urbanizing Indonesian cities. The declining Construction Cost Index (from 102.75 in 2023 to 97.61 in 2025) indicates improving cost competitiveness, likely stimulating further construction demand and consequently amplifying C&DW management challenges [33]. This economic context positions Greater Malang as a relevant empirical setting for this pilot study; however, it does not in itself justify generalization of findings beyond the specific contractors studied.
The sampling approach employed purposive sampling with specific inclusion criteria designed to ensure respondent relevance and data quality. Selection criteria included: (1) companies holding active construction business licenses (IUJK) from relevant municipal authorities, (2) involvement in building construction projects (residential, commercial, or public infrastructure), (3) project values exceeding IDR 500 million to ensure substantive C&DW generation, and (4) operational history of at least three years to ensure sufficient experience with C&DW management challenges and practices. These criteria enabled selection of contractors with adequate scale and experience to provide informed assessments of both importance and performance dimensions.
Based on these criteria, three construction companies were selected: CV. Azka Bangun Karya, CV. Dzakwan Ikhsan, and PT. Mulia Surya Mahameru. These companies represent diverse project portfolios including residential housing developments, commercial buildings, and public infrastructure, thereby capturing variation in C&DW management contexts and challenges across different construction typologies.
A total of 30 respondents from these companies participated in the study. Respondent selection within each company targeted individuals with direct involvement in or oversight of construction operations and waste management activities. Respondent categories included project managers (responsible for overall project execution and resource allocation), site supervisors (managing daily construction activities and worker coordination), environmental officers (where designated positions existed), and senior technical staff with substantial field experience. This multi-level sampling approach ensured representation of both managerial perspectives (importance perceptions informed by strategic considerations and regulatory awareness) and operational perspectives (performance assessments grounded in daily implementation realities).
The distribution of respondents across companies was: CV. Azka Bangun Karya (10 respondents), CV. Dzakwan Ikhsan (10 respondents), and PT. Mulia Surya Mahameru (10 respondents), ensuring balanced representation across the study sample. The sample size (n = 30) and geographic concentration (three companies in one metropolitan region) are appropriate for a small-scale pilot application of a newly developed framework, enabling in-depth diagnostic insights and methodological refinement [43]; however, they do not support statistical generalization to the broader Indonesian construction industry or to other regions. Findings should be interpreted as exploratory observations within this specific sample, and all recommendations are offered as preliminary insights requiring validation through expanded research.
The timing of data collection (August to October 2024) coincided with a period of sustained construction activity in Greater Malang. Official data indicates that the construction sector maintained stable contribution levels (12.56% of GDP in 2025, compared to estimated 11.8% in 2024) [32], suggesting that respondent experiences reflect typical operational conditions rather than anomalous peaks or troughs. This temporal representativeness strengthens the reliability of performance assessments captured in the framework.
2.4 Research instruments and variables
Data collection employed a structured questionnaire instrument designed to capture dual-axis measurements across the four-dimensional framework. The questionnaire comprised 19 indicator items distributed across the four dimensions: IW (6 indicators), IM (4 indicators), MT (5 indicators), and MN (4 indicators). Each indicator was presented as a paired question set measuring both importance and performance on five-point Likert scales (Table 2).
Table 2. Research variables and measurement indicators
|
Dimension |
Code |
Indicator |
Operational Definition |
Scale |
|
Workforce (IW) |
IW1 |
Contractor commitment to waste management |
Demonstrated organizational commitment through policy statements, resource allocation, and leadership support for waste management initiatives |
1-5 Likert |
|
IW2 |
Availability of waste management personnel |
Presence of dedicated personnel or designated responsibilities for waste management coordination and implementation |
1-5 Likert |
|
|
IW3 |
Organizational structure for waste management |
Formal organizational arrangements including designated roles, reporting lines, and accountability mechanisms for waste management |
1-5 Likert |
|
|
IW4 |
Technical competency in waste handling |
Worker and supervisor skills in proper waste segregation, handling, and storage techniques |
1-5 Likert |
|
|
IW5 |
Knowledge of waste management regulations |
Awareness and understanding of applicable laws, regulations, and permit requirements governing C&DW management |
1-5 Likert |
|
|
IW6 |
Worker awareness of waste prevention |
General workforce knowledge and attitudes regarding waste minimization, reuse opportunities, and environmental impacts |
1-5 Likert |
|
|
Material (IM) |
IM1 |
Commitment to using recycled materials |
Organizational policy and practice regarding procurement and utilization of recycled or reclaimed construction materials |
1-5 Likert |
|
IM2 |
Use of recycled/reclaimed materials |
Actual implementation frequency and proportion of recycled materials in construction projects |
1-5 Likert |
|
|
IM3 |
Prevention of material over-ordering |
Accuracy of material quantity planning and procurement processes to minimize excess materials becoming waste |
1-5 Likert |
|
|
IM4 |
Reduction of rework and errors |
Quality control measures and construction accuracy to minimize waste from defects, errors, and required rework |
1-5 Likert |
|
|
Method (MT) |
MT1 |
Waste separation at source |
Systematic segregation of waste streams (wood, metal, concrete, etc.) at point of generation during construction |
1-5 Likert |
|
MT2 |
Worker reminders for waste prevention |
Regular communication, signage, and supervision reinforcing waste minimization behaviors |
1-5 Likert |
|
|
MT3 |
Construction design optimization |
Design decisions explicitly considering waste minimization through material efficiency and constructability |
1-5 Likert |
|
|
MT4 |
Performance evaluation of waste management |
Systematic monitoring, measurement, and review of waste management outcomes and continuous improvement |
1-5 Likert |
|
|
MT5 |
Waste storage infrastructure planning |
Allocation of space and facilities for waste segregation, temporary storage, and collection from project planning stage |
1-5 Likert |
|
|
Management (MN) |
MN1 |
Waste management policies and SOPs |
Existence and enforcement of written policies, procedures, and standard operating procedures for waste management |
1-5 Likert |
|
MN2 |
Environmental clauses in contracts |
Integration of waste management requirements and responsibilities into construction contracts and subcontractor agreements |
1-5 Likert |
|
|
MN3 |
Monitoring and reporting systems |
Systematic documentation, reporting, and tracking of waste generation, segregation, and disposal activities |
1-5 Likert |
|
|
MN4 |
Waste collection efficiency |
Timeliness, frequency, and reliability of waste removal from construction sites to designated facilities |
1-5 Likert |
The questionnaire was developed through a multi-stage process: (1) initial indicator identification based on literature review of existing C&DW frameworks [30, 31], (2) adaptation to Indonesian construction context through expert consultation with academic researchers and experienced practitioners, (3) pilot testing with 5 construction professionals to assess clarity and comprehension, and (4) refinement of wording and formatting based on pilot feedback. This development process ensured content validity (indicators comprehensively represent C&DW management domains) and face validity (indicators are clearly understood by target respondents). Structural validity that is, whether the 19 indicators empirically cluster into the four proposed dimensions in this specific context was not assessed and remains a priority for future research.
2.5 Data collection procedures
Data collection followed a structured protocol designed to ensure response quality and ethical compliance. The procedure involved the following sequential steps:
Step 1: Formal authorization. Official permission was secured from each participating company through written communication explaining research objectives, anticipated time commitment, data confidentiality measures, and intended use of findings. Company management provided formal consent before any contact with individual respondents.
Step 2: Respondent briefing. Prior to questionnaire administration, respondents received a standardized briefing explaining the research purpose, the dual-axis measurement approach (importance vs. performance), definitions of key terms, and instructions for completing the Likert scale assessments. This briefing ensured shared understanding of what was being measured and how to interpret scale anchor points.
Step 3: Questionnaire administration. Questionnaires were administered through in-person individual sessions allowing respondents to seek clarification if needed while maintaining independent judgment. The researcher remained available to answer procedural questions but avoided influencing substantive responses. Completion time averaged 20 to 25 minutes per respondent.
Step 4: Immediate review. Upon questionnaire submission, the researcher conducted immediate review for completeness, checking that all items received responses and that response patterns appeared internally consistent (e.g., not all responses identical). If missing data or apparent confusion was identified, respondents were asked to review and clarify while still present.
Step 5: Data entry and verification. Responses were manually entered into spreadsheet format within 24 hours of collection. Data entry accuracy was verified through double-entry cross-checking, where 30% of questionnaires were re-entered independently and compared to identify transcription errors.
Data collection spanned three months (August to October 2024), allowing scheduling flexibility to accommodate respondent availability while maintaining temporal proximity to ensure consistency of contextual conditions across the sample. All respondents participated voluntarily and were assured of anonymity in data reporting and analysis. No individual-level data is presented in the results, only aggregated statistics.
2.6 Data analysis techniques
2.6.1 Descriptive statistical analysis
Descriptive statistics were calculated for both importance and performance measures across all 19 indicators. Analysis included measures of central tendency (mean scores), dispersion (standard deviations (SD)), and frequency distributions. Mean importance scores (X̄ᵢ) and mean performance scores (Ȳᵢ) were computed for each indicator based on responses from all 30 participants. These individual indicator means served as coordinate pairs for quadrant positioning in subsequent Cartesian analysis.
Additionally, grand mean values were calculated across all indicators to establish quadrant boundaries. The overall mean importance score (X̄) represents the average of all importance ratings across all indicators and all respondents, while the overall mean performance score (Ȳ) represents the average of all performance ratings across all indicators and all respondents. These grand means function as reference lines dividing the Cartesian space into four quadrants.
2.6.2 Cartesian quadrant analysis
The core analytical technique employed Cartesian diagram plotting to visually represent the relationship between importance and performance for each indicator. Each indicator was plotted as a single point using its mean importance score as the X coordinate and its mean performance score as the Y coordinate. The resulting scatter plot was divided into four quadrants using the grand mean values as dividing lines, with X̄ serving as the vertical divider and Ȳ serving as the horizontal divider.
Quadrant assignment followed these decision rules:
•Quadrant I: X̄ᵢ ≥ X̄ and Ȳᵢ < Ȳ (high importance, low performance)
•Quadrant II: X̄ᵢ ≥ X̄ and Ȳᵢ ≥ Ȳ (high importance, high performance)
•Quadrant III: X̄ᵢ < X̄ and Ȳᵢ < Ȳ (low importance, low performance)
•Quadrant IV: X̄ᵢ < X̄ and Ȳᵢ ≥ Ȳ (low importance, high performance)
Separate Cartesian diagrams were generated for each of the four dimensions (IW, IM, MT, and MN) to enable within-dimension analysis, as well as a composite diagram incorporating all 19 indicators to enable cross-dimensional pattern identification. This multi-level visualization approach allows examination of performance patterns both within specific domains and across the entire framework [41, 42].
2.6.3 Sensitivity analysis for quadrant classification
To assess the robustness of quadrant classifications and address potential sensitivity to sample-specific variations, sensitivity analysis was conducted comparing three alternative baseline approaches:
•Method 1 (Grand Mean, Primary): X-axis threshold equals mean of all importance scores (X̄ = 4.23); Y-axis threshold equals mean of all performance scores (Ȳ = 4.05). This approach reflects actual respondent perceptions within the study sample.
•Method 2 (Scale Midpoint, Theoretical): X-axis and Y-axis thresholds both equal 3.0 (midpoint of 1 to 5 Likert scale). This approach uses theoretical scale center independent of sample data.
•Method 3 (Bootstrapped Cutoffs, Statistical): 1000 bootstrap resamples generated 95% confidence intervals for X̄ and Ȳ. Median bootstrap values used as alternative baselines (X̄ bootstrap = 4.21, 95% CI: 4.15 to 4.28; Ȳ bootstrap = 4.03, 95% CI: 3.96 to 4.11).
Classification stability was assessed by calculating the proportion of indicators maintaining the same quadrant position across all three methods. Indicators with consistent classification (same quadrant in at least 2 of 3 methods) were considered robust; those with inconsistent classification were flagged for interpretive caution.
2.6.4 Analytical software
Data processing and visualization were conducted using Microsoft Excel 2021 for Windows. Descriptive statistics were calculated using Excel's built-in statistical functions (AVERAGE, STDEV, COUNT). Cartesian quadrant were generated using Excel's scatter plot functionality with custom formatting to display quadrant dividing lines, axis labels, and data point labels corresponding to indicator codes. Bootstrap analysis for sensitivity testing was conducted using Excel's random number generation and iterative calculation features. This software selection ensures accessibility and replicability for practitioners in resource-constrained contexts who may not have access to specialized statistical software packages.
2.7 Study scope and limitations
This study represents a small-scale pilot application of the quadrant-based framework, designed to demonstrate proof-of-concept and generate preliminary exploratory insights rather than to validate the framework or produce generalizable findings. The sample size (n = 30) and geographic scope (three contractors in Greater Malang) limit findings entirely to the specific sample studied and do not support generalization to the broader Indonesian construction industry or international contexts. This exploratory approach is appropriate for the framework development stage, where in-depth diagnostic insights from purposively selected cases provide foundational understanding and enable methodological refinement [43]. However, findings must be interpreted with caution as preliminary observations from a non-representative sample.
Full framework verification which is beyond the scope of this pilot study would require: (1) expanded sample size across multiple cities and contractor types (minimum n = 100 to 150), (2) cross-regional replication studies testing framework stability across different regulatory and market contexts, (3) structural validity testing through CFA empirically validating the four-dimensional indicator structure in target contexts, and (4) longitudinal assessment tracking performance changes over time. The current pilot study establishes the framework's feasibility and potential diagnostic utility, creating the foundation for subsequent large-scale validation efforts.
A particularly important limitation concerns the four-dimensional structure of the framework. This study adopted indicators from the validated WMPET framework [30, 31], assuming structural validity based on prior validation. The four-dimensional classification (IW, IM, MT, and MN) was not independently verified in the Greater Malang context through any empirical procedure including expert Delphi, EFA, or CFA. The dimensional structure is therefore assumed from prior literature, not tested in this study. This means the assignment of individual indicators to dimensions may or may not reflect the underlying factor structure in the Greater Malang construction context, and conclusions about dimension-level patterns must be interpreted accordingly. While indicators show strong face validity and theoretical coherence, future research should conduct CFA with larger samples (n > 150) to empirically verify dimensional structure. Some indicators (e.g., IW1 commitment, MN4 collection period) may exhibit interpretation variability across respondent roles (managers vs. field workers), potentially affecting performance assessments. Structural validation represents a critical next step for framework refinement.
3.1 Descriptive statistics of the workforce variable
The IW encompasses six indicators measuring human capital and institutional capacity aspects of C&DW management. Table 3 presents descriptive statistics for both importance and performance assessments across all workforce indicators.
The IW demonstrates the highest average importance score (4.28) among all four dimensions, indicating strong recognition within this sample of human capital's centrality to effective C&DW management. All six indicators achieved importance ratings above 4.0, with organizational structure for waste management (IW3) rated highest (4.40) and availability of waste management personnel (IW2) rated lowest (4.17), though still reflecting strong perceived importance.
Table 3. Descriptive statistics for workforce dimension (IW) indicators
|
Code |
Indicator |
Importance |
Performance |
Gap |
||||
|
Mean |
SD |
Rank |
Mean |
SD |
Rank |
(I-P) |
||
|
IW1 |
Contractor commitment to waste management |
4.27 |
0.52 |
3 |
4.20 |
0.48 |
1 |
0.07 |
|
IW2 |
Availability of waste management personnel |
4.17 |
0.59 |
5 |
4.13 |
0.57 |
2 |
0.04 |
|
IW3 |
Organizational structure for waste management |
4.40 |
0.50 |
1 |
3.68 |
0.69 |
6 |
0.72 |
|
IW4 |
Technical competency in waste handling |
4.20 |
0.55 |
4 |
4.10 |
0.61 |
3 |
0.10 |
|
IW5 |
Knowledge of waste management regulations |
4.37 |
0.49 |
2 |
4.07 |
0.64 |
4 |
0.30 |
|
IW6 |
Worker awareness of waste prevention |
4.30 |
0.53 |
3 |
3.92 |
0.71 |
5 |
0.38 |
|
Dimension Average |
|
4.28 |
0.53 |
|
4.02 |
0.62 |
|
0.27 |
Performance scores reveal greater variability, with a dimension average of 4.02. Contractor commitment (IW1) achieved the highest performance score (4.20), suggesting that senior management in these three companies demonstrates visible support for waste management initiatives. However, organizational structure (IW3) exhibited the largest importance-performance gap (0.72), indicating that among respondents in this sample, while contractors recognize the need for formal organizational arrangements, actual implementation of dedicated structures, clear role assignments, and accountability mechanisms appears deficient. Worker awareness of waste prevention (IW6) also shows substantial gap (0.38), suggesting that frontline workforce understanding lags behind managerial recognition of its importance in the companies surveyed.
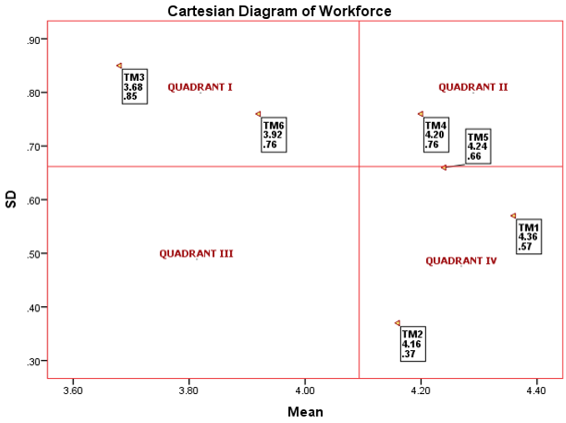
Figure 1 presents the Cartesian diagram for IW indicators, visualizing the relationship between importance and performance using grand mean values as quadrant dividers (X̄ = 4.28; Ȳ = 4.02).
The quadrant classification reveals that two indicators occupy Quadrant I (high importance, low performance), requiring prioritized attention: organizational structure for waste management (IW3) and worker awareness of waste prevention (IW6). These represent observed gaps where recognized importance does not appear to translate into adequate implementation in this sample. Two indicators occupy Quadrant II (high importance, high performance): contractor commitment (IW1) and knowledge of regulations (IW5), representing strengths to maintain. Two indicators occupy Quadrant IV (low relative importance, high performance): availability of personnel (IW2) and technical competency (IW4), suggesting adequate implementation despite slightly lower perceived importance relative to other workforce factors.
3.2 Descriptive statistics of the material dimension
The IM comprises four indicators measuring material selection, procurement planning, and lifecycle management practices. Table 4 presents descriptive statistics for IM indicators.
Table 4. Descriptive statistics for material dimension (IM) indicators
|
Code |
Indicator |
Importance |
Performance |
Gap |
||||
|
Mean |
SD |
Rank |
Mean |
SD |
Rank |
(I-P) |
||
|
IM1 |
Commitment to using recycled materials |
4.23 |
0.57 |
2 |
4.17 |
0.59 |
2 |
0.06 |
|
IM2 |
Use of recycled/reclaimed materials |
4.27 |
0.58 |
1 |
4.08 |
0.65 |
3 |
0.19 |
|
IM3 |
Prevention of material over-ordering |
4.20 |
0.61 |
3 |
3.96 |
0.67 |
4 |
0.24 |
|
IM4 |
Reduction of rework and errors |
4.10 |
0.66 |
4 |
4.68 |
0.48 |
1 |
-0.58 |
|
Dimension Average |
|
4.20 |
0.61 |
|
4.22 |
0.60 |
|
-0.02 |
The IM exhibits the smallest importance-performance gap among all dimensions (mean gap of −0.02), indicating relatively balanced recognition and implementation among the sampled contractors. Use of recycled/reclaimed materials (IM2) achieved the highest importance rating (4.27), reflecting awareness of circular economy principles among respondents. However, its performance score (4.08) reveals a gap that may reflect implementation challenges, potentially stemming from limited availability of quality recycled materials, higher costs, or concerns about material reliability and building code compliance.
Notably, reduction of rework and errors (IM4) demonstrates an inverse relationship with a negative gap (importance 4.10, performance 4.68), suggesting that contractors in this sample have achieved strong implementation in quality control and error prevention, possibly driven by cost savings motivations beyond waste management objectives. Whether this reflects a business case motivation is a possible interpretation, but cannot be confirmed from the current data.
Prevention of material over-ordering (IM3) shows a moderate gap (0.24), indicating that while contractors recognize the importance of accurate quantity planning, procurement practices appear to still generate excess materials in the observed companies. This may reflect risk-averse procurement strategies where over-ordering provides buffers against supply disruptions or inaccurate quantity estimates, but results in surplus materials that become waste.
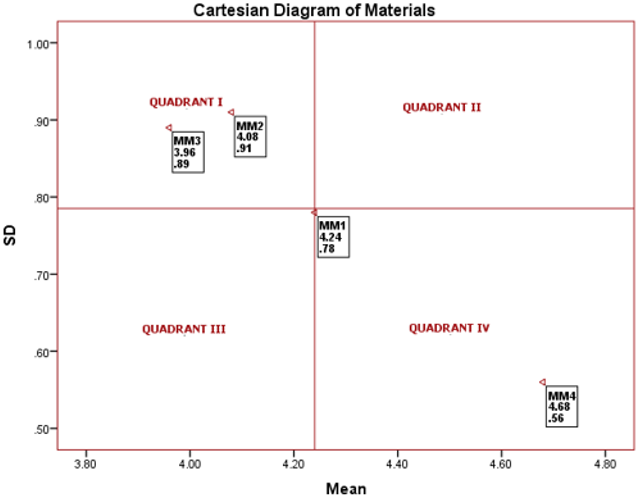
Quadrant classification identifies two priority intervention indicators in Quadrant I: use of recycled materials (IM2) and prevention of material over-ordering (IM3) (Figure 2). One indicator in Quadrant II represents maintained strength: commitment to using recycled materials (IM1). One indicator in Quadrant IV suggests possible resource reallocation opportunity: rework reduction (IM4), where high implementation already exists despite slightly lower relative perceived importance.
3.3 Descriptive statistics of the method variable
The descriptive statistics for the method variable, including the mean and SD, are presented in Table 5.
The MT demonstrates moderate importance recognition (average 4.23) with moderate implementation levels (average 4.05) among respondents. Waste separation at source (MT1) achieved the highest importance rating (4.33), reflecting widespread recognition among the sampled respondents that segregating waste streams at point of generation is fundamental to enabling recycling and proper disposal. However, its performance score (4.03) indicates a gap that may be related to implementation challenges, possibly related to limited space for multiple waste containers on construction sites, insufficient worker training in segregation protocols, or lack of differentiated downstream waste processing infrastructure that would reward separation efforts.
Table 5. Descriptive statistics for method dimension (MT) indicators
|
Code |
Indicator |
Importance |
Performance |
Gap |
||||
|
Mean |
SD |
Rank |
Mean |
SD |
Rank |
(I-P) |
||
|
MT1 |
Waste separation at source |
4.33 |
0.55 |
1 |
4.03 |
0.67 |
3 |
0.30 |
|
MT2 |
Worker reminders for waste prevention |
4.17 |
0.59 |
4 |
4.12 |
0.62 |
1 |
0.05 |
|
MT3 |
Construction design optimization |
4.27 |
0.58 |
2 |
4.00 |
0.69 |
4 |
0.27 |
|
MT4 |
Performance evaluation of waste management |
4.13 |
0.63 |
5 |
4.10 |
0.66 |
2 |
0.03 |
|
MT5 |
Waste storage infrastructure planning |
4.23 |
0.57 |
3 |
4.00 |
0.64 |
4 |
0.23 |
|
Dimension Average |
|
4.23 |
0.58 |
|
4.05 |
0.66 |
|
0.18 |
Construction design optimization (MT3) and waste storage infrastructure planning (MT5) both show substantial gaps (0.27 and 0.23 respectively), indicating that upstream planning interventions receive strong conceptual support among respondents but appear to face implementation barriers in the sampled companies. Design optimization may require early-stage collaboration between architects, engineers, and contractors that may not occur in fragmented project delivery systems. Storage infrastructure planning may require dedicating valuable site space to waste management facilities, often deprioritized in favor of material storage or equipment placement.
Worker reminders (MT2) and performance evaluation (MT4) demonstrate smaller gaps, suggesting relatively successful implementation of ongoing management and monitoring activities within this sample.
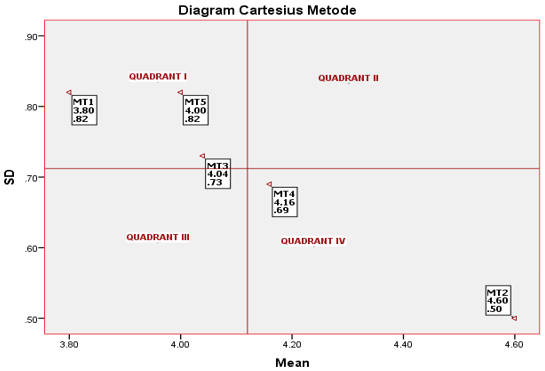
Quadrant classification reveals three indicators in Quadrant I requiring prioritized intervention based on this sample's data: waste separation at source (MT1), construction design optimization (MT3), and waste storage infrastructure planning (MT5) (Figure 3). These represent recognized best practices that the sampled contractors appear to struggle to implement effectively. Two indicators occupy Quadrant IV: worker reminders (MT2) and performance evaluation (MT4), suggesting adequate implementation relative to their perceived importance. No indicators occupy Quadrants II or III in the MT.
3.4 Descriptive statistics of the management dimension
The MN comprises four indicators assessing governance structures, regulatory compliance, and administrative systems. Table 6 presents descriptive statistics for MN indicators.
The MN exhibits the largest average importance-performance gap (0.51) among all four dimensions in this sample, indicating substantial observed deficiencies in governance and administrative systems despite strong recognition of their importance. Three indicators demonstrate particularly large gaps: monitoring and reporting systems (MN3, gap 0.79), environmental clauses in contracts (MN2, gap 0.66), and waste management policies and SOPs (MN1, gap 0.65).
These findings suggest, within this specific sample, that there may be underinvestment in formal governance mechanisms. The relatively low performance scores for written policies and standard operating procedures (MN1, 3.72) suggest possible reliance on informal, ad-hoc waste management approaches rather than institutionalized systems in these companies. Limited integration of environmental requirements into construction contracts (MN2, performance 3.64) may indicate that waste management responsibilities are not clearly defined or enforced through contractual mechanisms. The lowest performance score across all 19 indicators is observed for monitoring and reporting systems (MN3, performance 3.48), suggesting that among the sampled companies, systematic data collection and documentation practices may be underdeveloped.
In contrast, waste collection efficiency (MN4) demonstrates strong performance (4.24), which may reflect that waste removal logistics are straightforward operational tasks requiring primarily coordination with waste haulers rather than complex institutional development.
Table 6. Descriptive statistics for management dimension (MN) indicators
|
Code |
Indicator |
Importance |
Performance |
Gap |
||||
|
Mean |
SD |
Rank |
Mean |
SD |
Rank |
(I-P) |
||
|
MN1 |
Waste management policies and SOPs |
4.37 |
0.56 |
1 |
3.72 |
0.74 |
3 |
0.65 |
|
MN2 |
Environmental clauses in contracts |
4.30 |
0.60 |
2 |
3.64 |
0.77 |
4 |
0.66 |
|
MN3 |
Monitoring and reporting systems |
4.27 |
0.58 |
3 |
3.48 |
0.82 |
4 |
0.79 |
|
MN4 |
Waste collection efficiency |
4.17 |
0.65 |
4 |
4.24 |
0.62 |
1 |
-0.07 |
|
Dimension Average |
|
4.28 |
0.60 |
|
3.77 |
0.74 |
|
0.51 |
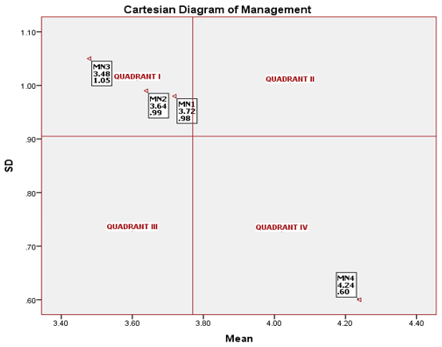
Quadrant classification reveals three indicators in Quadrant I requiring urgent attention: policies and SOPs (MN1), contract clauses (MN2), and monitoring systems (MN3) (Figure 4). One indicator occupies Quadrant IV: collection efficiency (MN4). The concentration of three out of four management indicators in Quadrant I underscores the critical governance deficit identified in this dimension, representing perhaps the most significant barrier to advancing C&DW management performance in the study context.
3.5 Sensitivity analysis results
To assess the robustness of quadrant classifications and address potential sensitivity to sample specific variations, sensitivity analysis was conducted comparing three alternative baseline approaches as described in Section 2.6.3. Table 7 presents sensitivity analysis results comparing quadrant classifications across the three methods.
Table 7. Sensitivity analysis of quadrant classifications
|
Indicator |
Grand Mean (Primary) |
Scale Midpoint |
Bootstrap Median |
Classification Stability |
|
IW1 |
Quadrant IV |
Quadrant II |
Quadrant IV |
Robust (2/3) |
|
IW2 |
Quadrant IV |
Quadrant II |
Quadrant IV |
Robust (2/3) |
|
IW3 |
Quadrant I |
Quadrant I |
Quadrant I |
Highly Robust (3/3) |
|
IW4 |
Quadrant IV |
Quadrant II |
Quadrant IV |
Robust (2/3) |
|
IW5 |
Quadrant II |
Quadrant II |
Quadrant II |
Highly Robust (3/3) |
|
IW6 |
Quadrant I |
Quadrant I |
Quadrant I |
Highly Robust (3/3) |
|
IM1 |
Quadrant II |
Quadrant II |
Quadrant II |
Highly Robust (3/3) |
|
IM2 |
Quadrant I |
Quadrant II |
Quadrant I |
Robust (2/3) |
|
IM3 |
Quadrant I |
Quadrant I |
Quadrant I |
Highly Robust (3/3) |
|
IM4 |
Quadrant IV |
Quadrant II |
Quadrant IV |
Robust (2/3) |
|
MT1 |
Quadrant I |
Quadrant I |
Quadrant I |
Highly Robust (3/3) |
|
MT2 |
Quadrant IV |
Quadrant II |
Quadrant IV |
Robust (2/3) |
|
MT3 |
Quadrant I |
Quadrant II |
Quadrant I |
Robust (2/3) |
|
MT4 |
Quadrant IV |
Quadrant II |
Quadrant IV |
Robust (2/3) |
|
MT5 |
Quadrant I |
Quadrant II |
Quadrant I |
Robust (2/3) |
|
MN1 |
Quadrant I |
Quadrant I |
Quadrant I |
Highly Robust (3/3) |
|
MN2 |
Quadrant I |
Quadrant I |
Quadrant I |
Highly Robust (3/3) |
|
MN3 |
Quadrant I |
Quadrant I |
Quadrant I |
Highly Robust (3/3) |
|
MN4 |
Quadrant IV |
Quadrant II |
Quadrant IV |
Robust (2/3) |
Classification Stability Summary:
Bootstrap Results:
The sensitivity analysis reveals strong classification stability across alternative baseline methods within this sample's data. All 11 Quadrant I priority indicators (IW3, IW6, IM2, IM3, MT1, MT3, MT5, MN1, MN2, and MN3) maintain Quadrant I classification in at least 2 of 3 methods, with 7 indicators (IW3, IW6, IM3, MT1, MN1, MN2, MN3) showing perfect stability across all three methods. This robustness increases confidence that the priority classifications observed in this sample reflect genuine importance-performance gaps within the study context, rather than artifacts of baseline selection methodology. It does not, however, imply that these patterns would be reproduced in a larger or different sample.
The scale midpoint method shifts many indicators to Quadrant II, reflecting that absolute performance levels (mean scores approximately 4.0 to 4.2) exceed the theoretical scale midpoint (3.0), even when below the sample-specific average. However, for strategic prioritization within the study context, the grand mean approach remains most appropriate as it identifies relative performance gaps specific to Greater Malang contractors' current baseline.
The bootstrap method, which accounts for sampling variability through resampling, produces results highly consistent with the grand mean approach. Bootstrap confidence intervals for both X̄ and Ȳ are narrow (approximately 0.13 to 0.15 range), indicating stable estimates within this dataset despite the relatively small sample size (n = 30). The close alignment between grand mean values (X̄ = 4.23, Ȳ = 4.05) and bootstrap median values (X̄ = 4.21, Ȳ = 4.03) further validates the primary classification methodology for the purposes of this pilot study.
Importantly, no indicators exhibited unstable classification (appearing in different quadrants across all three methods), providing preliminary evidence that the framework's diagnostic conclusions within this sample are methodologically robust. The 11 priority indicators identified in Quadrant I through the grand mean approach consistently emerge as priorities under alternative baseline assumptions, supporting the consistency of the pilot study's diagnostic findings for Greater Malang contractors. Nonetheless, whether these patterns generalize to other contractors or regions requires empirical verification.
The following discussion presents interpretations of patterns observed within this specific pilot sample of 30 respondents from three construction contractors in Greater Malang. All interpretations are offered as preliminary hypotheses suggested by the data rather than as established conclusions. Given the small and non-representative sample, findings cannot be generalized to the broader Indonesian construction industry, to other regions, or to similar contexts without further empirical research. Causal attributions are speculative and are presented to suggest potential explanatory mechanisms for future investigation, not as verified explanations. Comparisons with existing literature are intended to situate the observed patterns within broader scholarly conversations, not to claim that this pilot study confirms or validates findings from prior research.
4.1 Systematic pattern: Governance deficit and upstream planning gaps
The quadrant-based analysis reveals an observed pattern within this sample: indicators positioned in Quadrant I (high importance, low performance) tend to involve upstream planning and governance mechanisms, while indicators in Quadrant IV (low relative importance, high performance) tend to involve operational execution tasks. This pattern, observed in the data, may suggest that EP improvement in developing economy construction contexts requires attention to project planning and institutional governance; however, whether this pattern reflects a genuine structural dynamic or is an artifact of the small sample cannot be determined from this study alone.
Specifically, the 11 priority indicators identified in Quadrant I span governance mechanisms (MN1, MN2, MN3), organizational infrastructure (IW3), upstream planning processes (MT3, MT5, IM3), and behavioral change initiatives (IW6, IM2, MT1). These indicators share observable characteristics in that they appear to require systematic institutional development, formal organizational arrangements, upfront resource allocation, and sustained management commitment. In contrast, high-performing indicators (IW1, IM4, MT2, MT4, MN4) tend to involve discrete operational tasks such as visible leadership support, quality control, worker communication, and logistics coordination.
This observed bifurcation is consistent with findings from previous research on construction waste management in developing economies [18, 44, 45], though the current pilot study cannot independently confirm whether the same mechanisms are at play. The pattern observed here may indicate that the sampled contractors possess adequate operational capabilities but face constraints in institutional development and upstream planning a hypothesis that warrants investigation in future studies with larger samples.
4.2 Workforce dimension: Organizational structure as critical constraint
The IW analysis reveals that organizational structure for waste management (IW3) showed the largest importance-performance gap (0.72) within this dimension and one of the largest across all 19 indicators in this sample. This suggests that among the respondents surveyed, while contractors recognize the need for dedicated organizational units, clear role assignments, and formal accountability mechanisms for waste management, actual implementation appears to be deficient. Current practice in these three companies appears characterized by informal approaches where waste management responsibilities are not clearly assigned or systematically monitored, though this characterization is based on self-reported perceptions rather than verified organizational assessments.
This organizational gap may create cascading constraints across other workforce indicators in the sampled companies. Without formal organizational structures, technical competency development (IW4) may lack institutional support, worker awareness initiatives (IW6) may lack systematic delivery mechanisms, and regulatory knowledge (IW5) may lack organizational processes for translation into practice. This possible relationship is consistent with capability approach theory [39, 40], though the current data cannot establish this causal sequence.
The strong performance in contractor commitment (IW1) despite weak organizational structures suggests a possible gap between senior management demonstrating verbal support and the institutional investments (dedicated positions, budget allocations, formal reporting lines) necessary for systematic implementation. This pattern is consistent with observations in prior research on corporate environmental responsibility [46, 47], though whether the same dynamic is operating here would need further investigation.
Worker awareness of waste prevention (IW6) also shows a notable gap in this sample. The data suggest that environmental awareness may be concentrated at managerial levels without effective cascading to operational personnel in the sampled organizations. Previous research confirms that worker-level environmental behaviors require not only individual awareness but also organizational systems that enable, support, and reward such behaviors [36, 48]. Whether this mechanism applies here is a hypothesis for future investigation.
4.3 Material dimension: Circular economy implementation barriers
The IM reveals notable observations regarding circular economy implementation in this sample. Use of recycled/reclaimed materials (IM2) demonstrates an importance-performance gap (0.19), indicating that among surveyed respondents, there is widespread conceptual support for circular material flows but apparently limited practical implementation. This gap may reflect multiple barriers documented in previous research: limited availability of quality recycled construction materials in local markets, higher costs compared to virgin materials, concerns about material reliability and building code compliance, and absence of supply chain infrastructure supporting recycled material procurement [49, 50]. However, the current study did not directly measure these factors, and the observed gap may reflect different or additional constraints specific to the local context.
These possible barriers are particularly relevant in developing economy contexts like Greater Malang, where recycled material markets may be underdeveloped. If so, individual contractor commitments to using recycled materials may face structural constraints beyond their direct control a possibility consistent with circular economy literature [8, 51] but not directly testable with the current data.
Prevention of material over-ordering (IM3) shows a moderate gap (0.24), which may reflect challenges in accurate quantity estimation and risk-averse procurement strategies. Addressing this gap may require improved technical capabilities in quantity surveying and procurement planning, as well as supply chain reliability that reduces the need for precautionary safety stocks [52, 53]. Whether over-ordering reflects deliberate risk management or technical estimation limitations cannot be determined from this data alone.
The strong performance in rework reduction (IM4) despite relatively lower perceived importance is a notable finding. One possible interpretation is that quality control and error prevention are well-established practices driven by direct cost savings motivations, with waste reduction as a secondary benefit. Framing waste management within business case logic may enhance uptake compared to purely environmental appeals, particularly in resource-constrained contexts where environmental motivations compete with immediate economic pressures [54, 55]. This interpretation is plausible but cannot be confirmed without qualitative investigation of contractor motivations.
4.4 Method dimension: Upstream planning deficit
The MT demonstrates relatively lower performance scores in upstream planning and design integration activities (MT3, MT5) compared to ongoing operational tasks (MT2, MT4) in this sample. Construction design optimization (MT3) and waste storage infrastructure planning (MT5) both exhibit importance-performance gaps, indicating that within the sampled companies, waste minimization considerations may not be adequately integrated into early project stages.
Design optimization for waste reduction may require collaboration between architects, engineers, and contractors during design development, but traditional project delivery systems often separate design and construction phases, limiting contractor input into design decisions [56, 57]. Whether this structural dynamic fully explains the gap observed here, or whether other factors are equally or more important, is an empirical question for future research.
Waste storage infrastructure planning (MT5) showed lower performance scores, which may relate to construction sites in dense urban contexts facing space constraints, with waste management infrastructure competing with other operational priorities. This possible explanation is consistent with previous research [58, 59] but was not directly tested in this study.
Waste separation at source (MT1), despite high importance recognition (4.33), demonstrates a moderate gap (performance 4.03). Possible factors contributing to this gap such as limited containers, insufficient worker training, or downstream recycling infrastructure gaps are consistent with prior literature [60, 61] but would require empirical verification in this context. Where mixed waste and separated waste face identical disposal pathways due to limited recycling facilities, separation efforts generate no tangible benefit, reducing motivation for consistent practice a dynamic documented elsewhere [60, 61] that may apply in this setting.
4.5 Management dimension: Governance and administrative system deficits
The MN exhibits the largest average importance-performance gap in this sample, with three of four indicators (MN1, MN2, MN3) occupying Quadrant I and demonstrating the largest importance-performance gaps in the entire framework. This concentration in Quadrant I suggests that governance and administrative system development may be an important intervention area for the sampled companies, though the extent to which this reflects broader contractor populations is unknown.
The relatively low performance scores for written policies and standard operating procedures (MN1, performance 3.72) suggest possible reliance on informal, ad-hoc waste management approaches rather than formalized, documented systems in the sampled companies. Without written policies establishing organizational expectations, procedures specifying implementation protocols, and SOPs standardizing operational practices, waste management may depend on individual initiative rather than systematic organizational routines, which could create inconsistency across projects, reduce accountability, and inhibit knowledge transfer [38, 62]. This causal chain is theoretically plausible but cannot be verified from the present data.
Limited integration of environmental clauses in construction contracts (MN2, performance 3.64) may indicate that waste management responsibilities are not systematically embedded in contractual relationships with subcontractors and suppliers in the observed companies. Research suggests that contract clauses represent a critical governance mechanism for extending environmental requirements beyond the primary contractor to the entire project supply chain [63, 64], and the gap observed here is consistent with that view.
The lowest performance score across all 19 indicators is observed for monitoring and reporting systems (MN3, performance 3.48), suggesting that systematic data collection may be severely underdeveloped in the sampled companies. Without performance measurement, it may be difficult for contractors to identify specific problem areas requiring attention or demonstrate progress to stakeholders, a challenge documented in previous research on environmental data systems [65, 66]. Whether this monitoring deficit reflects resource constraints, lack of regulatory pressure, or absence of internal demand for performance data is unclear from the current data.
These governance gaps may be mutually reinforcing in ways documented by prior research [67, 68]: without policies establishing expectations, there is no framework guiding what should be monitored; without monitoring generating performance data, there is no information revealing whether policies are effective; without contractual requirements, there are no mechanisms enforcing policies across project networks. Whether this cycle is operating in the sampled companies is a hypothesis for future investigation, not a conclusion supported by the current data. The strong performance in waste collection efficiency (MN4) is notable and may reflect that operational logistics are more easily managed within existing routines, contrasting with the systemic governance gaps observed in MN1–MN3.
4.6 Cross-dimensional patterns: Systematic governance and planning deficits
4.6.1 Upstream planning deficit across dimensions
An observable tendency across dimensions is that upstream planning and design integration indicators tend to show lower performance scores relative to their perceived importance in this sample. This tendency manifests in organizational planning (IW3), material procurement planning (IM3), design optimization (MT3), infrastructure planning (MT5), and policy development (MN1). One possible explanation is that these indicators require decisions and investments during early project stages, before waste generation occurs and before immediate operational pressures dominate attention though this remains a hypothesis for future investigation.
This observation may be consistent with several interrelated challenges documented in the literature. Early-stage planning may require anticipating future operational needs, a capability that could depend on organizational learning systems capturing lessons from previous projects. However, the weak monitoring (MN3) observed in this sample may hinder such learning. Construction project cycles are generally short, creating incentives for solutions with immediate payoffs rather than investments in planning infrastructure with deferred returns [69, 70], a dynamic that may apply in the current context but cannot be verified without further research.
Potential interventions suggested by the literature such as contractual requirements mandating waste management planning documentation, integration of waste management considerations into building permit processes, and capacity building targeting project planning skills [71, 72] may be relevant for the Greater Malang context, though their effectiveness would need empirical evaluation.
4.6.2 Governance versus technical capacity gap
The data reveal an observable divergence between governance/institutional indicators and technical/operational indicators in this sample. Governance indicators (policies, contracts, monitoring, organizational structure) show consistently lower performance scores and cluster in Quadrant I, while technical and operational indicators (commitment, rework reduction, worker reminders, collection efficiency) demonstrate comparatively stronger performance. This observed pattern may indicate that implementation barriers differ across indicator types within this sample a hypothesis consistent with prior research [73, 74] but requiring empirical verification.
A possible explanation is that technical and operational improvements may be achievable through discrete interventions (providing equipment, delivering training, establishing routines) that fit within existing organizational structures, while governance improvements require systemic organizational changes that encounter resistance from established practices, require sustained management attention, and demand organizational capabilities that may be underdeveloped [73, 74]. Whether this explanation applies to the sampled companies is a hypothesis requiring qualitative investigation.
These observations suggest that future interventions might benefit from combining institutional capacity building with technical training, as formal systems, clear accountability, performance measurement, and organizational structures that enable and sustain individual competencies are central to effective environmental management [75]. The specific approaches best suited to the Greater Malang context require further empirical investigation.
4.7 Theoretical contributions
4.7.1 Framework extension and integration
Beyond the empirical observations from this pilot application, this study contributes a methodological extension that offers potential enhancements to existing C&DW evaluation approaches. The framework addresses methodological limitations in existing tools by integrating importance-performance dual assessment, visual quadrant classification, and cross-dimensional pattern analysis into a cohesive diagnostic system. The pilot application demonstrates the framework's feasibility and preliminary utility, though comprehensive evaluation of its contribution relative to existing tools requires application with larger and more diverse samples [18, 30, 31].
The framework's contribution lies not in creating entirely new indicators, as these build on the validated WMPET structure [30, 31], but in the analytical architecture combining importance and performance measurement with visual prioritization. This extension transforms linear evaluation (measuring performance alone) into a diagnostic tool (identifying what matters most yet performs worst) that may address practitioner needs for actionable guidance. The methodological value resides in integration and visualization rather than indicator innovation, though empirical evaluation of whether this additional analytical layer meaningfully improves practitioner decision-making compared to existing tools remains a direction for future research.
4.7.2 Theoretical integration through gap analysis
The framework operationalizes a theoretical integration approach through importance-performance gap analysis. Importance scores reflect normative recognition, capturing theoretical acceptance of principles from circular economy, lean construction, capability approach, and institutional theory. Performance scores reflect practical implementation, capturing resource constraints, capacity limitations, and institutional barriers. The gap between these dimensions, as observable in the pilot data, reveals where theoretical principles appear not to translate into practice in the sampled companies identifying potential bottlenecks for environmental improvement in resource-constrained contexts [36, 37, 38].
This gap-focused approach offers a bridge between academic theory and practitioner reality. By identifying where contractors recognize theoretical importance but face apparent implementation barriers, the framework shifts analytical focus from measuring deviations from ideal states to identifying specific constraints thereby potentially generating more actionable insights for intervention design [76, 77]. Whether this approach is more actionable in practice than alternative frameworks is an empirical question requiring user-study research.
4.8 Practical implications
4.8.1 Prioritized intervention roadmap
Based on the quadrant classification from this pilot sample, the following preliminary intervention suggestions are offered. These are derived from the observed patterns in three Greater Malang companies and should be treated as hypotheses about potentially useful approaches rather than empirically validated prescriptions. Implementation in other contexts would require local assessment of needs and capacities.
The 11 indicators in Quadrant I in this sample represent areas where importance recognition appears to exist but implementation appears deficient, suggesting potential receptivity to support interventions. A phased intervention approach might address foundational, intermediate, and advanced capacity needs sequentially. Foundational interventions could establish basic organizational infrastructure for waste management (IW3) through designating responsibility holders, creating reporting procedures, and allocating budgets. Development of template waste management policies and standard operating procedures (MN1) adapted to contractor scale and project types would provide documented frameworks guiding implementation. Introduction of simple contract clause templates for environmental requirements (MN2) that contractors can incorporate into subcontractor agreements would extend accountability across project networks. Training in accurate material quantity estimation and procurement planning could reduce over-ordering (IM3).
Intermediate capacity building might implement worker awareness programs targeting frontline personnel (IW6), using toolbox talks, visual signage, and supervisor training. Establishment of basic monitoring systems (MN3) using simple waste tracking methods and regular reporting would enable performance feedback. Development of partnerships with recycled material suppliers could improve availability and reliability (IM2). Integration of waste storage infrastructure requirements (MT5) into project site planning templates would ensure adequate space allocation. Piloting design optimization approaches (MT3) in selected projects could demonstrate waste reduction potential and build contractor confidence in upstream planning interventions.
Advanced institutionalization efforts might integrate waste management performance metrics into project evaluation systems. Establishment of internal audit procedures for policy compliance checking would strengthen accountability. Pursuit of external certifications or green building ratings that recognize waste management achievements could create market differentiation. Optimization of Quadrant IV indicators (IW1, IM4, MT2, MT4, MN4) that already perform well through documentation of best practices would enable knowledge transfer across projects and contractors [78, 79].
The sequencing reflects possible logical dependencies, but the specific timeline and resource requirements for progression across these phases would depend on contractor resources, external support availability, regulatory pressures, and local context factors that cannot be predetermined from this pilot study and would require empirical assessment in each implementation setting rather than predetermined schedules.
4.8.2 Policy support requirements
The governance deficits observed in this pilot sample (MN1, MN2, MN3) suggest possible directions for policy support, though the following recommendations are derived from a small sample and should be treated as preliminary hypotheses requiring broader empirical grounding before forming the basis for policy decisions.
Governance deficits could potentially be addressed through regulatory requirements mandating waste management plans, monitoring reports, and contractual environmental clauses as conditions for building permits or contractor licensing [80, 81]. Such requirements would transform waste management from voluntary practice to compliance obligation, creating stronger implementation incentives. Recycled material uptake (IM2) may require supplier ecosystem development, potentially supported through procurement preferences in public projects, quality certification programs establishing reliability standards for recycled materials, or fiscal mechanisms that address cost differentials between virgin and recycled materials [82, 83]. Without reliable supply chains and quality assurance systems, individual contractor commitments face structural constraints beyond their direct control.
Upstream planning integration (MT3, MT5) could potentially be strengthened through building code provisions requiring waste management considerations in design documentation and site layout approvals. Design-build or integrated project delivery contracting in public projects could demonstrate collaboration models enabling early contractor input into design decisions. Professional development programs for architects and engineers could build design-for-waste-minimization competencies [84, 85].
Municipal level interventions might include establishing construction waste transfer stations, certification programs recognizing contractors demonstrating waste management excellence, and peer learning networks to accelerate diffusion of effective practices [86, 87]. These possible interventions are consistent with the patterns observed in this sample and with the broader literature, but would require evaluation of their feasibility, cost-effectiveness, and local regulatory context before implementation.
4.9 Comparative context and transferability potential
4.9.1 Alignment with regional patterns
The patterns observed in this pilot study particularly the Quadrant I positioning of organizational structure (IW3) and regulatory indicators (MN1, MN2, MN3) are broadly consistent with challenges documented in other Southeast Asian developing economy construction sectors [44, 54, 86], suggesting that the framework may be relevant for similar contexts, and that the indicators used may capture phenomena of broader significance. However, consistency with prior literature does not validate the current findings, and the small sample size means the observed patterns may not be representative even of Greater Malang contractors, let alone other regions.
Greater Malang's economic profile with construction contributing 12.56% to GDP and 7.23% annual growth in fixed capital formation [32] may share structural similarities with other rapidly urbanizing Indonesian cities and comparable mid-tier cities in Southeast Asia. This structural similarity suggests the framework methodology may be worth testing in those contexts, though whether similar performance patterns would be observed is an empirical question that cannot be answered from this pilot study.
4.9.2 Divergence from developed economy patterns
The observed pattern of governance deficits potentially overshadowing technical capacity gaps differs from C&DW management challenges typically described in developed economy contexts, where regulatory frameworks, monitoring systems, and contractual mechanisms are well established and implementation challenges center more on cost optimization, market development for recycled materials, and behavior change within functioning institutional systems [88, 89]. This divergence suggests that frameworks and intervention strategies developed for developed economy contexts may require significant adaptation before being applied in settings where basic institutional capacity may be absent a consideration relevant for future research and policy transfer, but one that the current pilot study data can only illustrate rather than establish [90, 91].
4.9.3 Transferability considerations
The framework methodology that is, the dual-axis importance-performance measurement combined with Cartesian quadrant visualization across the four WMPET-derived dimensions may have transferability potential across different contexts. However, several important caveats apply. The specific performance profiles, gap magnitudes, and quadrant assignments observed in this study reflect three specific companies in Greater Malang and cannot be assumed to generalize elsewhere. Applying the framework in different contexts would require local adaptation of indicator wording and operational definitions, and results would need to be interpreted against local institutional contexts [92, 93].
Transferability resides in the assessment approach rather than in the Greater Malang findings themselves. Future applications in different Indonesian cities, other Southeast Asian countries, or other developing regions are warranted to investigate both common patterns and context-specific variations [94, 95], but such applications require original data collection and cannot be inferred from this pilot study.
4.10 Study limitations
Several limitations constrain interpretation and generalizability of findings. The most fundamental limitation is the small sample size (n = 30) and geographic concentration (three contractors in one metropolitan region). This pilot-scale application is appropriate for framework development and initial proof-of-concept but provides no basis for statistical generalization to the broader Indonesian construction industry or to other contexts. All findings should be interpreted as exploratory observations specific to this sample. The purposive sampling approach prioritized contractor diversity across project types but did not employ random selection, further limiting any claim to representativeness. This exploratory approach is appropriate for framework development stages [43], but findings must not be extrapolated beyond the study sample without empirical replication.
Reliance on self-reported importance and performance assessments introduces potential social desirability bias, where respondents may overstate importance recognition or performance levels. Future research should triangulate self-reported assessments with objective performance measures such as waste audit data quantifying actual waste generation and segregation rates, material procurement records documenting over-ordering frequencies, and contract document reviews verifying environmental clause inclusion [96, 97].
The cross-sectional design captures importance and performance at a single time point, precluding assessment of trends, trajectories, or intervention effectiveness. Longitudinal research tracking how importance-performance gaps evolve over time, particularly following targeted interventions, would strengthen causal understanding of what drives performance improvement [98, 99].
The four-dimensional indicator structure is assumed from the WMPET framework [30, 31] and was not independently validated in this study through EFA, CFA, or expert Delphi procedures specific to the Greater Malang context. This represents a critical limitation: the assignment of indicators to dimensions, and conclusions about dimension-level patterns, rest on prior literature rather than empirical verification in the target population. Future research must conduct CFA with larger samples (n > 150) before dimension-level interpretations can be made with confidence. Some indicators may exhibit interpretation variability across respondent roles (managers versus field workers) or project contexts (residential versus commercial construction), affecting reliability of cross-group comparisons [100, 101].
While sensitivity analysis demonstrated robust classification for priority indicators (Section 3.5), the sample-specific baseline approach limits cross-study comparability. Future research should establish industry benchmarks enabling absolute performance assessment alongside relative within-sample evaluations. Additionally, this study did not conduct cost-benefit analysis of proposed interventions or track financial outcomes. Future research incorporating detailed economic analysis, comparing intervention costs against measurable waste reduction outcomes and operational savings, would strengthen business case arguments supporting C&DW management investments [102, 103].
This study makes two primary contributions to C&DW management research and practice. First, it develops and conducts a preliminary pilot application of a quadrant-based performance framework that extends existing waste management evaluation approaches by integrating four critical dimensions (IW, IM, MT, and MN) with dual-axis IPA, providing a potentially useful diagnostic tool that may address fragmentation in existing evaluation methodologies. The framework's methodological advantages include simultaneous importance-performance assessment revealing priority gaps, visual Cartesian representation enabling intuitive strategic interpretation, actionable quadrant-specific guidance for resource allocation, and cross-dimensional comparative analysis that can surface observable patterns.
Applied to 30 respondents from three construction contractors in Greater Malang, Indonesia as a preliminary pilot application, the framework demonstrates proof-of-concept and preliminary diagnostic utility by identifying 10 of 19 indicators (53%) positioned in Quadrant I within this sample as priority improvement areas. Cross-dimensional observation reveals a tendency in this sample: underperforming indicators consistently involve upstream planning and governance mechanisms (organizational structure IW3, material planning IM3, storage design MT5, regulatory frameworks MN1, MN2, MN3) while well-performing indicators involve operational execution (commitment IW1, rework reduction IM4, worker reminders MT2, waste collection MN4). This tendency, made observable through the framework's integrative architecture, suggests that EP improvement in developing economy contexts may require attention to project planning and institutional governance rather than merely operational adjustments an interpretation offered as a hypothesis for further investigation, not as a conclusion generalizable beyond this sample. Sensitivity analysis across three baseline methods (grand mean, scale midpoint, bootstrap median) confirms classification robustness within this sample's data, with all 11 priority indicators maintaining Quadrant I position in at least two of three methods, indicating that the diagnostic classifications are consistent within the study context.
The framework's preliminary pilot application generates the following findings, offered as context-specific observations for Greater Malang contractors and as hypotheses for future research. For contractors, a phased implementation approach could address Quadrant I priorities through foundational restructuring establishing dedicated organizational units, material planning systems, waste infrastructure integration in project designs, and standard operating procedures with contract clause templates. Subsequent capacity building might include training programs, performance measurement systems, supplier partnerships for recycled materials, and design optimization pilots. Advanced institutionalization could integrate C&DW metrics into evaluation systems, establish internal audits, and pursue external certifications. The specific progression pace and resource requirements would depend on individual contractor capacity, external support availability, and regulatory context factors that vary across settings and require empirical assessment rather than predetermined recommendations derived from this pilot study.
For policymakers, preliminary recommendations include municipal certification programs and incentive mechanisms, provincial standards in public contracts and regional training curricula, and national integration into green building certifications with Extended Producer Responsibility schemes. The alignment between patterns observed in this Greater Malang pilot sample and challenges documented in prior Southeast Asian research suggests these directions may be worth exploring, but policy decisions should not be based solely on findings from this small-scale pilot study.
This research was completed with the help and support of various parties. The author expresses gratitude to: 1) The leadership and staff of the Doctoral Program in Environmental Science at the Graduate School of Brawijaya University for their support and provided facilities. 2) The research respondents, namely construction contractors in Malang Raya, who took the time to participate and share valuable information for this study.
|
C&DW |
construction and demolition waste |
|
EP |
environmental performance |
|
IM |
material dimension variable |
|
IW |
workforce dimension variable |
|
M |
mean (average score), dimensionless |
|
MN |
management dimension variable |
|
MT |
method dimension variable |
|
n |
sample size (number of respondents), dimensionless |
|
SD |
standard deviation, dimensionless |
|
WMPE |
waste management performance evaluation tool |
|
X̄ |
grand mean of all importance scores, dimensionless |
|
X̄ᵢ |
mean importance score for indicator i, dimensionless |
|
Ȳ |
grand mean of all performance scores, dimensionless |
|
Ȳᵢ |
mean performance score for indicator i, dimensionless |
|
Subscripts |
|
|
I |
indicator index |
[1] Ortiz, O., Pasqualino, J.C., Castells, F. (2010). Environmental performance of construction waste: Comparing three scenarios from a case study in Catalonia, Spain. Waste Management, 30(4): 646-654. https://doi.org/10.1016/j.wasman.2009.11.013
[2] Amiri, M.J., Asadbeigi, M. (2024). Life cycle assessment of construction and demolition waste management in Tehran, Iran. Environmental Energy and Economic Research, 8(1): eS074. https://doi.org/10.22097/eeer.2023.390450.1284
[3] Yi, Y., Fei, X., Fedele, A., Lavagnolo, M.C., Manzardo, A. (2024). Decision support model for selecting construction and demolition waste management alternatives: A life cycle-based approach. Science of the Total Environment, 951: 175408. https://doi.org/10.1016/j.scitotenv.2024.175408
[4] Gálvez-Martos, J.L., Istrate, I.R. (2020). Construction and demolition waste management. In Advances in Construction and Demolition Waste Recycling, pp. 51-68. https://doi.org/10.1016/B978-0-12-819055-5.00004-8
[5] Dahlbo, H., Bachér, J., Lähtinen, K., et al. (2015). Construction and demolition waste management: A holistic evaluation of environmental performance. Journal of Cleaner Production, 107: 333-341. https://doi.org/10.1016/j.jclepro.2015.02.073
[6] Song, M.L., Fisher, R., Wang, J.L., Cui, L.B. (2018). Environmental performance evaluation with big data: Theories and methods. Annals of Operations Research, 270: 459-472. https://doi.org/10.1007/s10479-016-2158-8
[7] Rayhan, D.S.A., Bhuiyan, I.U. (2024). Review of construction and demolition waste management tools and frameworks with the classification, causes, and impacts of the waste. Waste Disposal & Sustainable Energy, 6(1): 95-121. https://doi.org/10.1007/s42768-023-00166-y
[8] Ruiz, L.A.L., Ramón, X.R., Domingo, S.G. (2020). The circular economy in the construction and demolition waste sector: A review and an integrative model approach. Journal of Cleaner Production, 248: 119238. https://doi.org/10.1016/j.jclepro.2019.119238
[9] Colmenero-Fonseca, F., Salas-Montoya, A., Preciado, A., Palomino-Bernal, J.F., Carcel-Carrasco, J. (2024). Case study on the application of new technologies for construction waste management in a historic building in Jalisco, Mexico. Advances in Civil Engineering, 2024(1): 8503217. https://doi.org/10.1155/2024/8503217
[10] Yu, B., Wang, J., Liao, Y., Wu, H., Wong, A.B. (2021). Determinants affecting purchase willingness of contractors towards construction and demolition waste recycling products: An empirical study in Shenzhen, China. International Journal of Environmental Research and Public Health, 18(9): 4412. https://doi.org/10.3390/ijerph18094412
[11] Kabirifar, K., Mojtahedi, M., Wang, C., Tam, V.W.Y. (2020). Construction and demolition waste management contributing factors coupled with reduce, reuse, and recycle strategies for effective waste management: A review. Journal of Cleaner Production, 263: 121265. https://doi.org/10.1016/j.jclepro.2020.121265
[12] Coelho, A., de Brito, J. (2012). Influence of construction and demolition waste management on the environmental impact of buildings. Waste Management, 32(3): 532-541. https://doi.org/10.1016/j.wasman.2011.11.011
[13] Zambrana-Vasquez, D., Zabalza-Bribián, I., Jáñez, A., Aranda-Usón, A. (2016). Analysis of the environmental performance of life-cycle building waste management strategies in tertiary buildings. Journal of Cleaner Production, 130: 143-154. https://doi.org/10.1016/j.jclepro.2016.02.048
[14] Ye, G., Yuan, H., Shen, L., Wang, H. (2012). Simulating effects of management measures on the improvement of the environmental performance of construction waste management. Resources, Conservation and Recycling, 62: 56-63. https://doi.org/10.1016/j.resconrec.2012.01.010
[15] Kang, K., Besklubova, S., Dai, Y., Zhong, R.Y. (2022). Building demolition waste management through smart BIM: A case study in Hong Kong. Waste Management, 143: 69-83. https://doi.org/10.1016/j.wasman.2022.02.027
[16] Sirimewan, D., Bazli, M., Raman, S.N., Mohandes, S.R., Kineber, A.F., Arashpour, M. (2024). Deep learning-based models for environmental management: Recognizing construction, renovation, and demolition waste in-the-wild. Journal of Environmental Management, 351: 119908. https://doi.org/10.1016/j.jenvman.2023.119908
[17] Sun, W., Tushar, Q., Zhang, G., et al. (2025). An analytical review of construction and demolition waste management and quantification methods using a science mapping approach. Recycling, 10(3): 115. https://doi.org/10.3390/recycling10030115
[18] Wu, H., Zuo, J., Yuan, H., Zillante, G., Wang, J. (2019). A review of performance assessment methods for construction and demolition waste management. Resources, Conservation and Recycling, 150: 104407. https://doi.org/10.1016/j.resconrec.2019.104407
[19] Kim, S.Y., Nguyen, M.V., Luu, V.T. (2020). A performance evaluation framework for construction and demolition waste management: Stakeholder perspectives. Engineering, Construction and Architectural Management, 27(10): 3189-3213. https://doi.org/10.1108/ECAM-12-2019-0683
[20] Khoshand, A., Khanlari, K., Abbasianjahromi, H., Zoghi, M. (2020). Construction and demolition waste management: Fuzzy analytic hierarchy process approach. Waste Management & Research, 38(7): 773-782. https://doi.org/10.1177/0734242X20910468
[21] Cheng, B., Huang, J., Guo, Z., Li, J., Chen, H. (2022). Towards sustainable construction through better construction and demolition waste management practices: A SWOT analysis of Suzhou, China. International Journal of Construction Management, 23: 2614-2624. https://doi.org/10.1080/15623599.2022.2081406
[22] Ghailani, H., Zaidan, A.A., Qahtan, S., et al. (2023). Developing sustainable management strategies in construction and demolition wastes using a q-rung orthopair probabilistic hesitant fuzzy set-based decision modelling approach. Applied Soft Computing, 145: 110606. https://doi.org/10.1016/j.asoc.2023.110606
[23] Ullah, S., Hassan, I.U., Gardezi, S.S.S. (2024). Environmental management framework for road network demolition wastes for construction industry of Pakistan. Sustainability, 16(10): 4302. https://doi.org/10.3390/su16104302
[24] Nadaždi, A., Naunović, Z., Ivanišević, N. (2022). Circular economy in construction and demolition waste management in the Western Balkans: A sustainability assessment framework. Sustainability, 14(2): 871. https://doi.org/10.3390/su14020871
[25] Esguícero, F.J., Deus, R.M., Battistelle, R.A.G., Martins, B.L., Bezerra, B.S. (2021). Construction and demolition waste management process modeling: A framework for the Brazilian context. Journal of Material Cycles and Waste Management, 23(5): 2037-2050. https://doi.org/10.1007/s10163-021-01247-y
[26] Eghbali-Zarch, M., Tavakkoli-Moghaddam, R., Dehghan-Sanej, K., Kaboli, A. (2021). Prioritizing the effective strategies for construction and demolition waste management using fuzzy IDOCRIW and WASPAS methods. Engineering, Construction and Architectural Management, 29(4): 1766-1792. https://doi.org/10.1108/ECAM-08-2020-0617
[27] Kim, Y.C., Hong, W.H., Park, J.W., Cha, G.W. (2017). An estimation framework for building information modeling (BIM)-based demolition waste by type. Waste Management & Research, 35(12): 1285-1295. https://doi.org/10.1177/0734242X17736381
[28] Yazdanbakhsh, A. (2018). A bi-level environmental impact assessment framework for comparing construction and demolition waste management strategies. Waste Management, 77: 401-412. https://doi.org/10.1016/j.wasman.2018.04.024
[29] Ding, Z., Liu, R., Wang, Y., Tam, V.W.Y., Ma, M. (2020). An agent-based model approach for urban demolition waste quantification and a management framework for stakeholders. Journal of Cleaner Production, 285: 124897. https://doi.org/10.1016/j.jclepro.2020.124897
[30] Kim, J.H., Kim, J.M., Cha, H.S., Shin, D.W. (2006). Development of the construction waste management performance evaluation tool (WMPET). In Proceedings of the 23rd International Symposium on Automation and Robotics in Construction, Tokyo, Japan, pp. 263-268. https://doi.org/10.22260/ISARC2006/0051
[31] Hartono, W., Akbar, T., Sugiyarto, S. (2016). Evaluasi sistem manajemen limbah konstruksi pada kontraktor pembangunan gedung di Kota Surakarta untuk mendukung green construction. Matriks Teknik Sipil, 4(2): 494-502. https://doi.org/10.20961/mateksi.v4i2.37006
[32] Badan Pusat Statistik Kota Malang. (2026). The economy of Malang Municipality grew by 5.92 percent in 2025. https://malangkota.bps.go.id/en/pressrelease/2026/03/02/423/ekonomi-kota-malang-tahun-2025-tumbuh-5-92-persen.html.
[33] Badan Pusat Statistik Kota Malang. (2025). Malang Raya Construction Cost Index, 2025. https://malangkota.bps.go.id/id/statistics-table/2/NTA0IzI=/indeks-kemahalan-konstruksi-ikk-malang-raya.html.
[34] Kurniawan, F., Nugraha, X.B., Hartono, J., Wibisono, A.M.A. (2024). Legal framework of sustainable construction procurement to prevent land degradation: Comparison between Indonesia, Singapore and Thailand. Journal of Property, Planning and Environmental Law, 16(2): 92-104. https://doi.org/10.1108/JPPEL-05-2023-0021
[35] Ding, Z., Gong, W., Tam, V.W.Y., Illankoon, I.M.C.S. (2019). Conceptual framework for renovation waste management based on renovation waste generation rates in residential buildings: An empirical study in China. Journal of Cleaner Production, 228: 284-293. https://doi.org/10.1016/j.jclepro.2019.04.153
[36] Yang, B., Song, X., Yuan, H., Zuo, J. (2020). A model for investigating construction workers’ waste reduction behaviors. Journal of Cleaner Production, 265: 121841. https://doi.org/10.1016/j.jclepro.2020.121841
[37] Zhang, Y., Yan, D., Hu, S., Guo, S. (2019). Modelling of energy consumption and carbon emission from the building construction sector in China, a process-based LCA approach. Energy Policy, 134: 110949. https://doi.org/10.1016/j.enpol.2019.110949
[38] Kabirifar, K., Mojtahedi, M., Wang, C.C., Tam, V.W.Y. (2020). A conceptual foundation for effective construction and demolition waste management. Cleaner Engineering and Technology, 1: 100019. https://doi.org/10.1016/j.clet.2020.100019
[39] Sen, A. (1993). Capability and well-being. In The Quality of Life, pp. 30-53. https://doi.org/10.1093/0198287976.003.0003
[40] Ajayi, S.O., Oyedele, L.O. (2017). Policy imperatives for diverting construction waste from landfill: Experts' recommendations for UK policy expansion. Journal of Cleaner Production, 147: 57-65. https://doi.org/10.1016/j.jclepro.2017.01.075
[41] Martilla, J.A., James, J.C. (1977). Importance-performance analysis. Journal of Marketing, 41(1): 77-79. https://doi.org/10.1177/002224297704100112
[42] Slack, N. (1994). The importance-performance matrix as a determinant of improvement priority. International Journal of Operations & Production Management, 14(5): 59-75. https://doi.org/10.1108/01443579410056803
[43] Yin, R.K. (2018). Case Study Research and Applications: Design and Methods (6th ed.). Thousand Oaks, CA: SAGE Publications.
[44] Ding, Z., Gong, W., Li, S., Wu, Z. (2018). System dynamics versus agent-based modeling: A review of complexity simulation in construction waste management. Sustainability, 10(7): 2484. https://doi.org/10.3390/su10072484
[45] Ajayi, S.O., Oyedele, L.O., Bilal, M., et al. (2015). Waste effectiveness of the construction industry: Understanding the impediments and requisites for improvements. Resources, Conservation and Recycling, 102: 101-112. https://doi.org/10.1016/j.resconrec.2015.06.001
[46] Boiral, O. (2007). Corporate greening through ISO 14001: A rational myth? Organization Science, 18(1): 127-146. https://doi.org/10.1287/orsc.1060.0224
[47] Testa, F., Boiral, O., Iraldo, F. (2018). Internalization of environmental practices and institutional complexity: Can stakeholders pressures encourage greenwashing? Journal of Business Ethics, 147(2): 287-307. https://doi.org/10.1007/s10551-015-2960-2
[48] Poon, C.S., Yu, A.T.W., Ng, L.H. (2001). On-site sorting of construction and demolition waste in Hong Kong. Resources, Conservation and Recycling, 32(2): 157-172. https://doi.org/10.1016/S0921-3449(01)00052-0
[49] Huang, B., Wang, X., Kua, H., Geng, Y., Bleischwitz, R., Ren, J. (2018). Construction and demolition waste management in China through the 3R principle. Resources, Conservation and Recycling, 129: 36-44. https://doi.org/10.1016/j.resconrec.2017.09.029
[50] Esa, M.R., Halog, A., Rigamonti, L. (2017). Strategies for minimizing construction and demolition wastes in Malaysia. Resources, Conservation and Recycling, 120: 219-229. https://doi.org/10.1016/j.resconrec.2016.12.014
[51] Ghisellini, P., Cialani, C., Ulgiati, S. (2016). A review on circular economy: The expected transition to a balanced interplay of environmental and economic systems. Journal of Cleaner Production, 114: 11-32. https://doi.org/10.1016/j.jclepro.2015.09.007
[52] Osmani, M., Glass, J., Price, A.D.F. (2008). Architects' perspectives on construction waste reduction by design. Waste Management, 28(7): 1147-1158. https://doi.org/10.1016/j.wasman.2007.05.011
[53] Liu, Z., Osmani, M., Demian, P., Baldwin, A.N. (2015). A BIM-aided construction waste minimisation framework. Automation in Construction, 59: 1-23. https://doi.org/10.1016/j.autcon.2015.07.020
[54] Nguyen, H., Skitmore, M., Gray, M., Zhang, X., Olanipekun, A.O. (2017). Will green building development take off? An exploratory study of barriers to green building in Vietnam. Resources, Conservation and Recycling, 127: 8-20. https://doi.org/10.1016/j.resconrec.2017.08.012
[55] Begum, R.A., Siwar, C., Pereira, J.J., Jaafar, A.H. (2009). Attitude and behavioral factors in waste management in the construction industry of Malaysia. Resources, Conservation and Recycling, 53(6): 321-328. https://doi.org/10.1016/j.resconrec.2009.01.005
[56] Osmani, M. (2012). Construction waste minimization in the UK: Current pressures for change and approaches. Procedia—Social and Behavioral Sciences, 40: 37-40. https://doi.org/10.1016/j.sbspro.2012.03.158
[57] Gangolells, M., Casals, M., Gassó, S., Forcada, N., Rieradevall, J., Fuertes, A. (2009). A methodology for predicting the severity of environmental impacts related to the construction process of residential buildings. Building and Environment, 44(3): 558-571. https://doi.org/10.1016/j.buildenv.2008.05.001
[58] Tam, V.W.Y., Tam, C.M. (2006). A review on the viable technology for construction waste recycling. Resources, Conservation and Recycling, 47(3): 209-221. https://doi.org/10.1016/j.resconrec.2005.12.002
[59] Lu, W., Yuan, H., Li, J., Hao, J.J.L., Mi, X., Ding, Z. (2011). An empirical investigation of construction and demolition waste generation rates in Shenzhen city, South China. Waste Management, 31(4): 680-687. https://doi.org/10.1016/j.wasman.2010.12.004
[60] Peng, C.L., Scorpio, D.E., Kibert, C.J. (1997). Strategies for successful construction and demolition waste recycling operations. Construction Management and Economics, 15(1): 49-58. https://doi.org/10.1080/014461997373105
[61] Tam, V.W.Y. (2008). On the effectiveness in implementing a waste-management-plan method in construction. Waste Management, 28(6): 1072-1080. https://doi.org/10.1016/j.wasman.2007.04.007
[62] González, V., Echaveguren, T. (2012). Exploring the environmental modeling of road construction operations using discrete-event simulation. Automation in Construction, 24: 100-110. https://doi.org/10.1016/j.autcon.2012.02.011
[63] Lingard, H., Gilbert, G., Graham, P. (2001). Improving solid waste reduction and recycling performance using goal setting and feedback. Construction Management and Economics, 19(8): 809-817. https://doi.org/10.1080/01446190110070952
[64] Kulatunga, U., Amaratunga, D., Haigh, R., Rameezdeen, R. (2006). Attitudes and perceptions of construction workforce on construction waste in Sri Lanka. Management of Environmental Quality: An International Journal, 17(1): 57-72. https://doi.org/10.1108/14777830610639440
[65] Coronado, M., Dosal, E., Coz, A., Viguri, J.R., Andrés, A. (2011). Estimation of construction and demolition waste (C&DW) generation and multicriteria analysis of C&DW management alternatives: A case study in Spain. Waste and Biomass Valorization, 2(2): 209-225. https://doi.org/10.1007/s12649-011-9064-8
[66] Banias, G., Achillas, C., Vlachokostas, C., Moussiopoulos, N., Papaioannou, I. (2011). A web-based decision support system for the optimal management of construction and demolition waste. Waste Management, 31(12): 2497-2502. https://doi.org/10.1016/j.wasman.2011.07.018
[67] Fischer, C., Werge, M. (2009). EU as a recycling society: Present recycling levels of municipal waste and construction & demolition waste in the EU. European Topic Centre on Resource and Waste Management Working Paper 2/2009.
[68] Formoso, C.T., Soibelman, L., De Cesare, C., Isatto, E.L. (2002). Material waste in building industry: Main causes and prevention. Journal of Construction Engineering and Management, 128(4): 316-325. https://doi.org/10.1061/(ASCE)0733-9364(2002)128:4(316)
[69] Koskela, L. (2000). An Exploration Towards a Production Theory and Its Application to Construction. VTT Technical Research Centre of Finland.
[70] Serpell, A., Kort, J., Vera, S. (2013). Awareness, actions, drivers and barriers of sustainable construction in Chile. Technological and Economic Development of Economy, 19(2): 272-288. https://doi.org/10.3846/20294913.2013.798597
[71] Yuan, H. (2013). A SWOT analysis of successful construction waste management. Journal of Cleaner Production, 39: 1-8. https://doi.org/10.1016/j.jclepro.2012.08.016
[72] Llatas, C. (2011). A model for quantifying construction waste in projects according to the European waste list. Waste Management, 31(6): 1261-1276. https://doi.org/10.1016/j.wasman.2011.01.023
[73] Ball, J. (2002). Can ISO 14000 and eco-labelling turn the construction industry green? Building and Environment, 37(4): 421-428. https://doi.org/10.1016/S0360-1323(01)00031-2
[74] Dainty, A.R.J., Brooke, R.J. (2004). Towards improved construction waste minimisation: A need for improved supply chain integration? Structural Survey, 22(1): 20-29. https://doi.org/10.1108/02630800410533285
[75] Teo, M.M.M., Loosemore, M. (2001). A theory of waste behaviour in the construction industry. Construction Management and Economics, 19(7): 741-751. https://doi.org/10.1080/01446190110067037
[76] Shen, L.Y., Tam, V.W.Y., Tam, C.M., Drew, D. (2004). Mapping approach for examining waste management on construction sites. Journal of Construction Engineering and Management, 130(4): 472-481. https://doi.org/10.1061/(ASCE)0733-9364(2004)130:4(472)
[77] McDonald, B., Smith, A. (1995). A proven connection: Performance management and business results. Compensation & Benefits Review, 27(1): 59-64. https://doi.org/10.1177/088636879502700111
[78] Faniran, O.O., Caban, G. (1998). Minimizing waste on construction project sites. Engineering, Construction and Architectural Management, 5(2): 182-188. https://doi.org/10.1108/eb021073
[79] Villoria Saez, P., del Río Merino, M., San-Antonio González, A., Porras-Amores, C. (2013). Best practice measures assessment for construction and demolition waste management in building constructions. Resources, Conservation and Recycling, 75: 52-62. https://doi.org/10.1016/j.resconrec.2013.03.009
[80] Tam, V.W.Y., Shen, L.Y., Tam, C.M. (2007). Assessing the levels of material wastage affected by sub-contracting relationships and projects types with their correlations. Building and Environment, 42(3): 1471-1477. https://doi.org/10.1016/j.buildenv.2005.12.023
[81] Tam, V.W.Y., Lu, W. (2016). Construction waste management profiles, practices, and performance: A cross-jurisdictional analysis in four countries. Sustainability, 8(2): 190. https://doi.org/10.3390/su8020190
[82] Innes, S. (2004). Developing tools for designing out waste pre-site and on-site. In Proceedings of Minimising Construction Waste Conference: Developing Resource Efficiency and Waste Minimisation in Design and Construction, New Civil Engineer, London.
[83] Keys, A., Baldwin, A., Austin, S. (2000). Designing to encourage waste minimisation in the construction industry. In Proceedings of CIBSE National Conference, Dublin, Ireland. https://hdl.handle.net/2134/4945 .
[84] Treloar, G.J., Gupta, H., Love, P.E.D., Nguyen, B. (2003). An analysis of factors influencing waste minimisation and use of recycled materials for the construction of residential buildings. Management of Environmental Quality: An International Journal, 14(1): 134-145. https://doi.org/10.1108/14777830310460432
[85] Cheng, J.C.P., Ma, L.Y.H. (2013). A BIM-based system for demolition and renovation waste estimation and planning. Waste Management, 33(6): 1539-1551. https://doi.org/10.1016/j.wasman.2013.01.001
[86] Hao, J.L., Hill, M.J., Shen, L.Y. (2008). Managing construction waste on-site through system dynamics modelling: The case of Hong Kong. Engineering, Construction and Architectural Management, 15(2): 103-113. https://doi.org/10.1108/09699980810852646
[87] Ekanayake, L.L., Ofori, G. (2004). Building waste assessment score: Design-based tool. Building and Environment, 39(7): 851-861. https://doi.org/10.1016/j.buildenv.2004.01.007
[88] McGrath, C., Anderson, J. (2000). Waste minimisation on construction sites. The Building Economist, September, 29-32. https://www.researchgate.net/publication/288950827_Waste_minimizing_on_a_construction_site.
[89] Skoyles, E.R. (1976). Materials wastage: A misuse of resources. Building Research and Practice, 4(4): 232-243. https://doi.org/10.1080/09613217608550498
[90] Skoyles, E.R., Skoyles, J.R. (1987). Waste Prevention on Site. Mitchell Publishing.
[91] Diekmann, J.E., Krewedl, M., Balonick, J., Stewart, T., Won, S. (2004). Application of Lean Manufacturing Principles to Construction. Report No. 191. Construction Industry Institute, University of Texas at Austin.
[92] Bossink, B.A.G., Brouwers, H.J.H. (1996). Construction waste: Quantification and source evaluation. Journal of Construction Engineering and Management, 122(1): 55-60. https://doi.org/10.1061/(ASCE)0733-9364(1996)122:1(55)
[93] Al-Hajj, A., Hamani, K. (2011). Material waste in the UAE construction industry: Main causes and minimization practices. Architectural Engineering and Design Management, 7(4): 221-235. https://doi.org/10.1080/17452007.2011.594576
[94] Wahab, A.B., Lawal, A.F. (2011). An evaluation of waste control measures in construction industry in Nigeria. African Journal of Environmental Science and Technology, 5(3): 246-254.
[95] Baldwin, A., Poon, C.S., Shen, L.Y., Austin, S., Wong, I. (2009). Designing out waste in high-rise residential buildings: Analysis of precasting methods and traditional construction. Renewable Energy, 34(9): 2067-2073. https://doi.org/10.1016/j.renene.2009.02.008
[96] Bakchan, A., Faust, K.M., Leite, F. (2019). Seven-dimensional automated construction waste quantification and management framework: Integration with project and site planning. Resources, Conservation and Recycling, 146: 462-474. https://doi.org/10.1016/j.resconrec.2019.02.020
[97] Li, J., Ding, Z., Mi, X., Wang, J. (2013). A model for estimating construction waste generation index for building project in China. Resources, Conservation and Recycling, 74: 20-26. https://doi.org/10.1016/j.resconrec.2013.02.015
[98] Guerra, B.C., Leite, F., Faust, K.M. (2020). 4D-BIM to enhance construction waste reuse and recycle planning: Case studies on concrete and drywall waste streams. Waste Management, 116: 79-90. https://doi.org/10.1016/j.wasman.2020.07.035
[99] Kofoworola, O.F., Gheewala, S.H. (2009). Estimation of construction waste generation and management in Thailand. Waste Management, 29(2): 731-738. https://doi.org/10.1016/j.wasman.2008.07.004
[100] Teo, M.M.M., Loosemore, M., Masosszeky, M., Karim, K. (2000). Operatives' attitudes towards waste on a construction project. In Proceedings of the 16th Annual ARCOM Conference, Glasgow, UK. https://doi.org/10.26190/unsworks/13746
[101] Lu, W., Yuan, H. (2011). A framework for understanding waste management studies in construction. Waste Management, 31(6): 1252-1260. https://doi.org/10.1016/j.wasman.2011.01.018
[102] Katz, A., Baum, H. (2011). A novel methodology to estimate the evolution of construction waste in construction sites. Waste Management, 31(2): 353-358. https://doi.org/10.1016/j.wasman.2010.01.008
[103] Shen, L.Y., Tam, V.W.Y. (2002). Implementation of environmental management in the Hong Kong construction industry. International Journal of Project Management, 20(7): 535-543. https://doi.org/10.1016/S0263-7863(01)00054-0