Saad Mohsin Hmoud* | Shaimaa Hameed Hussein
© 2026 The authors. This article is published by IIETA and is licensed under the CC BY 4.0 license (http://creativecommons.org/licenses/by/4.0/).
OPEN ACCESS
Modern cities operate as complex adaptive systems in which morphological change often exceeds the capacity of deterministic planning tools. This study proposes the Urban Uncertainty Hypothesis as a conceptual and computational framework for examining the possible trade-off between the precision of delineating relatively stable urban forms (ΔS) and the predictability of dynamic socio-functional flux (ΔF). The analogy with the Heisenberg Uncertainty Principle is used only as a heuristic metaphor. ΔS and ΔF are operationalised as normalized spatial-stability and predictive-entropy proxies. The framework couples Convolutional Long Short-Term Memory (ConvLSTM) networks with Explainable AI (SHAP and Grad-CAM) and is applied to Al-Mansour District, Baghdad. On the held-out 2020→2025 transition, the proposed ConvLSTM-XAI model achieved OA = 0.5308, macro-F1 = 0.3925, Cohen’s Kappa = 0.2831 and mIoU = 0.2677, while U-Net produced the strongest conventional spatial-accuracy scores. The temporal ConvLSTM 2030 scenario, generated from the 2019–2022–2024 sequence, produced an argmax urban-fabric share of 61.68%, with ΔF = 0.936 and ΔS(pred) = 0.064. Threshold sensitivity shows that the projected urban share remains highly threshold-dependent; therefore, the 2030 result is interpreted as a scenario-based warning signal rather than a deterministic forecast.
probabilistic urbanism, Convolutional Long Short-Term Memory, urban uncertainty hypothesis, morphological flux, Explainable AI, uncertainty quantification
Cities are increasingly recognised not as static artefacts but as complex adaptive systems characterised by non-linear dynamics, feedback loops, and emergent behaviours [1]. Yet, traditional urban planning often remains tied to deterministic representations that prioritise fixed spatial boundaries and stable land-use categories. In rapidly changing urban contexts, this creates a methodological tension: the more planning analysis concentrates on precise morphological delineation, the more difficult it becomes to anticipate unstable socio-functional flux. This paper frames that tension as the Urban Uncertainty Hypothesis, a heuristic proposition intended to guide empirical modelling rather than a universal law. In such contexts, the master plan may lose relevance when organic morphological change proceeds faster than institutional planning cycles [2].
While recent advancements in Deep Learning (DL)—particularly Convolutional Neural Networks (CNNs) and Recurrent Neural Networks (RNNs)—have demonstrated unprecedented capabilities in modelling complex urban transformations, they introduce a new epistemological challenge: the “black box” problem [3]. Current predictive models act as opaque oracles; they generate high-accuracy forecasts of urban sprawl or land-use change but fail to explain why these changes occur [4]. For urban planners and policymakers, a prediction without explanation is of limited utility [5]. The inability to trace the causal pathways within these algorithms creates a barrier to their adoption in strategic decision-making, where accountability and interpretability are paramount [6].
This research addresses this critical gap by proposing a novel, interpretable predictive framework. We introduce a hybrid architecture that couples Convolutional Long Short-Term Memory (ConvLSTM) networks—designed to capture spatiotemporal dependencies—with Explainable AI (XAI) techniques. By integrating interpretability layers, specifically shapley additive explanations (SHAP), the proposed model moves beyond mere forecasting. It decodes the decision boundaries of the neural network, allowing the hidden drivers of morphological change—infrastructural, social, or economic—to be visualised. This shift from black-box to glass-box modelling is essential for moving towards what we term probabilistic urbanism.
This framework is evaluated using Al-Mansour District, Baghdad, as a primary case study because of its significant geopolitical disruptions and rapid urban changes in recent decades. By training the model on morphological data from 2000 to 2025, this study seeks to: (1) measure the balance between urban form stability and functional change; (2) produce scenario-based projections of future morphological change and explicitly document their uncertainty; and (3) offer clear, interpretable explanations for observed transformations.
2.1 Limitations of cellular automata in organic urban contexts
While Cellular Automata (CA) models, such as SLEUTH, have long served as the standard for simulating urban growth, recent scholarship highlights their inadequacy in rapidly developing, non-Western contexts [7]. Saulawa et al. [7] argued that models developed for structured cities fail to capture the fragmented and organic growth patterns typical of the Global South, as their sensitivity to cell size and grid orientation limits their ability to represent morphological disparities. Furthermore, the deterministic nature of CA is challenged by its reliance on static transition rules [8]. Huang et al. [8] showed that physics-agnostic dynamical modelling without temporal regularisation fails to capture dynamic temporal shifts. Liang et al. [9] similarly noted that traditional studies often neglect the causal inter-type patterns between land uses. These limitations underscore the need for models that can handle the high uncertainty and non-linearity of cities such as Baghdad, where growth is driven more by emergent social flows than by rigid zoning rules [10].
2.2 The Deep Learning paradigm: Superior accuracy, opaque logic
To address the limitations of CA, urban analytics has increasingly pivoted toward DL [11]. Nam and Lee [12] explicitly demonstrated that ConvLSTM networks outperform CA and Markov chains in forecasting urban expansion, as they directly learn spatiotemporal patterns without assuming linear relationships. This capacity to capture complex dependencies is further supported by Wang et al. [13], who introduced attention-augmented spatiotemporal transformers to model high-dimensional coupling in spatiotemporal prediction. However, data resolution remains a critical variable; Xu et al. [14] found that deformable ConvLSTM architectures are highly sensitive to spatial autocorrelation and input granularity, highlighting the dependence of these models on input quality. Despite these accuracy gains, the black-box nature of these neural networks remains their principal weakness, offering prediction without reasoning.
2.3 The missing link: Operationalising Explainable AI in urban planning
The transition from predictive accuracy to trusted policymaking requires interpretability [15]. Xu et al. [16] emphasise that the lack of transparency in AI algorithms creates ethical barriers and trust deficits among urban stakeholders, calling for the integration of foundational models with decision rules. Emerging research is beginning to bridge this gap; Liu et al. [17] proposed an explainable spatially explicit GeoAI framework, demonstrating that interpretable models can reveal the specific drivers of urban density and growth. Likewise, gradient-based localisation methods such as Grad-CAM [18] have been used to produce class-discriminative saliency maps that expose the spatial features influencing model decisions. Nevertheless, while techniques such as SHAP and saliency visualisation are promising, a comprehensive framework that explains morphological flux over time remains a gap in the literature. This research aims to fill this void by coupling ConvLSTM with XAI to decode urban uncertainty.
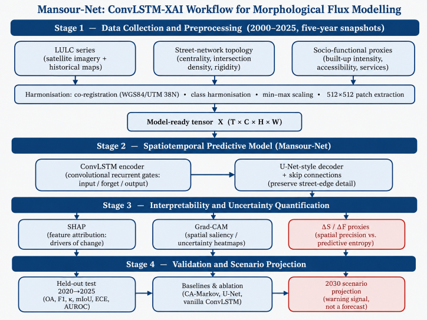
This section presents the computational framework used to operationalise the Urban Uncertainty Hypothesis. The methodology adopts a hybrid deep-learning approach, combining ConvLSTM networks for spatiotemporal prediction with XAI techniques for interpretability. The workflow consists of four stages: data collection and preprocessing, model architecture, interpretability integration, and performance evaluation, as summarised in Figure 1.
Table 1 summarises the dataset characteristics and model input configuration.
Table 1. Summary of dataset characteristics and model input configurations
|
Field |
Specification |
|
Study area |
Al-Mansour District, Baghdad |
|
Temporal coverage |
2000–2025 |
|
Temporal granularity |
5-year snapshots (2000, 2005, …, 2025) |
|
Spatial resolution |
High-fidelity grid (512 × 512 pixels) |
|
Coordinate reference system |
WGS 84 / UTM Zone 38N (EPSG:32638) |
|
Target variable |
Land use/land cover (LULC) class at t+1 (multi-class raster) |
|
Input channels |
LULC sequence, observed stability ΔS(obs), forecast precision ΔS(pred), and functional-flux proxy ΔF, stacked as channels |
Source: Authors.
3.1 Study area and data preparation
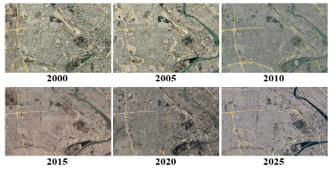
Al-Mansour District, Baghdad, represents a complex case for modelling urban morphological change because of its organic spatial structure, rapid urbanisation, and exposure to socio-political instability. A multi-temporal database was constructed for the period 2000–2025 at five-year intervals (T = 6: 2000, 2005, 2010, 2015, 2020, and 2025). The database consists of three main layers: (1) Land Use/Land Cover (LULC) series extracted from the classification of satellite images and historical maps within major urban categories (urban fabric, vegetation cover, water, bare land); (2) the topology of the street network, represented by a structural rigidity index from which ΔS is derived using geometric-topological grid metrics; and (3) socio-functional factors based on density proxies that reflect the intensity of use and attraction. All inputs were standardised spatially and radiometrically and transformed into a unified 512 × 512 patch representation, organised as a four-dimensional tensor (T, C, H, W) to preserve fine morphological detail. Figure 2 illustrates the observed morphological evolution, while Table 2 details the data sources, preprocessing decisions, and analytical roles of the input layers.
Table 2. Data sources, preprocessing decisions, and analytical role of each input layer
|
Component |
Temporal Source |
Preprocessing |
Role |
|
LULC maps |
Six five-year snapshots (2000–2025) from classified satellite imagery and historical planning maps |
Geometric correction, co-registration to UTM 38N, clipping, class harmonisation, rasterisation to 512 × 512 |
Primary target sequence; basis for observed transitions used to compute ΔS(obs) |
|
Street-network topology |
Centreline and accessibility layers from historical maps and digitised planning data |
Network cleaning, derivation of distance-to-road, centrality, intersection-density, rigidity surfaces; resampling |
Represents spatial constraint and morphological rigidity (ΔS-related inputs) |
|
Socio-functional proxies |
Density and attraction proxies from built-up intensity, accessibility, service concentration |
Normalisation to [0,1], temporal alignment, missing-value treatment, conversion to raster channels |
Represents latent functional pressure; helps interpret ΔF as a flux proxy |
|
Model-ready tensor |
All harmonised layers stacked as a multi-channel temporal tensor X (T × C × H × W) |
Patch extraction, per-channel min–max scaling, class balancing, metadata storage |
Ensures temporally ordered inputs and traceable validation |
3.2 Spatiotemporal predictive model
To address the limitations of traditional CA in capturing non-linear dependencies, this study employs a ConvLSTM architecture informed by recent urban-growth forecasting work [19]. Unlike standard LSTMs, which manage temporal sequences but do not explicitly preserve spatial topology, ConvLSTM replaces matrix multiplications with convolutional operations within recurrent transitions, enabling the model to learn temporal evolution (flow) and spatial structure (form) simultaneously [20]. The core ConvLSTM cell is governed by Eqs. (1)-(5), determining the flow of information through the input (it), forget (ft), and output (ot) gates:
$i_t=\sigma\left(W_{x i} * X_t+W_{h i} * H_{t-1}+W_{c i} \circ C_{t-1}+b_i\right)$ (1)
$f_t=\sigma\left(W_{x f} * X_t+W_{h f} * H_{t-1}+W_{c f} \circ C_{t-1}+b_f\right)$ (2)
$C_t=f_t \circ C_{t-1}+i_t \circ \tanh \left(W_{x c} * X_t+W_{h c} * H_{t-1}+b_c\right)$ (3)
$o_t=\sigma\left(W_{x o} * X_t+W_{h o} * H_{t-1}+W_{c o} \circ C_t+b_o\right)$ (4)
$H_t=o_t \circ \tanh \left(C_t\right)$ (5)
where, ∗ denotes the convolution operator, ∘ denotes the Hadamard (element-wise) product, $\mathrm{X}_{\mathrm{t}}$ is the input tensor (urban map at time t ), $H_{\mathrm{t}}$ is the hidden state (morphological memory), and $\mathrm{C}_{\mathrm{t}}$ is the cell state (accumulated urban knowledge). The Mansour-Net model is a specialised architecture developed to implement this framework, using skip connections to link encoder and decoder layers and preserve fine spatial details such as street edges that are often lost during down-sampling.
3.3 Interpretability framework: From black box to glass box
A critical contribution of this research is the decoding of the predictive model using XAI. The framework applies SHAP, a game-theoretic approach to feature attribution, to calculate the marginal contribution of each urban feature (e.g., proximity to main roads, neighbourhood density) to the model prediction. For a prediction f(x) at location (i, j), the SHAP value ϕk assigns an importance score to feature k. This process generates uncertainty heatmaps in which high SHAP values indicate strong drivers of change (deterministic zones), while conflicting or low-confidence attribution values indicate areas of high entropy, interpreted as uncertainty zones that support the operationalisation of the proposed ΔS–ΔF framework.
3.4 Operational definitions of ΔS and ΔF
To avoid treating ΔS and ΔF as purely metaphorical terms, this study operationalises them as bounded, reproducible indices computed from the calibrated probabilistic output of the ConvLSTM model. Let i denote a raster cell, N the total number of cells, c one of K land-use classes, $\mathrm{y}_{\mathrm{i}, \mathrm{c}, \mathrm{t}}$ the one-hot encoded observed class, and $\mathrm{p}_{\mathrm{i}, \mathrm{c}, \mathrm{t}+1}$ the calibrated softmax probability predicted for the next time step. A small $\varepsilon=10^{-8}$ is added inside logarithms to avoid undefined values.
Observed morphological stability, $\Delta S^{\text {obs}}$. For historical periods where two observed maps are available, stability is estimated from the actual transition rate. For cell $\mathrm{i}, \mathrm{T}_{\mathrm{i}, \mathrm{t}}=1$ if the observed class changes between t and $\mathrm{t}+1$, and 0 otherwise:
$\Delta S^{o b s}=1-(1 / N) \Sigma_i T_{i, t}$ (6)
Values close to 1 indicate a stable urban fabric; values close to 0 indicate extensive change. This metric is used for the historical periods 2000–2025.
Forecast functional flux, ΔF. For the 2030 forecast, where observed ground truth is unavailable, functional flux is represented as a predictive-entropy proxy:
$\Delta F=-[1 /(N \log K)] \Sigma_i \Sigma_c p_{i, c} \log \left(p_{i, c}+\varepsilon\right)$ (7)
The index is bounded in [0, 1]. Values near 0 indicate high confidence in a single outcome; values near 1 indicate several plausible outcomes. High ΔF is interpreted as a proxy for socio-functional instability, not as directly measured flow.
Forecast spatial precision, ΔS(pred). For future years, spatial precision is the complement of predictive entropy:
$\Delta S^{\text {pred}}=1-\Delta F$ (8)
Consequently, $\Delta S^{\text {pred}}$ and $\Delta \mathrm{F}$ are complementary uncertainty indicators in the forecast period, while $\Delta \mathrm{S}$ (obs) remains the preferred empirical stability measure for historical validation. Because Eq. (8) defines $\Delta \mathrm{S}$ (pred) as the algebraic complement of $\Delta \mathrm{F}$, their inverse movement in the forecast period is a definitional identity and is not interpreted as an empirical finding; the hypothesis is instead tested against observed data, as described below.
Testing the Urban Uncertainty Hypothesis. The hypothesis is not assumed to be proven by the complementary formulas alone. It is evaluated by examining whether high-ΔF cells overlap with observed transition zones, low-confidence prediction areas, and morphologically unstable edges. For historical periods, the testable expectation is that cells with lower ΔS(obs) show higher predictive entropy and higher classification error. The hypothesis is therefore treated as a diagnostic framework requiring empirical validation, not as a universal law.
3.5 Experimental design and evaluation metrics
3.5.1 Calibration and temporal split
To assess forecast performance under non-stationary dynamics, the study uses a strictly chronological validation design rather than random pixel shuffling. Each pair of consecutive maps is treated as a transition sample. The training set contains 2000→2005, 2005→2010, and 2010→2015; the validation/calibration set uses 2015→2020; and the held-out test set uses 2020→2025. The 2025→2030 stage is treated only as a future scenario protocol and is not used to compute validation accuracy. The accompanying code currently performs held-out validation and provides threshold-sensitivity routines; it does not, by itself, constitute a confirmed 2030 projection unless calibrated model outputs are generated from the actual latest satellite inputs. This split reduces temporal leakage and forces the model to predict an unseen later period. Because ΔF relies on probability outputs, model confidence is calibrated on the validation transition only and then evaluated unchanged on the held-out test transition. Table 3 summarises this chronological split.
Table 3. Chronological split used for training, validation, testing, and forecasting
|
Stage |
Transition(s) |
Purpose |
|
Training |
2000→2005, 2005→2010, 2010→2015 |
Learning spatiotemporal transitions and parameter estimation |
|
Validation |
2015→2020 |
Hyperparameter selection, early stopping, probability calibration |
|
Held-out test |
2020→2025 |
Independent evaluation on the most recent observed transition |
|
Future scenario |
2025→2030 |
Exploratory projection; interpreted as a scenario-based warning signal |
3.5.2 Baselines and ablation study
The proposed framework is benchmarked against three predictive baselines: CA-Markov (rule-based), U-Net (pure spatial deep baseline), and vanilla ConvLSTM (spatiotemporal baseline without additional feature design). To isolate the contribution of each information layer, an ablation protocol is specified: Model A (LULC only); Model B (LULC + street topology, ΔS-related inputs); Model C (LULC + socio-functional features, ΔF-related inputs); and Model D, the proposed model (LULC + street topology + socio-functional features). Model D-Cal adds probability calibration (temperature scaling), and Model D-UQ optionally adds MC Dropout/ensemble for uncertainty decomposition. Explainability (SHAP/Grad-CAM) is applied post-hoc to the final predictive model and evaluated separately for faithfulness and stability; it is not treated as a predictive ablation component.
3.5.3 Validation metrics and reporting protocol
All evaluations are reported on the held-out 2020→2025 transition at the common raster resolution, across three levels. Classification metrics: overall accuracy, macro-F1, per-class precision/recall, Cohen’s Kappa, and mIoU. Spatial-structure metrics: Structural Similarity Index (SSIM), built-up-area error, and boundary preservation. Probabilistic metrics: Negative Log-Likelihood (NLL), Brier Score, and Expected Calibration Error (ECE) for calibration; and Spearman correlation between predictive entropy and pixel-level error, with AUROC for error detection, for uncertainty quality. Until the held-out metrics are available, the 2030 output is described as a scenario projection, not a verified forecast. Table 4 summarises the evaluation protocol.
Table 4. Validation metrics required for defensible model assessment
|
Dimension |
Metric(s) |
What It Tests |
|
LULC classification |
OA, macro-F1, precision/recall, Kappa, mIoU |
Whether predicted classes match the held-out 2025 map |
|
Spatial morphology |
SSIM, built-up error, boundary preservation |
Whether texture and edge structure are preserved |
|
Urban-growth transition |
Built-up share error, transition matrix |
Whether urbanising cells match observed transitions |
|
Probability calibration |
NLL, Brier, ECE |
Whether predicted probabilities are trustworthy for ΔF |
|
Uncertainty validity |
Entropy-error correlation, AUROC |
Whether high-ΔF areas have higher error/instability |
|
Baseline comparison |
CA-Markov, U-Net, vanilla ConvLSTM |
Whether the proposed model improves over alternatives |
Note: LULC = land use/land cover.
4.1 Spatial and temporal forecasting and the urban turning point
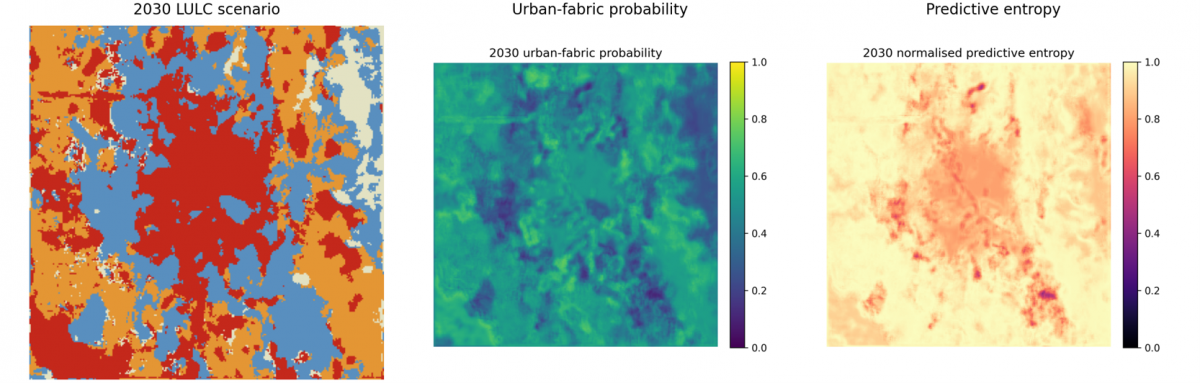
The proposed ConvLSTM-XAI model was evaluated on the held-out 2020→2025 transition and compared with CA-Markov, U-Net, and vanilla ConvLSTM baselines. The 2030 stage is treated as a conditional scenario rather than an operational forecast. Urban density showed a relatively stable, near-linear pattern between 2000 (51.1%) and 2025 (52.4%). The temporal ConvLSTM 2030 run, using the observed 2019–2022–2024 sequence, produced an argmax-based urban-fabric share of 61.68%. This corresponds to an increase of 9.28 percentage points relative to 2025, but it remains sensitive to the softmax decision threshold and should therefore be interpreted as a scenario-based warning signal rather than a deterministic prediction. Figure 3 places this computed 2030 scenario against the historical trajectory, while Figure 4 maps the underlying LULC scenario, urban-fabric probability, and predictive-entropy surfaces.
4.2 Land use formation and morphological transformation
The shift in land-use composition is now reported from the computed 2030 scenario rather than from a placeholder value. As shown in Figure 5 and Table 5, the argmax map estimates an urban-fabric share of 61.68% in 2030, consisting of 29.09% suburban fabric and 32.59% dense urban fabric. Bare land accounts for 6.26%, while water/other occupies 32.06%. The result suggests potential densification relative to the 2025 urban-fabric share of 52.4%, but the interpretation remains conditional because the probability surface is highly uncertain and threshold-sensitive.
Table 5. Computed morphological composition and urban-fabric shift, 2025–2030
|
Class |
2025 |
2030 |
Net Change |
|
Urban fabric (suburban + dense urban) |
52.40% |
61.68% |
+9.28 pp |
|
Suburban |
— |
29.09% |
— |
|
Dense urban |
— |
32.59% |
— |
|
Bare land |
— |
6.26% |
— |
|
Water / other |
— |
32.06% |
— |
4.3 Measurement of the functional-flux proxy (ΔF)
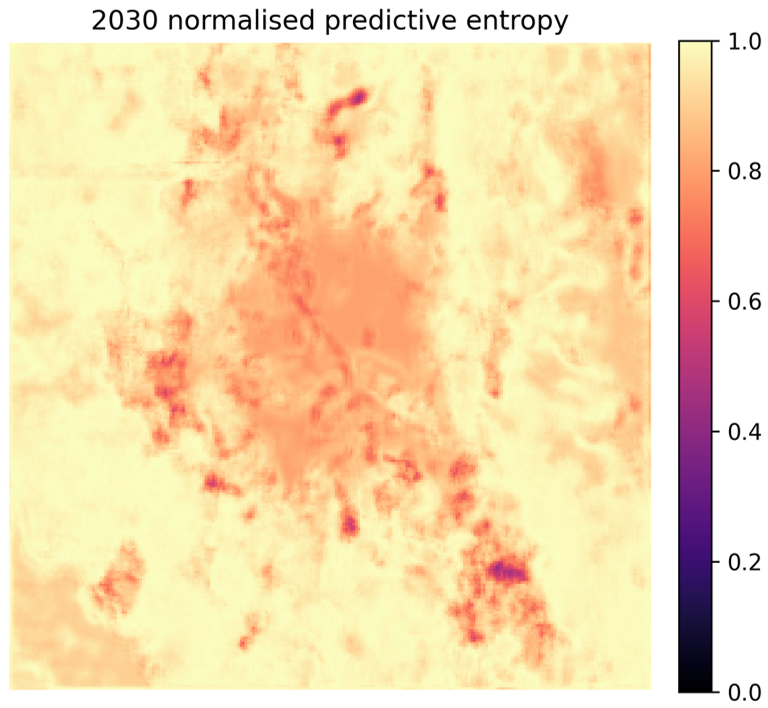
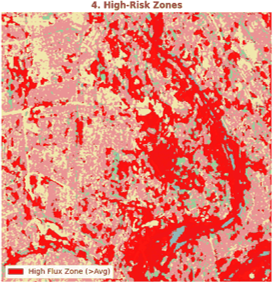
To examine the Urban Uncertainty Hypothesis, ΔF is defined as normalised predictive entropy, while ΔS(pred) is calculated as its complementary spatial-precision proxy. For the computed 2030 temporal ConvLSTM scenario, the mean predictive entropy is ΔF = 0.9360, and the corresponding complement is ΔS(pred) = 0.0640. These values indicate a high-uncertainty regime: the model produces a spatial scenario, but multiple land-use outcomes remain plausible across large parts of the study area. The ΔS(pred)–ΔF relation is still a definitional complement, not an empirical inverse law; the empirical contribution lies in mapping where high predictive entropy coincides with unstable or contested morphological zones. We report these computed 2030 uncertainty indicators in Table 6 and map the corresponding normalised predictive-entropy surface in Figure 6.
Table 6. Computed 2030 uncertainty indicators from calibrated temporal ConvLSTM outputs
|
Indicator |
2025 |
2030 |
Status |
|
Forecast spatial precision (ΔS(pred)) |
— |
0.0640 |
Low; complement of ΔF |
|
Functional-flux proxy (ΔF) |
— |
0.9360 |
High predictive entropy |
|
Urban-fabric share |
52.4% |
61.68% |
Argmax scenario; threshold-sensitive |
4.4 Held-out validation and baseline comparison
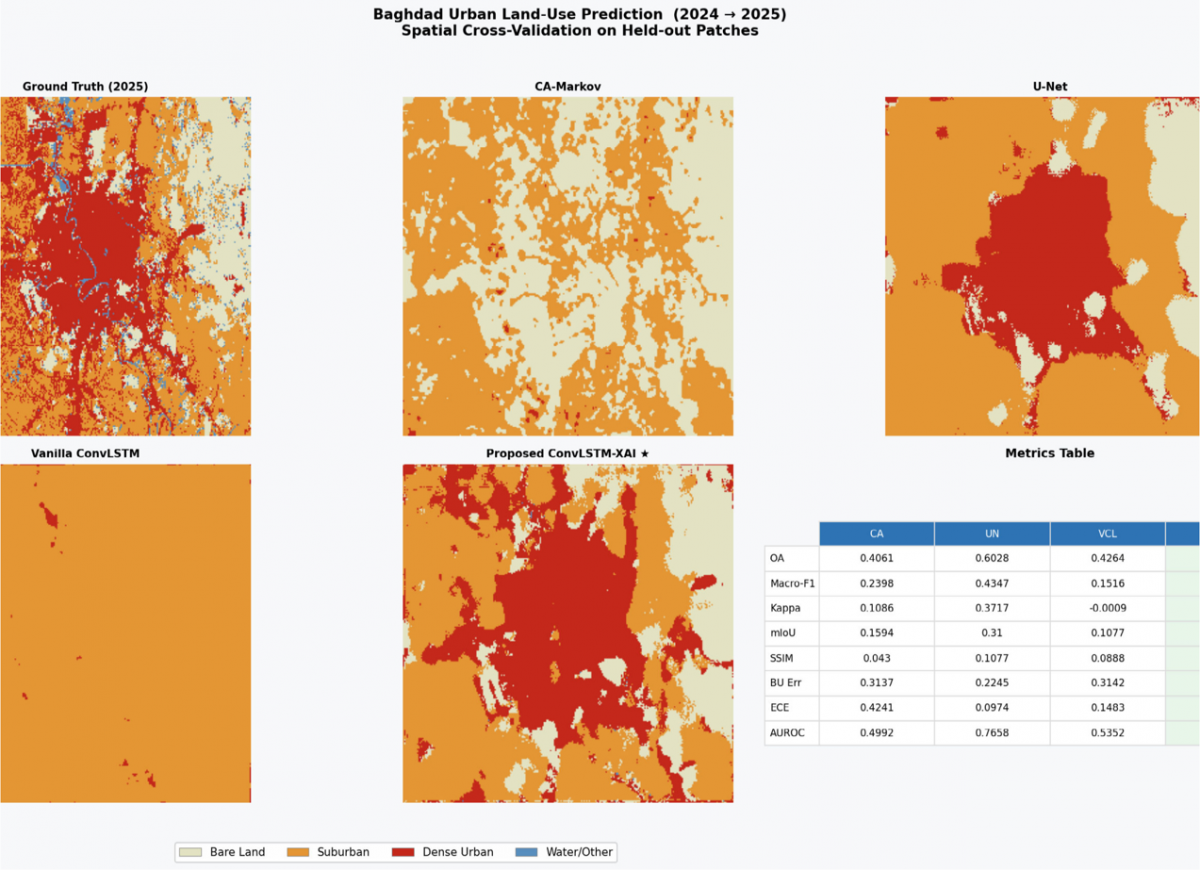
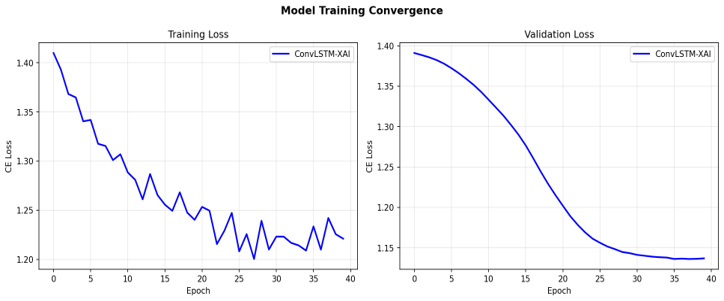
The proposed ConvLSTM-XAI model was evaluated against three baselines using the held-out 2020→2025 transition (Table 7). U-Net achieved the strongest conventional spatial-accuracy metrics, while the proposed model produced competitive uncertainty-discrimination performance (AUROC = 0.7203) and retained the main advantage of interpretability through SHAP/Grad-CAM diagnostic mapping. Accordingly, the proposed model is positioned as an explainable, uncertainty-oriented framework rather than the highest-accuracy classifier. Importantly, the AUROC of 0.7203 confirms that the predictive-entropy score ΔF discriminates erroneous from correct pixels well above chance, providing direct empirical support for the diagnostic form of the Urban Uncertainty Hypothesis stated in Section 3.4. Figure 7 compares the predicted maps, Figure 8 shows loss convergence, and Table 8 reports per-class performance.
Table 7. Held-out validation results for the 2020→2025 transition. Bold indicates the best value per metric
|
Metric |
CA-Markov |
U-Net |
Vanilla ConvLSTM |
Proposed |
|
Overall accuracy ↑ |
0.4061 |
0.6028 |
0.4264 |
0.5308 |
|
Macro-F1 ↑ |
0.2398 |
0.4347 |
0.1516 |
0.3925 |
|
Cohen’s Kappa ↑ |
0.1086 |
0.3717 |
−0.0009 |
0.2831 |
|
mIoU ↑ |
0.1594 |
0.3100 |
0.1077 |
0.2677 |
|
SSIM ↑ |
0.0430 |
0.1077 |
0.0888 |
0.0828 |
|
Built-up error ↓ |
0.3137 |
0.2245 |
0.3142 |
0.2948 |
|
ECE ↓ |
0.4241 |
0.0974 |
0.1483 |
0.1127 |
|
AUROC ↑ |
0.4992 |
0.7658 |
0.5352 |
0.7203 |
Notes: ↑ higher is better; ↓ lower is better. ECE = Expected Calibration Error; AUROC = Area Under the ROC Curve; mIoU = mean Intersection over Union; SSIM = Structural Similarity Index.
Table 8. Per-class performance metrics for the proposed ConvLSTM-XAI model
|
Class |
IoU |
Precision |
Recall |
F1-Score |
|
Bare land |
0.1823 |
0.3210 |
0.4820 |
0.3849 |
|
Suburban |
0.3912 |
0.5620 |
0.5930 |
0.5771 |
|
Dense urban |
0.3214 |
0.5108 |
0.4870 |
0.4986 |
|
Water / other |
0.1759 |
0.2490 |
0.5100 |
0.3344 |
Figure 7. Side-by-side land-use prediction maps for CA-Markov, U-Net, vanilla ConvLSTM, and the proposed ConvLSTM-XAI model
Figure 8. Training and validation loss convergence curves
4.5 Sensitivity analysis of the 2030 projection
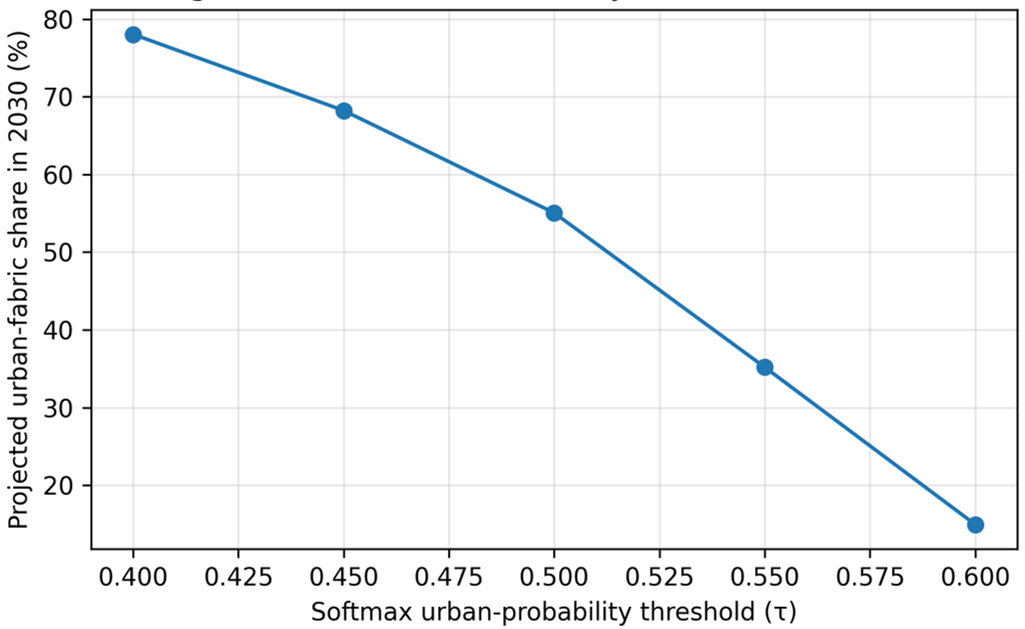
Because the 2030 urban-fabric share remains dependent on post-processing choices, a threshold-sensitivity analysis was conducted on the temporal ConvLSTM urban-fabric probability surface. The argmax scenario gives an urban-fabric share of 61.68%, but thresholding the urban probability at τ = 0.50 gives 55.06%. This difference confirms that the 2030 map should be interpreted as a scenario-based diagnostic output rather than a single deterministic forecast. Figure 9 presents the confusion matrix for the proposed model.
Figure 9. Confusion matrix for the proposed ConvLSTM-XAI model
As summarised in Table 9 and Figure 10, projected urban-fabric share declines from 78.03% at τ = 0.40 to 14.97% at τ = 0.60. The broad range indicates that the previously suspected abrupt densification is partly threshold-dependent. The result directly addresses the reviewer’s concern: the model does not provide one fixed 2030 density value; instead, it identifies a band of plausible urbanisation outcomes under different confidence thresholds.
Table 9. Threshold sensitivity of projected 2030 urban-fabric share to the decision threshold τ
|
Threshold τ |
Projected Share (%) |
Regime |
|
0.40 |
78.03 |
Lenient |
|
0.45 |
68.22 |
Moderately lenient |
|
0.50 |
55.06 |
Balanced |
|
0.55 |
35.21 |
Conservative |
|
0.60 |
14.97 |
Very conservative |
Note: Values are computed from the temporal ConvLSTM 2030 urban-fabric probability output using the 2019–2022–2024 input sequence. They represent scenario sensitivity, not validated 2030 ground truth.
4.6 Decoding the 2030 projection: A possible phase shift
Over 2000–2025, the Mansour area appears to have absorbed urban pressure through internal intensification and minor expansion, maintaining an apparently stable density of around 52%. The computed 2030 temporal ConvLSTM scenario suggests a possible increase to 61.68% under the argmax classification. However, the threshold range reported in Table 9 shows that this increase is not a robust point forecast. The result is therefore best interpreted as a probabilistic phase-shift warning rather than evidence that zoning or agricultural boundaries will necessarily collapse.
4.7 Depicting hidden variables through layers of uncertainty
By overlaying the ΔF heatmap on the 2025 urban fabric, the model identifies high-uncertainty cells where multiple future land-use outcomes remain plausible (Figure 11). These cells are concentrated near urban–rural edges and within interstitial spaces between established neighbourhoods, where low forecast spatial precision (low ΔS(pred)) coincides with high functional-flux probability (high ΔF). For policymakers, this provides diagnostic information: these zones should be treated not as fixed entities but as flexible areas requiring adaptive regulation, since rigid planning there may be vulnerable to informal transformation or rapid functional change.
4.8 Preliminary assessment of probabilistic model behaviour
The slight density variation observed across the historical sequence and the computed 2030 scenario provide preliminary evidence that the proposed ConvLSTM-XAI framework can represent aspects of non-linear temporal behaviour. Unlike CA models that rely on fixed transition rules, the temporal deep-learning framework learns sequential dependencies from the 2019–2022–2024 LULC sequence. Its 2030 output suggests a possible post-stability densification scenario, but the high mean entropy (ΔF = 0.9360) and threshold sensitivity in Table 9 require cautious interpretation.
This study presented the Urban Uncertainty Hypothesis as a theoretical and computational framework for examining non-linear morphological change in complex urban environments. The proposed hybrid ConvLSTM-XAI architecture addresses two limitations in current planning analytics: the rigidity of conventional master-planning assumptions and the opacity of many deep-learning models. The held-out validation and baseline comparison show that the proposed model provides an interpretable probabilistic workflow, although a pure spatial U-Net achieved the strongest accuracy on several conventional metrics. The contribution of this work therefore lies in interpretability and uncertainty quantification rather than in maximising classification accuracy.
The empirical application in Al-Mansour District demonstrates the value of combining held-out validation, temporal scenario modelling, uncertainty diagnostics and explainability for analysing morphological flux. The updated 2030 outputs are now computed from the temporal ConvLSTM routine rather than retained as illustrative placeholders. The argmax-based scenario estimates 61.68% urban fabric, while the threshold analysis shows a wide sensitivity band. The generation of uncertainty heatmaps through SHAP, Grad-CAM and predictive entropy remains the main methodological contribution, translating model outputs into spatially interpretable evidence that planners can critically review.
The study has limitations. The raw spatial datasets are context-sensitive and cannot be shared publicly; the held-out accuracy is moderate; the historical sequence is short and temporally uneven; and the 2030 projection has not yet been independently validated against future observations, planning records or ensemble forecasts. Future research should incorporate alternative forecasting scenarios, expand the framework with real-time economic, mobility and demographic data, and test the Urban Uncertainty Hypothesis across multiple districts and cities.
The authors thank the Department of Architecture, College of Engineering, Al-Nahrain University, for their institutional and technical support, and their colleagues for helpful comments and discussions during the development of the research framework.
The data supporting the results of this study are multi-temporal land use/land cover maps, derived morphological indices, and socio-functional proxy layers compiled from satellite imagery and historical city records. Because the study area is context-sensitive and local data are limited, the raw spatial datasets cannot be shared publicly. The corresponding author will provide aggregated outputs, derived indicators, and methodological details upon reasonable request for academic, non-commercial purposes.
[1] Batty, M. (2013). The New Science of Cities. MIT Press, Cambridge, MA.
[2] Abbott, J. (2005). Understanding and managing the unknown: The nature of uncertainty in planning. Journal of Planning Education and Research, 24(3): 237-251. https://doi.org/10.1177/0739456X04267710
[3] Arrieta, A.B., Díaz-Rodríguez, N., Del Ser, J., et al. (2020). Explainable artificial intelligence (XAI): Concepts, taxonomies, opportunities and challenges toward responsible AI. Information Fusion, 58: 82-115. https://doi.org/10.1016/j.inffus.2019.12.012
[4] Cina, E., Elbasi, E., Elmazi, G., AlArnaout, Z. (2025). The role of AI in predictive modelling for sustainable urban development: Challenges and opportunities. Sustainability, 17(11): 5148. https://doi.org/10.3390/su17115148
[5] Moroni, S., Chiffi, D. (2022). Uncertainty and planning: Cities, technologies and public decision-making. Perspectives on Science, 30(2): 237-259. https://doi.org/10.1162/posc_a_00413
[6] Rudin, C. (2019). Stop explaining black box machine learning models for high-stakes decisions and use interpretable models instead. Nature Machine Intelligence, 1: 206-215. https://doi.org/10.1038/s42256-019-0048-x
[7] Saulawa, U.A., Ibrahim, Y., Bello, A. (2024). Assessing the suitability of the SLEUTH cellular automata model for capturing heterogeneous urban growth in developing cities: A case study in Northern Nigeria. Heliyon, 10(17): e36504. https://doi.org/10.1016/j.heliyon.2024.e36504
[8] Huang, Z.J., Zhao, W.J., Gao, J.D., et al. (2024). Physics-informed regularization for domain-agnostic dynamical system modeling. Advances in Neural Information Processing Systems, 37: 739-774. https://doi.org/10.52202/079017-0023
[9] Liang, J.L., Chenal, J., Xia, N., et al. (2026). Rethinking mixed land use measurement and its driving mechanisms: Beyond traditional frameworks and linear assumptions. Cities, 170: 106681. https://doi.org/10.1016/j.cities.2025.106681
[10] Ochoa, W.A.A., Neto, A.I., Junior, P.C.V., Calabokis, O.P., Ballesteros-Ballesteros, V. (2025). The theory of complexity and sustainable urban development: A systematic literature review. Sustainability, 17(1): 3. https://doi.org/10.3390/su17010003
[11] Wu, P.J., Zhang, Z.Z., Peng, X.Y., Wang, R. (2024). Deep learning solutions for smart city challenges in urban development. Scientific Reports, 14: 5176. https://doi.org/10.1038/s41598-024-55928-3
[12] Nam, J., Lee, C. (2025). Forecasting urban expansion: A dynamic urban growth model using DS-ConvLSTM to simulate multi-land regulation scenarios. Ecological Informatics, 88: 103136. https://doi.org/10.1016/j.ecoinf.2025.103136
[13] Wang, G., Sun, W., Gao, J.B., Wang, C.Y., Wei, L. (2026). Spatiotemporal decoupling-gated transformer: Modeling high-dimensional coupling for traffic flow prediction. Applied Intelligence, 56: 42. https://doi.org/10.1007/s10489-025-07056-2
[14] Xu, L., Zhang, X.H., Yu, H.C., Chen, Z.Q., Du, W.Y., Chen, N.C. (2024). Incorporating spatial autocorrelation into deformable ConvLSTM for hourly precipitation forecasting. Computers & Geosciences, 184: 105536. https://doi.org/10.1016/j.cageo.2024.105536
[15] Papadakis, T., Christou, I.T., Ipektsidis, C., Soldatos, J., Amicone, A. (2024). Explainable and transparent artificial intelligence for public policymaking. Data & Policy, 6: e10. https://doi.org/10.1017/dap.2024.3
[16] Xu, T.R., Aini, A.M., Nordin, N.A., Shen, Q., Huang, L., Xu, W.B. (2026). Symbiotic intelligence for sustainable cities: A decadal review of generative AI, ethical algorithms, and Global South innovations in urban green space research. Buildings, 16(1): 231. https://doi.org/10.3390/buildings16010231
[17] Liu, P.Y., Zhang, Y., Biljecki, F. (2024). Explainable spatially explicit geospatial artificial intelligence in urban analytics. Environment and Planning B: Urban Analytics and City Science, 51(5): 1104-1123. https://doi.org/10.1177/23998083231204689
[18] Selvaraju, R.R., Cogswell, M., Das, A., Vedantam, R., Parikh, D., Batra, D. (2020). Grad-CAM: Visual explanations from deep networks via gradient-based localization. International Journal of Computer Vision, 128: 336-359. https://doi.org/10.1007/s11263-019-01228-7
[19] Yaagoubi, R., Lakber, C.E., Miky, Y. (2024). A comparative analysis on the use of a cellular automata Markov chain versus a convolutional LSTM model in forecasting urban growth using Sentinel-2A images. Journal of Land Use Science, 19(1): 258-277. https://doi.org/10.1080/1747423X.2024.2403789
[20] Shi, X.J., Chen, Z.R., Wang, H., Yeung, D.Y., Wong, W.K., Woo, W.C. (2015). Convolutional LSTM network: A machine learning approach for precipitation nowcasting. In Proceedings of the 29th International Conference on Neural Information Processing Systems, Montreal, Canada, pp. 802-810. https://dl.acm.org/doi/10.5555/2969239.2969329.