Elin Diyah Syafitri![]() | Nicco Plamonia*
| Nicco Plamonia*![]() | Ariyaningsih
| Ariyaningsih![]() | Rizky Pratama Adhi
| Rizky Pratama Adhi![]() | Riyan Benny Sukmara
| Riyan Benny Sukmara![]() | Doni Fernando
| Doni Fernando![]() | Rahmat Aris Pratomo
| Rahmat Aris Pratomo![]() | Iif Miftahul Ihsan
| Iif Miftahul Ihsan![]() | Widiatmini Sih Winanti
| Widiatmini Sih Winanti![]() | Sarjono Sarjono
| Sarjono Sarjono![]() | Gani Soehadi
| Gani Soehadi![]() | Satrio Utomo
| Satrio Utomo![]() | Nasrul Baddu
| Nasrul Baddu![]() | Hardono Hardono
| Hardono Hardono![]() | Rizki Arizal Purnama
| Rizki Arizal Purnama![]() | Helen Fifianny
| Helen Fifianny![]()
© 2026 The authors. This article is published by IIETA and is licensed under the CC BY 4.0 license (http://creativecommons.org/licenses/by/4.0/).
OPEN ACCESS
Designing an equitable and financially sustainable drinking-water tariff for Indonesia’s new capital city (IKN Nusantara) requires integrating biophysical constraints, hydraulic cost structures, and household affordability within a unified analytical framework. This study operationalizes the Input–Throughput–Output (ITO) framework to link seasonal raw-water variability, elevation-driven pumping costs, and socioeconomic behavior into tariff formulation. Using household surveys (n = 101), contingent valuation, Total Economic Valuation (TEV), and hydraulic–environmental datasets, we quantify Ability to Pay (ATP), Willingness to Pay (WTP), and the Basic Cost of Production (BCP). Results indicate that raw-water deterioration in the Sepaku River and a “conditionally safe” carrying capacity (DDA = 2.26) drive treatment-cost escalation of +5–12%, while hydraulic modelling establishes a BCP of IDR 3,313.5/m³. Integration of a Multi-Utility Tunnel (MUT) reduces operation and maintenance (O&M) costs by 15–18%. Socioeconomic analysis reveals strong affordability stratification: low-income households (< IDR 3.7 million/month) cannot afford tariffs above IDR 3,500/m³; middle-income households cluster within IDR 3,500–5,500/m³; and high-income households exhibit WTP above IDR 5,500/m³, enabling cross-subsidization. TEV analysis identifies a regional economic potential of IDR 13.55 billion/month if non-users transition to piped services. However, Full Cost Recovery (FCR) tariffs remain above household WTP due to high operational costs and reliance on alternative water sources. Based on these findings, we propose a progressive multi-block tariff structure incorporating lifeline subsidies, cost-recovery alignment, sustainability surcharges, groundwater disincentives, and seasonal adjustments. This framework provides an evidence-based pathway for achieving universal affordability, operational viability, and long-term water security in IKN Nusantara.
water tariff design, Ability to Pay, Willingness to Pay, Total Economic Valuation, Full Cost Recovery, hydraulic cost escalation, progressive-block tariff, IKN Nusantara
Ensuring sustainable and affordable drinking water provision for Indonesia’s New Capital City (IKN Nusantara) requires a holistic understanding of how environmental dynamics, hydraulic processes, and socioeconomic factors interact within an integrated system, based on a series of multi-year studies conducted since 2022 and published as part of the IKN Water Research Series [1-4]. We argue that sustainable water provision requires an integrated approach, as environmental dynamics, hydraulic processes, and socioeconomic factors cannot be analyzed in isolation. Upstream raw-water variability, midstream operational costs, and downstream affordability jointly determine service reliability and long-term sustainability, underscoring the need for a unified analytical framework.
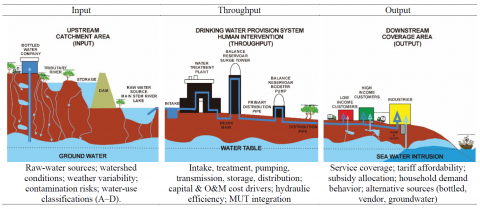
The sequence of studies is structured using the Input–Throughput–Output (ITO) framework for drinking-water provision, see Figure 1. Originally developed in 2020 [1], the ITO framework conceptualizes raw-water conditions as stochastic inputs, hydraulic treatment and distribution as deterministic throughput, and service affordability and household behavior as stochastic outputs.
Our prior studies show that the Sepaku–Tengin basin experiences strong seasonal fluctuations in pollutant load, turbidity, dissolved solids, and nutrients [3]. During the wet season, increases in Total Suspended Solids (TSS), Chemical Oxygen Demand (COD), Biochemical Oxygen Demand (BOD), and nitrate substantially raise treatment needs and chemical costs—up to IDR 19 billion annually [1]. Water-balance modelling indicates that the basin’s water environmental carrying capacity (DDA = 2.26) is “conditionally safe,” meaning supply remains adequate but vulnerable to land-use change and extraction pressure [2]. These patterns reflect the stochastic nature of the input layer, where raw-water categories (A–D) directly influence treatment technology and tariff structures.
The throughput stage represents the engineered drinking-water system—intakes, treatment, pumping, transmission, and distribution. Hydraulic modelling shows that multi-stage pumping driven by steep topography generates escalation costs of IDR 478.05/m³ [5, 6], raising the Basic Cost of Production (BCP) to IDR 3,313.5/m³ [3, 4]. Infrastructure assessments indicate that the Multi-Utility Tunnel (MUT) system performs significantly better than conventional buried pipelines, with 45% lower operation and maintenance (O&M) costs, reduced NRW, and slower asset depreciation (1.25% vs 5%) [4], making the throughput stage the most deterministically cost-governing component of IKN’s water system.
The output dimension reflects household affordability and behavioral patterns that are inherently stochastic [5], influenced by differences in income [6, 7], consumption [8-10], service expectations [8, 11], and reliance on alternative water sources. Survey findings from IKN’s buffer zones show that tariff acceptance depends on both income constraints and perceived water quality, continuity, and potability. This study therefore focuses on five key output indicators—BCP, Ability to Pay (ATP), Willingness to Pay (WTP), seasonal escalation sensitivity, and O & M burden—to assess the feasibility of a progressive tariff model and to explain household substitution behavior when piped-water service is insufficient.
We systematically examined each ITO stage—raw-water quality and carrying capacity (DDA) (input), hydraulic escalation and MUT efficiency (throughput), and ATP–WTP behavior (output). However, no study has integrated these dimensions into a unified tariff framework that simultaneously captures environmental constraints, hydraulic cost structures, and socioeconomic affordability. This gap becomes increasingly critical as IKN enters its phased habitation stage.
While our previous studies examine individual components of the system—namely raw-water conditions (input), hydraulic cost structures (throughput), and infrastructure performance—this study provides the first original empirical contribution at the output stage by generating new household-level data (n = 101) to quantify ATP, WTP, and tariff preferences. In addition, this study develops a novel integrated tariff model that explicitly links these newly generated socioeconomic variables with previously established environmental and hydraulic parameters.
The research question for this study is: “How can an integrated tariff model be designed for IKN Nusantara by combining raw-water constraints, hydraulic cost escalation, and household affordability to achieve socially equitable and financially sustainable drinking-water services?” To answer this question, the study: (1) integrates raw-water variability, carrying-capacity boundaries, and hydraulic cost structures into tariff formulation; (2) quantifies ATP and WTP across income groups; (3) develops a progressive multi-block tariff model aligned with environmental and operational constraints; and (4) provides system-level recommendations that link input, throughput, and output dimensions of water-service sustainability.
This research represents the first comprehensive operationalization of the full ITO framework—originally developed since 2014—into a tariff-design model for IKN, connecting biophysical constraints with cost structures and household behavior. The following section details the methodological approach used to implement this integrated framework.
2.1 Location of the study
Field data collection for this study was conducted over a one-month period from December 2024 to January 2025, complementing previously published research on water quality [1-3]. The study was conducted in the buffer zones surrounding IKN Nusantara, covering key service areas within the region, specifically Sepaku and Penajam districts, served by the regional drinking-water utility (Indonesia: Perusahaan Umum Daerah Air Minum or Perumda Air Minum or simply Perumda) Danum Taka in Penajam Paser Utara Regency, as well as Samboja and Muara Jawa districts served by Perumda Tirta Mahakam in Kutai Kartanegara Regency (See Figure 2).

2.2 Primary data sampling and collection
Primary data were collected through household surveys conducted in selected service areas of Kutai Kartanegara Regency (Perumda Tirta Mahakam) and Penajam Paser Utara Regency (Perumda Danum Taka), complemented by structured interviews with key stakeholders, covering a representative sample of water service users and structured interviews with the stakeholders. The WTP analysis applied a Contingent Valuation Method (henceforth, CVM), using a hypothetical bidding mechanism embedded in the household survey. WTP was estimated using the CVM, which captures both use and non-use values of environmental services and is widely applied to assess households’ monetary valuation of improved water services [13]. This method estimates the consumer surplus derived from improved water service scenarios, assuming rational consumer behavior. Data Collection consists of sequence activities as follows:
2.2.1 Questionnaire design
The questionnaire was designed to capture socioeconomic characteristics, service perceptions, and tariff preferences, following established practices in contingent valuation and household survey research [14-17]. The structure of the questionnaire is summarized in Table 1.
Perception variables were measured using a five-point Likert scale ranging from 1 (very poor) to 5 (very good), a widely adopted approach in survey-based research to capture subjective evaluations [18]. The WTP questions were designed in accordance with the CVM framework, which is commonly used to estimate individuals’ valuation of improved environmental and water services [15].
Table 1. Questionnaire variables
|
No. |
Aspect |
Questions |
|
1 |
Socio-Economic |
Age, Occupation, Number of people living under one /household connection, Type of Connection Class (R1–R5) or Type of Clean Water Consumed, Education, Monthly Household Income, Average Monthly Water Bill, Average Monthly Water Consumption |
|
2 |
Perception |
Water Quality, Water Quantity, Water Continuity, Drinkability, Customer Service/Maintenance Orientation |
|
3 |
Willingness to Pay (WTP) |
a. If Water Quality, Quantity, Continuity, Drinkability, and Customer Service/Maintenance Orientation improve, would you be willing to pay a higher tariff? If so, how much, or would you prefer the tariff to remain the same? b. If the service remains business as usual, what tariff would you consider appropriate? |
2.2.2 Contingent Valuation Method scenario design and bias control
The contingent valuation scenario was constructed to simulate a realistic service-improvement program. Respondents were asked to evaluate a hypothetical upgrade of water services characterized by: (1) continuous 24-hour supply; (2) improved water quality (safe after boiling); (3) stable pressure; (4) enhanced customer service and maintenance response. To reduce hypothetical bias, the scenario explicitly stated that tariff adjustments would be implemented by the local water utility and reflected in monthly billing (payment vehicle). To mitigate common CVM biases: (1) Starting-point bias was controlled by varying initial bids; (2) Strategic bias was minimized through neutral framing; (3) Information bias was reduced by providing standardized service descriptions.
2.2.3 Double-bounded dichotomous choice design
WTP was elicited using a Double-Bounded Dichotomous Choice (DBDC) format [19, 20], generating interval-censored data. Each respondent was first presented with an initial bid (B₁). Based on the response: (1) If “Yes”: a higher bid (B₂H) was offered; (2) If “No”: a lower bid (B₂L) was offered. Thus, each respondent provides a WTP interval: (1) YES–YES → WTP ≥ B₂H; (2) YES–NO → B₁ ≤ WTP < B₂H; (3) NO–YES → B₂L ≤ WTP < B₁; (4) NO–NO → WTP < B₂L. This structure improves statistical efficiency compared to single-bounded CVM (see Table 2).
Table 2. Bid structure in the Double-Bounded Dichotomous Choice (DBDC) design
|
Initial Bid (B₁) |
Lower Bid (B₂L) |
Higher Bid (B₂H) |
|
3,500 |
2,500 |
4,500 |
|
4,000 |
3,000 |
5,000 |
|
4,500 |
3,500 |
5,500 |
2.2.4 Field survey procedures
The field survey included structured questionnaires to assess household income, water consumption behavior, and perceptions related to water pricing and service quality. Household income and expenditure data were analyzed to estimate ATP [21], while tariff preferences and service-improvement scenarios were used to elicit WTP [22]. WTP was estimated using the CVM–DBDC approach, while Total Economic Valuation (TEV) was subsequently used to aggregate individual WTP into total economic value at the system level. In addition, in-depth interviews were conducted with stakeholders regarding operations, distribution, and service coverage areas.
2.2.5 Sampling design, frame, and representativeness
The sample size was determined using Slovin’s formula to ensure representativeness under limited population information [23, 24], see Eq. (1):
$n=\frac{N}{1+N(e)^2}$ (1)
where, (1) n = sample size; (2) N = total number of registered populations in the selected districts; (3) e = margin of error (10%).
The sampling strategy was designed to ensure statistical representativeness across heterogeneous service conditions [25]. The sampling frame consists of registered household connections from two regional water utilities (Perumda Danum Taka and Perumda Tirta Mahakam), covering four districts: Penajam, Sepaku, Samboja, and Muara Jawa.
The total population (N) is approximated at 22,488 registered service connections. Using Slovin’s formula with a 10% margin of error, a minimum sample size of 96 respondents was obtained. To improve robustness, the final sample includes 101 households.
A stratified purposive sampling approach was applied, combining: (1) spatial stratification (district-level distribution) [26]; (2) service-type stratification (utility vs non-utility users); and (3) socioeconomic stratification (income groups) [20, 22]. This hybrid design ensures representation of both revealed behavior (existing users) and stated preferences (non-users), which is critical for CVM-based valuation. Table 3 presents the final sample distribution.
Table 3. Sampling structure and stratification
|
Stratification Dimension |
Category |
n |
% |
|
District |
Penajam |
48 |
47.5 |
|
Sepaku |
24 |
23.8 |
|
|
Samboja |
16 |
15.8 |
|
|
Muara Jawa |
13 |
12.9 |
|
|
Service type |
Utility Users |
35 |
34.7 |
|
Non-Users |
66 |
65.3 |
|
|
Income group |
< 3.7 M |
28 |
27.7 |
|
3.7–5 M |
41 |
40.6 |
|
|
5–10 M |
22 |
21.8 |
|
|
> 10 M |
10 |
9.9 |
2.2.6 Validity test
Instrument validity was assessed to ensure that questionnaire items accurately measured the intended constructs related to water consumption, tariff perception, and WTP [27, 28]. Item validity was evaluated using Pearson product–moment correlation, where each item’s score was correlated with the total score. An item was considered valid when its calculated correlation coefficient exceeded the critical r-value at the 5% significance level (α = 0.05).
2.2.7 Reliability test
Reliability reflects the internal consistency of the measurement instrument in capturing household perceptions and tariff preferences [29]. Reliability was assessed using Cronbach’s Alpha, with values ≥ 0.6 considered acceptable for exploratory research involving socioeconomic and behavioral analysis [30, 31].
2.3 Secondary data
Secondary data used in this study were obtained from tariff documents, operational reports, regional minimum-wage regulations, and a set of previously published studies within the IKN Water Research Series [32, 33]. These datasets provide environmental and hydraulic parameters for the Input and Throughput stages of the ITO framework, including raw-water quality dynamics, DDA, hydraulic costs, and infrastructure performance (e.g., MUT efficiencies). In contrast, the Output stage relies on primary household survey data and constitutes the main empirical contribution of this study. Table 4 summarizes the data sources and their roles in the analytical framework.
Table 4. Secondary data sources and their role in the Input–Throughput–Output (ITO) framework
|
No. |
Type of Secondary Data |
Study / Document |
Key Values / Units |
ITO Position |
Use in this Study |
|
1 |
Seasonal pollutant loads (TSS, COD, BOD, nitrate) |
[1, 2] |
Seasonal spikes in TSS, COD, BOD; nitrate increases (mg/L) |
Input |
Treatment-cost sensitivity and wet-season escalation |
|
2 |
Water availability & Environmental Carrying Capacity |
[1, 2, 34] |
DDA = 2.26 (“conditionally safe”) |
Input |
Long-term supply constraints for tariff design |
|
3 |
Hydraulic escalation (elevation pumping) |
[35] |
478.05 IDR/m³ pumping cost |
Throughput |
Component of BCP calculation |
|
4 |
Basic Cost of Production (BCP) |
BCP = 3,313.5 IDR/m³ |
Throughput |
Cost-recovery baseline in tariff simulation |
|
|
5 |
MUT infrastructure performance |
[35] |
45% O&M reduction, 1.25% depreciation, NRW reduction |
Throughput |
Long-term O&M efficiency and sustainability tier pricing |
|
6 |
Tariff structures |
Danum Taka & Tirta Mahakam tariff regulations |
Block tariffs (IDR/m³) R1–R5, NR, industrial |
Output Context |
Benchmark comparison with ATP–WTP results |
|
7 |
Regional Minimum Wage (UMK/UMP) |
Provincial / Regency wage regulations |
PPU = IDR 3.71 Million, Kukar = IDR 3.53 Million |
Output Context |
Income classification for ATP modelling |
|
8 |
Tariff governance & institutional arrangements |
Provincial / Regency Data |
Governance indicators |
Output Context |
Understanding regulatory feasibility |
As shown in Table 4, secondary data relevant to the Output dimension—such as tariff structures, regional minimum-wage, and institutional arrangements governing tariff-setting—serve only as contextual inputs [36]. These regulatory and socioeconomic references provide baseline information for income classification, tariff benchmarking, and institutional feasibility, but they do not supply the affordability or behavioral indicators required for tariff modelling [22].
In contrast, the core Output indicators of this research are generated entirely through new primary data collection, making this study the first in the IKN Water Research Series to empirically quantify: (1) ATP across household income groups; (2) WTP under improved service scenarios (quality, continuity, pressure); (3) Household water-use patterns and service perceptions; (4) Tariff sensitivity to seasonal treatment-cost escalation; (5) Affordability gaps relative to the BCP.
These variables—absent from previous publications—form the central empirical contribution of this article. Their integration enables the construction of a progressive, evidence-based tariff model that completes the Output layer of the ITO framework and links environmental constraints, hydraulic cost structures, and household affordability into a unified decision-support system for IKN’s water tariff policy.
2.4 Analytical framework and data analysis
The Output stage of the ITO framework captures household affordability and behavioral responses, which are inherently stochastic due to variations in income, consumption patterns, service expectations, and access to alternative water sources. Key output indicators analyzed include the BCP, ATP, WTP [37, 38], seasonal escalation sensitivity, and O&M burden. These indicators collectively inform the feasibility of progressive tariff structures and explain substitution behavior toward bottled water or groundwater when service quality is inadequate.
2.4.1 Input–Throughput–Output analytical framework
The ITO framework links environmental constraints at the input stage, hydraulic and operational cost drivers at the throughput stage, and household affordability indicators at the output stage. This structure allows the integration of biophysical limitations, cost structures, and socioeconomic responses into a unified tariff-assessment model.
2.4.2 Total Economic Valuation
The TEV framework provides a comprehensive basis for assessing the full economic value of water services, making it particularly relevant for rapidly developing regions such as the IKN buffer zones. TEV incorporates both use and non-use values, allowing policymakers to account for the broader social and environmental benefits of reliable drinking-water provision beyond direct market pricing. Its components—direct use, indirect use, option, existence, and bequest values [39, 40]—capture the multiple dimensions through which households and communities value water services. In water-supply applications, TEV has been widely used to assess households’ WTP for improvements in quality, quantity, and service continuity [5]. Integrating TEV with ATP and WTP in this study supports the development of tariff structures that are both economically efficient and socially acceptable, enabling water utilities to align financial sustainability with equitable access and long-term resource stewardship.
2.4.3 Ability to Pay calculation
ATP was calculated using the income-based affordability threshold [41]:
$\operatorname{ATP}_i(\alpha)=\frac{\text { Income }_i \times \alpha}{\text { Monthly Water Use }_i}$ (2)
where, (1) Income $_i=$ monthly household income; (2) Monthly Water Use $_i=$ average monthly consumption $\left(\mathrm{m}^3\right)$; (3) $\alpha=$ affordability threshold by WHO (3–5%).
Eq. (2) yields in IDR $/ \mathrm{m}^3$ for each respondent, enabling identification whose ATP falls below BCP (IDR 3,313.5/m3) [3, 4] determined in the hydraulic throughout study. These results serve as the affordability boundary condition for tariff scenario modelling. Interpretation: (1) If $A T P_i<B C P$, then the household is unable to afford the economic (cost-recovery) tariff.
2.4.4 Willingness to Pay estimation
WTP was estimated using the DBDC format within the CVM. Respondents received an initial bid for improved service (continuity, potability, pressure), followed by a higher or lower bid based on their first response. The DBDC design generates interval-censored WTP data, offering greater statistical efficiency than single-bounded CVM.
Bid acceptance in the DBDC framework was modelled using a logistic regression following the econometric formulation [27], see Eq. (3):
$P\left(Y_i=1\right)=\frac{1}{1+e^{-\left(\alpha+\beta_1 B i d_i+\beta_2 X_i\right)}}$ (3)
where, (1) $Y_i=$ Response indicating "accept" (1) or "reject" (0); (2) Bid $_i=$ Bid value (initial bid and higher/lower followup bid); (3) $X_i=$ Socio-economic variables (income, household size), service perceptions, and expected service improvements; (4) $\alpha, \beta=$ Logit model parameters.
Estimation of WTP followed the standard DBDC–Logit procedure. The logistic regression incorporated key determinants commonly used in CVM studies—bid amount, household income, household size, current service satisfaction, and perceived improvements in continuity, potability, and pressure [42]. Mean WTP was derived from the estimated logit parameters using the standard formulation commonly applied in CVM–DBDC studies [43], see Eq. (4):
$W T P=-\frac{\alpha}{\beta_{\text {bid }}}$ (4)
where, $\alpha$ represents the constant term of the logit model, and $\beta_{\text {bid }}$ is the coefficient associated with the bid variable. The negative sign reflects the inverse relationship between the bid level and the probability of acceptance, consistent with economic demand theory.
The resulting WTP values form the behavioral–economic component of the output variable (Y), complementing the income-based ATP used to define affordability constraints. The estimated parameters obtained from the logit model were subsequently used to compute the mean WTP values presented in the Results section.
2.4.5 Econometric specification of Willingness to Pay model
To estimate households’ acceptance of proposed tariff levels, a binary logit model is employed to represent the probability of a “yes” response to a given bid, see Eq. (5):
$P\left(\right.$Yes$\left._i\right)=\frac{1}{1+e^{-\left(\alpha+\beta_{ {bid}} {Bid}_i+\beta_{ {inc}} {Income}_i+\beta_{ {hh}} {HHSize}_i+\beta_{ {per}} {Perception}_i\right.}}$ (5)
where, (1) Bid$_i=$ offered tariff $\left(\mathrm{IDR} / \mathrm{m}^3\right)$; (2) Income $_i=$ monthly household income; (3) HHSize $_i=$ household size; (4) Perception $_i=$ service quality perception index; (5) $\alpha=$ constant term; (6) $\beta_{\text {bid}}, \beta_{\text {inc}}, \beta_{\text {hh}}, \beta_{\text {per}}=$ estimated coefficients.
The sign and magnitude of the coefficients indicate the direction and strength of influence of each variable on the probability of acceptance. A negative coefficient (e.g., (![]() )) implies that higher tariffs reduce acceptance probability, while positive coefficients (e.g., income and perception) indicate increased likelihood of acceptance.
)) implies that higher tariffs reduce acceptance probability, while positive coefficients (e.g., income and perception) indicate increased likelihood of acceptance.
For the DBDC format, responses generate interval-censored data, and the likelihood function is defined in Eq. (6) as follow:
$L=\prod_{i=1}^n\left[F\left(U_i\right), F\left(L_i\right)\right]$ (6)
where, $\mathrm{F}(\cdot)$ is the cumulative distribution function of WTP, and $\left(L_i\right)$ and $\left(U_i\right)$ denote the lower and upper bounds of the WTP interval for respondent iii, derived from sequential bid responses. Model parameters are estimated using Maximum Likelihood Estimation (MLE), assuming a logistic distribution of WTP.
2.4.6 Tariff simulation (Progressive-block output modelling)
The progressive-block tariff simulation integrates household affordability (ATP), behavioral intention (WTP), and the physical–environmental constraints defined in the ITO framework. Five core components structure the model:
Wet-season increases in TSS, COD, BOD, nitrate, and turbidity are accounted for using a +5–12% seasonal adjustment factor.
The model generates and evaluates tariff scenarios based on revenue adequacy, equity, and consistency with environmental and hydraulic constraints. By combining BCP, ATP–WTP indicators, seasonal escalation, MUT-driven efficiencies, and carrying-capacity limits, the simulation completes the output dimension of the ITO framework and supports an equitable, cost-recoverable tariff structure for IKN.
This section comprises two integrated parts. First, we present the empirical Results that establish the ITO-based physical and socio-economic boundary conditions for tariff modelling (input: raw-water quality & quantity; throughput: hydraulic and infrastructure costs; output: ATP, WTP, TEV). Second, we interpret those results in the Discussion, drawing policy-relevant conclusions and testing how the empirical evidence supports progressive tariff scenarios. Results (3.1) report observed data and statistical tests; Discussion (3.2) synthesizes implications for tariff design, equity, and long-term sustainability.
3.1 Results
In this section, we integrate key findings from the input and throughput stages of the ITO framework to establish the physical and economic boundary conditions for tariff modelling. On the input side, our raw-water assessments show that the Sepaku River exhibits light to moderate pollution with clear rainy-season peaks in TSS, COD, BOD, nitrate, and turbidity. These seasonal fluctuations increase treatment complexity and drive chemical-cost variability of approximately ±12–25% (IDR 404–422/m³). In contrast, the Tengin River demonstrates more stable water quality due to observable self-purification processes. Together, these dynamics contribute to the basin’s Water Environmental Carrying Capacity classification (DDA = 2.26), which indicates that long-term supply is generally adequate yet increasingly vulnerable to land-use change and growing extraction demands.
From the throughput perspective, our hydraulic modelling confirms a substantial elevation-driven pumping penalty of IDR 478.05/m³, resulting in a BCP of IDR 3,313.5/m³. Our infrastructure evaluation further shows that the MUT system offers significant efficiency gains, including approximately 45% lower O&M expenditure and a slower asset-depreciation rate (1.25% compared with 5% for conventional buried networks). These combined input and throughput results define the environmental, hydraulic, and cost structures that underpin our analysis of household affordability (ATP), WTP, and the development of progressive tariff scenarios.
On the output side, our survey data reveal that Penajam and Sepaku—two main buffer districts adjacent to the IKN core—have the highest number of connections (10,216 and 2,901, respectively), which is consistent with the distribution of respondents in our primary data collection. Residential Class R4 remains the most common service category across all districts, reinforcing the dominance of household demand and providing a representative foundation for ATP–WTP modelling presented in the following subsections.
3.1.1 Household characteristics
Based on our survey results, we found that the majority of respondents originated from Penajam and Sepaku (71%), reflecting the high population density and proximity of these districts to the IKN core area. Most respondents were adults in the 36–55 age group (61.3%), with senior high school and bachelor-degree education levels dominating the sample. Self-employment accounted for the largest occupational category (36%).
Household socioeconomic characteristics indicate that most respondents fall within the lower–middle-income bracket. Household sizes typically range from three to six members. Income distribution varies substantially, with 27.7% reporting earnings below the regional minimum wage (UMK: IDR 3.7 million), while a smaller proportion (22 respondents) reported monthly incomes between IDR 5–10 million. This mix highlights a predominantly low- to moderate-income population relevant for ATP–WTP modelling.
Among non-utility users, deep wells, water tanks, and purchased water were the primary alternative sources. Approximately half expressed willingness to switch to (Tirta Mahakam and Danum Taka) services due to expectations of better convenience, reliability, and potential cost savings, with a preferred tariff range of IDR 3,500–4,500/m³. However, hesitation remained among some respondents due to perceived issues such as poor water quality, high chlorine levels, or the absence of utility coverage in their neighborhoods.
User satisfaction varied: while many utility customers were generally satisfied, common complaints included inconsistent flow—especially during morning peak hours—low water quality (dirty water or strong chlorine smell), and tariff increases perceived as misaligned with service performance. Some households indicated readiness to accept incremental tariff increases (up to IDR 5,000/m³) if accompanied by better continuity and quality, whereas others preferred tariff stability or reductions. Across all districts, water from the piped supply was primarily used for cleaning, cooking, and watering plants, with very few respondents consuming it directly without boiling.
3.1.2 Validity test
Data validation was conducted to ensure that the questionnaire items used to measure ATP and WTP were statistically sound. Validity was tested using SPSS with item–total correlations based on the Pearson product–moment method. Each of the seven key survey items was evaluated against the critical r-value for n = 35, where r-table = 0.2746 at the 5% significance level. An item is considered valid when r-calculated ≥ 0.3 and r-calculated > r-table.
Results show that all questionnaire items met the validity criteria. For example, the item “How would you rate the quality of the Perumda water you use?” produced an item–total correlation of r = 0.363, which exceeds the threshold (0.363 > 0.2746), indicating that the item is valid. The complete validity results for all items are presented in Table 5.
Table 5. Validity test – Pearson correlation
|
Question(s) |
Q1 |
Q2 |
Q3 |
Q4 |
Q5 |
Q6 |
Q7 |
Pearson Correlation |
|
Q1 |
1 |
0.255 |
0.255 |
0.427* |
0.212 |
-0.135 |
-0.112 |
0.363* |
|
Q2 |
1 |
0.945** |
0.308 |
0.185 |
0.302 |
0.142 |
0.679** |
|
|
Q3 |
1 |
0.203 |
0.185 |
0.172 |
0.142 |
0.636** |
||
|
Q4 |
1 |
-0.117 |
0.083 |
-0.059 |
0.382* |
|||
|
Q5 |
1 |
0.363* |
0.361* |
0.539** |
||||
|
Q6 |
1 |
0.352* |
0.464** |
|||||
|
Q7 |
1 |
0.692** |
*. Correlation is significant at the 0.05 level (2-tailed).
**. Correlation is significant at the 0.01 level (2-tailed).
Note: Q1: "Clean Water Quality", Q2: "Clean Water Quality", Q3: "Clean Water Continuity", Q4: "Drinking Purposes (after being boiled)?", Q5: "Clean Water Expenses per Month", Q6: "Appropriate and Reasonable clean water tariff per m³", Q7: "Would you be willing to pay a higher clean water tariff if there were improvements in water quantity, quality, and service delivery?"
3.1.3 Reliability test
Reliability was assessed using SPSS, with internal consistency measured through Cronbach’s Alpha based on standardized items. This approach was necessary because the questionnaire included mixed response formats, such as Likert scales, numerical tariff responses, and categorical sociodemographic variables. Despite these variations, the reliability analysis focused on the seven key items related to ATP and WTP.
A Cronbach’s Alpha value of ≥ 0.6 is considered acceptable for exploratory research, with 0.7 often used as a preferred threshold. The reliability coefficient obtained in this study was 0.655, indicating that the instrument demonstrates adequate internal consistency for the purposes of the analysis. The complete reliability results are presented in Table 6.
Table 6. Reliability test
|
Cronbach's Alpha |
Cronbach's Alpha Based on Standardized Items |
N of Items |
|
0.632 |
0.655 |
7 |
3.1.4 Ability to Pay
We assessed households’ ATP to evaluate their financial capacity to afford utility services based on income and water expenditures. Our analysis shows that while most households can afford the current tariffs, a significant proportion risks exceeding the internationally accepted affordability benchmark of 5% of monthly income, indicating potential financial strain for low-income users—particularly if future tariff adjustments are made without targeted subsidies. The ATP results are presented in Table 7.
Table 7. Ability to Pay (ATP) structure per income group
|
Income Group (Million IDR/Month) |
Number of Respondents (Person) |
Current Water Expenses (IDR/Month) |
Affordability Analysis |
|
< 3.7 |
28 |
< 100,000 |
Limited ATP: May struggle with tariffs > 3,500/m³. |
|
3.7–5.0 |
41 |
100 |
Moderate ATP: Can afford 3,500 – 4,500/m³. |
|
5.0–10.0 |
22 |
300 |
Good ATP: Can afford 4,500 – 5,500/m³. |
|
> 10.0 |
10 |
> 300,000 |
High ATP: Can afford higher tariffs. |
Low-income households typically spend less than 300,000 IDR per month on water (including alternative sources like bottled water or water vendors). Their financial capacity suggests they can sustainably pay no more than 3,500 IDR/m³ for piped water. Even at this rate, subsidies or social tariffs may be necessary, as their water expenditure already represents ~8% of their income (exceeding the WHO-recommended 5% threshold for water affordability [28, 45, 46]). Their budget constraints likely prioritize other essentials (food and housing) over water services.
Middle-income households can absorb tariffs of 3,500–5,500 IDR/m³ without significant hardship. Their WTP aligns with their ATP, making them the core demographic for Perumda's standard pricing tier. At 5,500 IDR/m³, water costs would represent ~3–5% of their income, which is financially manageable. They may tolerate gradual tariff increases if paired with measurable service improvements, such as 24/7 supply and better water quality [28, 45, 47].
High-income households may be able to pay more than 5,500 IDR/m³, but willingness depends heavily on perceived service reliability. This group could support cross-subsidization models. A premium tariff tier (> 6,000 IDR/m³) could offer value-added services like priority maintenance and water filters. Their demand is less price-sensitive but highly quality-sensitive. Poor service, such as interruptions, may lead them to revert to private alternatives, such as bore wells.
3.1.5 Econometric estimation of Willingness to Pay
To operationalize the econometric framework described in the Methods section, the DBDC responses were estimated using a binary logit model. This estimation enables the assessment of factors influencing households’ acceptance of tariff levels and supports the interpretation of WTP behavior, see Tables 8 and 9.
Table 8. Logit estimation results
|
Variable |
Coef. |
Std. Err |
z |
P-Value |
|
Bid |
-0.00082 |
0.00031 |
-2.64 |
0.008 |
|
Income |
0.00047 |
0.00019 |
2.47 |
0.013 |
|
HH Size |
-0.118 |
0.051 |
-2.31 |
0.021 |
|
Perception |
0.452 |
0.176 |
2.56 |
0.011 |
|
Constant |
-1.23 |
0.58 |
-2.12 |
0.034 |
Table 9. Model fit statistics of the logit model
|
Metric |
Value |
|
Log-likelihood |
-62.4 |
|
McFadden Pseudo R² |
0.21 |
|
Number of observations |
101 |
The model fit statistics indicate a satisfactory explanatory power of the logit model in capturing respondents’ acceptance behavior, as reflected by the log-likelihood and pseudo R² values.
The estimated coefficients align with economic theory and empirical findings in CVM literature. The negative coefficient of the bid variable confirms the expected downward-sloping demand for improved water services, indicating that higher tariffs reduce acceptance probability. The positive and significant income coefficient reflects income elasticity in water demand, suggesting that purchasing power plays a critical role in households’ valuation of improved services.
The negative effect of household size highlights intra-household budget constraints, where larger households face greater financial pressure in allocating expenditure for water. Meanwhile, the strong positive influence of service perception indicates that non-price factors—particularly reliability, quality, and continuity—substantially shape WTP. This finding reinforces the behavioral dimension of water demand, where service improvements can effectively shift demand curves upward even in constrained-income contexts.
Table 10. Estimated mean WTP (model-based)
|
Measure |
Value |
|
Mean WTP (IDR/m³) |
4,250 |
|
Median WTP (IDR/m³) |
4,000 |
|
95% CI Lower |
3,600 |
|
95% CI Upper |
4,900 |
|
Method |
DBDC Logit |
The estimated mean WTP of approximately IDR 4,250/m³ reflects the central tendency of respondents’ stated preferences obtained through the DBDC survey design (Table 10). The median value of IDR 4,000/m³ further confirms this central tendency, while the observed range of IDR 3,600–4,900/m³ captures the variability in household responses. These results are consistent with the dominant tariff range of IDR 3,500–4,500/m³ observed across respondents and provide a realistic and policy-relevant benchmark of households’ valuation under the proposed service improvement scenario.
3.1.6 Distributional characteristics and sensitivity perspective
To strengthen the statistical depth of the results, the distributional characteristics of WTP are further examined beyond central tendency measures. The estimated mean WTP of IDR 4,250/m³ and median value of IDR 4,000/m³ indicate a relatively symmetric distribution, with most observations concentrated within a narrow range. The confidence interval (IDR 3,600–4,900/m³) suggests moderate dispersion, indicating that respondents’ valuation of improved water services is relatively consistent, with limited extreme deviations.
This distributional pattern is supported by the observed tariff preferences, where the majority of respondents—across both utility and non-utility groups—cluster within the IDR 3,500–4,500/m³ range. The concentration of responses within this interval reflects a strong consensus on acceptable tariff levels and reinforces the robustness of the estimated WTP.
From a socioeconomic perspective, variability in WTP is primarily driven by income stratification and service perception. Lower-income households exhibit tighter constraints and lower acceptable tariff thresholds, while higher-income households demonstrate a wider valuation range and greater tolerance for tariff increases. This heterogeneity confirms the importance of incorporating distribution-sensitive tariff design rather than relying solely on aggregate averages.
In addition to distributional analysis, the results also reflect implicit sensitivity dynamics related to environmental, operational, and socioeconomic factors. Seasonal raw-water deterioration leads to treatment-cost escalation of approximately +5–12%, which directly affects the feasibility of cost-recovery tariffs. At the same time, infrastructure efficiency gains—particularly from MUT implementation—reduce O&M costs by 15–18%, partially offsetting tariff pressures.
These interacting factors demonstrate that WTP and tariff feasibility are not static but responsive to changing system conditions. Consequently, the proposed tariff structure should be interpreted within a sensitivity-oriented framework, where environmental variability, infrastructure efficiency, and household affordability jointly influence optimal tariff levels. This perspective enhances the policy relevance of the findings by linking statistical outcomes with real-world system dynamics.
3.1.7 Willingness to Pay, Total Economic Valuation, and Full Cost Recovery tariff
In this study, we evaluate households’ WTP as an indicator of the maximum tariff they are prepared to pay for improved utility services. Our findings show a moderate to high WTP among respondents, consistent with international evidence that households are more responsive to improvements in reliability, water quality, and supply duration than to price reductions [48]. Respondents consistently prioritize continuous water availability and adequate pressure, indicating that service improvements are perceived as more valuable than maintaining low tariffs. Based on the survey responses, we assessed WTP for both utility and non-utility users, with the results presented in Table 11.
To complement the econometric estimation, a distributional analysis of respondents’ stated tariff preferences is presented in Table 6. This provides an intuitive understanding of how households perceive acceptable tariff ranges under current and improved service conditions.
Table 11. WTP structure per group
|
Group |
Number of Respondents |
Preferred Tariff Range (IDR/m³) |
Observations |
|
Non-Utility/Perumda Users |
66 |
3,500 – 4,500 (majority) |
Some willing to pay up to 5,500 if service improves. |
|
Utility/Perumda Users |
35 |
3,500 – 4,500 (most common) |
Some accept 4,600 – 5,500 if reliability increases. |
|
Both Groups |
101 |
3,500 – 4,500 (consensus range) |
Resistance to higher tariffs among low-income households. |
Most respondents, both current utility users and non-users, consider 3,500–4,500 IDR/m³ a fair price for piped water services. This reflects a price equilibrium where affordability and perceived value align. This implies Perumda’s price range should serve as the baseline tariff for standard residential connections. Pricing within this band maximizes customer retention (existing users) and service adaptation (non-users considering switching). Deviating significantly above this range without service improvements increases the risk of non-payment or customer attrition.
However, there is conditional acceptance of higher tariffs as much as 4,600 – 5,500 IDR/m³. Respondents are open to tariffs beyond 4,500 IDR/m³ only if Perumda demonstrates tangible improvements, such as water quality (reduced turbidity, chlorine taste, or contamination), supply reliability (24/7 availability and no dry-season shortages), and customer service-oriented (faster complaint resolution and transparent billing). This condition reflects a rational trade-off that consumers accept higher costs if they perceive added value.
On the other hand, households earning < 3.7 million IDR/month struggle to pay even the consensus rate, as water expenses would exceed 5–8% of income. Thus, in the future, there is an emerging risk that low-income users may avoid formal connections, relying on unsafe alternatives (shallow wells and vendors). If this condition occurred, Perumda would lose potential revenue from a large customer segment.
This study also employed the TEV approach to estimate the overall WTP of respondents, capturing both the direct use value from current Perumda or utility customers and the indirect use value from potential or non-users who recognize the benefits of access to clean water services. The concept of TEV provides a comprehensive framework to assess the overall value of a resource by capturing both tangible and intangible benefits. In the context of clean water services, TEV encompasses two primary components: direct use value and indirect use value. This TEV cost may serve as the potential earnings for Perumda.
Direct use value refers to the benefits received by individuals who actively use the service, such as households that rely on Perumda water for daily consumption, hygiene, and household needs. These users can quantify their WTP based on the utility they derive from regular access to water. The direct cost form Perumda users are shown in Table 12.
On the other hand, indirect use value accounts for the perceived value among individuals who may not currently utilize the service, but recognize its potential benefits and express a willingness to contribute if access were provided. This might include residents in nearby areas who value future access to clean water, improved environmental conditions, or community-wide health benefits. Indirect costs form non-utility users and utility users are shown in Tables 13 and 14.
Table 12. Total Economic Valuation (TEV) direct cost for Perumda or water utility users
|
Clean Water Connection Type |
Clean Water Expenses per Month |
Median |
Number of Respondents |
Proportion of Respondents |
Total Average WTP (IDR/Month) |
|
|
Minimum Range |
Maximum Range |
|||||
|
R2 |
200,000 |
300,000 |
250,000 |
3 |
0.085 |
21,428.57 |
|
R3 |
50,000 |
100,000 |
75,000 |
1 |
0.028 |
2,142,85.86 |
|
100,001 |
199,999 |
150,000 |
1 |
0.028 |
4,285.71 |
|
|
200,000 |
300,000 |
250,000 |
3 |
0.085 |
21,428.57 |
|
|
R4 |
50,000 |
100,000 |
75,000 |
2 |
0.057 |
4,285.71 |
|
100,001 |
199,999 |
150,000 |
9 |
0.257 |
38,571.43 |
|
|
200,000 |
400,000 |
300,000 |
12 |
0.342 |
102,857.14 |
|
|
R5 |
100,001 |
199,999 |
150,000 |
2 |
0.057 |
8,571.43 |
|
200,000 |
500,000 |
350,000 |
2 |
0.057 |
20,000.00 |
|
|
Total |
35 |
1.000 |
223,571.43 |
|||
Table 13. Indirect cost for non-utility users
|
Preferred WTP per m3 (IDR/Month) |
Median |
Number of Respondents |
Cumulative Frequency |
Average WTP per m3 (IDR/Month) |
Average Water Consumption (m3/Month) |
Average WTP per Month (IDR/Month) |
|
|
Minimum Range |
Maximum Range |
||||||
|
3,500 |
4,500 |
4,000 |
58 |
0.878 |
3,512 |
25 |
|
|
4,600 |
5,500 |
5,050 |
8 |
0.121 |
611.05 |
25 |
|
|
Total |
66 |
1,000 |
4,123.05 |
25 |
103,076.25 |
||
Table 14. Indirect cost for utility users
|
Preferred WTP per m3 (IDR/Month) |
Median |
Number of Respondents |
Cumulative Frequency |
Average WTP per m3 (IDR/Month) |
Average Water Consumption (m3/Month) |
Average WTP per Month (IDR/Month) |
|
|
Minimum Range |
Maximum Range |
||||||
|
3,500 |
4,500 |
4,000 |
18 |
0.514 |
2,056.00 |
27.94 |
|
|
4,600 |
5,500 |
5,050 |
2 |
0.057 |
287.85 |
27.94 |
|
|
5,000 |
10,000 |
7,500 |
2 |
0.057 |
427.5 |
27.94 |
|
|
7,500 |
8,500 |
8,000 |
2 |
0.057 |
456 |
27.94 |
|
|
8,500 |
9,500 |
9,000 |
6 |
0.171 |
1,539 |
27.94 |
|
|
9,600 |
10,500 |
10,050 |
2 |
0.057 |
572,85 |
27.94 |
|
|
10,600 |
11,500 |
11,050 |
1 |
0.028 |
309,4 |
27.94 |
|
|
13,500 |
14,800 |
14,150 |
2 |
0.057 |
806,55 |
27.94 |
|
|
Total |
35 |
1.000 |
6,455.15 |
27.94 |
180,356.89 |
||
Table 15. TEV calculation
|
Direct Cost for Utility Users (IDR/Month) |
Indirect Cost for Utility Users (IDR/Month) |
Indirect Cost for Non- Utility Users (IDR/Month) |
Total TEV for Utility Users (IDR/Month) |
Total TEV for Non- Utility Users (IDR/Month) |
|
(1) |
(2) |
(3) |
(4) = (1) + (3) |
(5) = (1) + (2) |
|
223,571.39 |
180,356,89 |
103,076.25 |
326,647.64 |
403,928.28 |
|
Total TEV for water utility from Existing Users in 4 Selected Districts per Month (22,488 connections) in IDR/Month |
7,345,652,128.32 |
|
||
|
Total TEV for utility from Non-utility Users in 4 Selected Districts per Month in IDR/month* |
|
6,209,275,282.28 |
||
|
Total TEV for utilities in IDR/month |
13,554,927,410.32 |
|||
*Each water utility connections typically served one household that consists of 3-6 persons. The existing users reached 22,488 connections that considered equivalent to provide services for 101,196 inhabitants. With a total registered population of 170,371 inhabitants across the four selected sub-districts, there is 69,175 inhabitants that not served yet by water utilities (Perumda). The potential remaining utility connections could reach equivalent to 15,372.
The TEV of utility users can be estimated by adding the direct costs incurred by Perumda users and the indirect costs associated with non- utility users. Conversely, the TEV of non- utility users can be calculated by combining the direct costs of utility users with the indirect costs attributed to utility users. Table 15 shows the TEV calculation and the sum into TEV for utility.
Table 15 summarizes the estimated monthly TEV of water services across the four surveyed districts, combining revenue from existing Perumda customers (22,488 connections) and potential revenue from non-users should they transition to piped water. We estimate TEV from current users at IDR 7.35 billion/month, while the additional TEV from non-users is IDR 6.21 billion/month, representing the unrealized market value of the service. Together, this reflects the full regional economic value of water utility services and highlights substantial revenue potential if system expansion is planned strategically. These findings indicate that while financial opportunities exist, they must be weighed against operational cost pressures to avoid future fiscal stress. TEV thus provides a preliminary economic feasibility signal for network expansion and service refinement.
To assess long-term financial sustainability, TEV must be interpreted alongside the Full Cost Recovery (FCR) tariff of Perumda Danum Taka and Perumda Tirta Mahakam. The FCR tariff fully incorporates operating, maintenance, capital, depreciation [49], and environmental management costs, representing the price at which the utility breaks even on service provision. Interview findings reveal that FCR levels exceed the WTP expressed by households, reflecting two structural constraints: (1) high operational and maintenance costs, driven by long distribution distances, aging assets, rising energy and chemical prices, and administrative inefficiencies; and (2) socioeconomic limitations on WTP, as many households—particularly in IKN’s buffer zones—face restricted disposable income and continue to rely on alternative sources (deep wells, vendors, refill water depots), reducing their WTP cost-reflective tariffs.
This imbalance between FCR and WTP illustrates the classic tension between the economic rationality of FCR and the social obligation to guarantee equitable access to drinking water as a public good. Strict adherence to FCR risks excluding low-income households, whereas heavy subsidization risks undermining utility solvency. International experience shows that neither extreme is sustainable; instead, cross-subsidization, public financing, and progressive tariff structures are required to reconcile equity with financial viability.
Our results suggest that adopting the FCR tariff [50], FCR tariff would enhance long-term financial sustainability, reduce dependence on government subsidies, and enable reinvestment in infrastructure—yet only if implemented with appropriate affordability safeguards. In this context, TEV earnings could potentially offset part of the operating expenditure, supporting uninterrupted service provision while allowing tariff reforms to proceed gradually and equitably. Overall, the TEV–FCR comparison underscores the need for a tariff strategy that balances revenue generation, affordability, and the public-good nature of drinking water.
3.1.8 Cross analysis: Ability to Pay, Willingness to Pay, and Full Cost Recovery
Our analysis of household responses shows clear socioeconomic variation in how ATP aligns with WTP for piped water services. We identified three distinct behavioral conditions that illustrate how households evaluate service affordability and utility.
First, we observe households where ATP exceeds WTP. These users have the financial capacity to pay for piped water but choose not to, often due to dissatisfaction with service reliability, water quality, or perceived value. As “choice riders,” they favor alternative sources when the cost–benefit ratio of piped water does not meet their expectations. Their decisions are driven more by service perception than by economic constraints.
Second, we find households where WTP exceeds ATP. These “captive riders” depend heavily on piped water and are willing to allocate a disproportionately large share of their limited income to secure reliable supply, despite affordability challenges. This group highlights a critical equity concern: without targeted subsidies or social tariffs, these households’ risk financial strain while attempting to maintain access to essential services.
Table 16. Cross analysis between ATP and WTP
|
Income Group |
WTP (IDR/m³) |
ATP (IDR/m³) |
Recommended Tariff |
|
Low-Income (< 3.7 M) |
≤ 3,500 |
≤ 3,500 |
3,000 – 3,500 (subsidized) |
|
Middle-Income (3.7 M–10 M) |
3,500 – 5,500 |
3,500 – 5,500 |
3,500 – 4,500 (standard) |
|
High-Income (> 10 M) |
> 5,500 |
> 5,500 |
5,500 – 6,500 (premium) |
Finally, we identify households where ATP closely matches WTP, indicating a balanced condition in which financial capacity and service valuation are aligned. This group functions as the equilibrium segment, supporting tariff levels that correspond to both income and perceived service benefits. However, they remain highly sensitive to tariff increases; without clear improvements in quality or continuity, even modest price adjustments may push them toward alternative sources. Table 16 presents a cross matrix and tariff segmentation based on ATP and WTP analysis.
Understanding these user segments is critical for designing a tariff structure that is both equitable and financially sustainable. Our results show that tariff policy cannot rely solely on cost-reflective pricing; it must also accommodate behavioral and socioeconomic differences across households. This requires pricing models that remain inclusive while ensuring long-term utility viability. In practice, this means applying targeted subsidies and differentiated tariff tiers so that vulnerable groups are protected while higher-income users contribute proportionally more to system financing.
As shown in Table 10, the IDR 1,500/m³ differential between the recommended low- and high-tariff ranges forms the foundation of a progressive pricing structure. This gap allows the system to shield low-income users from unaffordable charges while capturing the higher WTP of affluent households. The middle-income group—representing the largest share of users—forms the anchor of tariff design, providing both revenue stability and broad public acceptability. The tariff gap also offers policy flexibility, enabling local adjustments without undermining the overall equity logic.
The broad ATP–WTP range enables effective demand management through tiered pricing and cross-subsidization. However, successful implementation depends on accurate income verification to avoid misclassification. A progressive tariff system requires that high-income households and high-volume consumers (including businesses) contribute through upper tariff blocks to subsidize lifeline tariffs. Conversely, subsidy targeting must be precise to prevent leakage—such as high-income households benefiting from low-tier tariffs or low-income users being placed incorrectly in standard tiers.
Table 17 outlines the proposed tariff structure, which, if implemented with careful verification and monitoring, provides a socially acceptable and financially responsible pathway for tariff reform.
Table 17. Recommended implementation strategy
|
Household Segment |
Immediate Action |
Medium-Term Action |
Overview |
|
Low-Income |
Roll out subsidized basic tier |
Develop smart subsidy targeting system |
Increase service coverage among low-income households |
|
Middle-Income |
Implement standard 2-block tariff |
Introduce conservation pricing for high-volume users |
Maintain financial sustainability through middle-income revenue as the major user |
|
High-Income |
Pilot premium service package |
Develop differentiated service levels |
Capture additional value from high-income users |
3.1.9 Progressive tariff structure for IKN: ATP–WTP alignment and policy justification
Income-Based ATP varies across income groups, forming the affordability basis for tariff-block segmentation, see Table 18.
Meanwhile, household WTP falls within IDR 3,500–4,500/m³, depending on expected improvements in continuity, drinkability, and pressure. Affordability Gap: (1) Low-income ATP < BCP → requires subsidy; (2) Middle-income WTP ≈ BCP → near cost recovery; (3) High-income WTP > BCP → potential cross-subsidy group. This ATP–WTP structure is used to design tariff blocks that are both socially equitable and financially viable.
Table 18. Income-based ATP
|
No |
Income Tier (IDR/Month) |
ATP Range (IDR/m³) |
|
1 |
< 3 million |
2,000–2,800 |
|
2 |
3–5 million |
2,800–3,500 |
|
3 |
5–10 million |
3,500–4,500 |
|
4 |
> 10 million |
> 4,500 |
Final Progressive Tariff Model for IKN, explain as follow:
The proposed progressive tariff structure is designed to align household affordability (ATP), WTP, and system cost components, while ensuring equity, financial sustainability, and long-term resource protection (Table 18). Social blocks (R1–R2) are set at or below the ATP of low-income households and therefore must be supported through cross-subsidization. Middle-income households (R3) face tariffs positioned near the BCP, enabling partial cost recovery, whereas upper-income and premium consumers (R4–R5) contribute higher tariffs reflecting their greater WTP and serving as the primary source of cross-subsidy and demand management. Non-residential categories (NR1–NR2) stabilize water utility revenues, while industrial tariffs (I1–I2) incorporate environmental burden pricing to internalize externalities associated with high-volume extraction and wastewater generation.
Table 19. Unified customer category tariff table
|
Category |
Income / Criteria |
Monthly Consumption |
Tariff (IDR/m³) |
|
R1 – Basic Social |
≤ 3 million |
0–10 |
2,500–2,800 |
|
R2 – Social Middle |
3–5 million |
0–15 |
3,000–3,300 |
|
R3 – Middle Income |
5–10 million |
15–25 |
3,300–4,000 |
|
R4 – Upper Income |
> 10 million |
25–40 |
4,500 |
|
R5 – Premium |
High-consumption households |
> 40 |
6,000–7,000 |
|
NR1 – Small Business (UMKM) |
Warung, small enterprises |
0–20 |
4,000–5,000 |
|
NR2 – Commercial |
Hotels, malls, offices |
> 20 |
6,500–8,000 |
|
I1 – Small Industry |
Light manufacturing |
— |
9,000–10,000 |
|
I2 – Heavy Industry |
Large industrial users |
— |
12,000–14,000 |
In addition, the tariff model incorporates system-wide adjustment factors: a rainy-season surcharge (+5–12%) to account for higher chemical dosing and treatment burdens; a MUT efficiency factor (15–18% O&M reduction) expected after full implementation; and a groundwater disincentive tariff to discourage non-Perumda withdrawals and protect environmental DDA. This integrated structure ensures that tariff design remains responsive to environmental, hydraulic, and socioeconomic dynamics specific to IKN (Table 19).
The tariff blocks presented above collectively achieve a balance between household affordability, operational cost recovery, and environmental protection. Social blocks (R1–R2) remain below the BCP and are safeguarded through cross-subsidy mechanisms enabled by higher tariffs in the upper, premium, commercial, and industrial categories. Middle-income households (R3) face tariffs aligned with their ATP and WTP, supporting stable revenue generation without compromising affordability. Higher-consumption and non-residential users (R4–R5, NR1–NR2, I1–I2) contribute proportionally more, reflecting both their capacity to pay and the environmental burden associated with their consumption patterns.
When integrated with seasonal surcharges, MUT-based efficiency gains, and groundwater disincentive tariffs, this structure forms a coherent and evidence-based tariff model that aligns the ITO logic—input constraints, throughput cost dynamics, and output affordability behavior—into a sustainable pricing framework for IKN.
3.2 Discussion
Our findings demonstrate that an equitable and financially sustainable tariff for IKN can only be achieved through an integrated interpretation of environmental constraints, hydraulic cost structures, and household affordability within the ITO framework.
This integrated perspective is consistent with prior studies emphasizing the need to jointly consider cost recovery, affordability, and resource constraints in water tariff design, particularly in rapidly urbanizing regions [51, 52]. However, unlike conventional approaches that treat these dimensions separately, this study operationalizes them within a unified ITO framework, enabling a more system-oriented evaluation.
Seasonal raw-water deterioration and the basin’s carrying-capacity (DDA = 2.26) raise treatment and pumping costs, producing a BCP that directly shapes household affordability outcomes.
Similar cost escalations associated with raw-water variability and infrastructure constraints have been observed in other developing-country water systems, where treatment intensity and energy requirements significantly affect tariff structures.
The ATP–WTP analysis reveals a clear socioeconomic gradient: low-income households have ATP below BCP and require protection through social or lifeline tariffs; middle-income groups exhibit WTP near BCP and can sustain cost recovery under improved service reliability; and high-income users show substantially higher WTP, enabling internal cross-subsidization.
This pattern aligns with established findings that income is a primary determinant of both ATP and WTP for water services, with affordability constraints disproportionately affecting lower-income households [21].
Service quality—particularly continuity, pressure, and drinkability—critically influences user behavior, where dissatisfaction triggers substitution to bottled water or groundwater, heightening environmental pressures.
This behavior is consistent with contingent valuation literature showing that perceived service quality significantly influences WTP and demand for piped water, particularly in contexts where alternative sources are readily available [20, 22].
Incorporating elevation-driven pumping costs and MUT-based O&M efficiencies ensures that tariff design reflects both current production realities and future cost-saving trajectories. These results collectively justify a progressive multi-block tariff: subsidized social blocks, cost-recovery blocks aligned with BCP, and upper/commercial blocks for revenue stability and demand management.
Such progressive tariff structures are widely recognized as effective mechanisms to balance equity and financial sustainability through cross-subsidization and demand management.
To reinforce equity, we emphasize targeted subsidies, accurate income verification, and robust governance. On the utility side, NRW reduction, energy optimization, and improved billing systems can narrow the gap between WTP and FCR. When combined with PPP-based investment options and strengthened community engagement, these measures provide a coherent pathway to reconcile universal affordability, operational sustainability, and long-term environmental protection in IKN’s emerging water-service system.
Overall, the main contribution of this study lies in linking environmental system constraints, infrastructure cost dynamics, and household economic behavior within a single analytical framework, providing a more comprehensive basis for tariff design than approaches focusing on individual dimensions alone.
These findings are further supported by a sensitivity-oriented interpretation, where tariff feasibility is influenced by seasonal treatment-cost escalation, infrastructure efficiency gains, and variability in household affordability across income groups.
This study was guided by the question: “How can an integrated tariff model be designed for IKN Nusantara by combining raw-water constraints, hydraulic cost escalation, and household affordability to achieve a socially equitable and financially sustainable water-service system?” Our findings demonstrate that an effective tariff model must simultaneously incorporate environmental inputs, hydraulic throughput costs, and socioeconomic output behavior within a unified ITO-based framework. Upstream assessments confirm seasonal raw-water deterioration and a “conditionally safe” DDA (DDA = 2.26), requiring tariffs that anticipate seasonal escalation (+5–12%) and regulate demand to avoid over-abstraction. Throughput analysis shows that elevation-driven pumping, energy requirements, and O&M collectively determine the (BCP (BCP = IDR 3,313.5/m³), moderated by long-term MUT efficiency gains (15–18% O&M reduction).
The ATP–WTP analysis reveals clear affordability stratification. Low-income households (< IDR 3.7 million/month) cannot afford tariffs above 3,500 IDR/m³ and already exceed the WHO 5% affordability threshold. Middle-income groups (3.7–10 million) cluster around 3,500–5,500 IDR/m³, aligning with their WTP. High-income households (>10 million) exhibit WTP > 5,500 IDR/m³, creating viable space for cross-subsidization. These patterns confirm that a uniform tariff is neither equitable nor financially sustainable.
In response to the research question and study objectives, we conclude that IKN requires a progressive multi-block tariff that: (1) sets lifeline/social blocks below BCP to protect vulnerable households; (2) aligns cost-recovery blocks with median WTP and the BCP benchmark; (3) prices upper and non-residential blocks to internalize hydraulic escalation, curb excess demand, and generate cross-subsidies; (4) applies groundwater disincentive tariffs to prevent unsustainable extraction; and (5) incorporates seasonal surcharges and MUT efficiency coefficients to ensure long-term resilience.
TEV analysis strengthens this conclusion: existing utility users generate IDR 7.34 billion/month, and potential non-user adoption adds IDR 6.21 billion/month—demonstrating substantial economic value. Yet, the persistent gap between FCR and community affordability—driven by high O&M, energy, and distribution costs—remains the critical constraint to system expansion and service improvement.
Therefore, achieving an equitable and financially sustainable water-service system in IKN requires: (i) cross-subsidization within the progressive structure, (ii) targeted lifeline tariffs, (iii) operational efficiency improvements (NRW reduction, energy optimization), (iv) government support for capital and operational expenditure, and (v) adaptive tariff mechanisms responsive to socio-economic shocks (inflation, pandemics, instability). By integrating environmental, hydraulic, and socioeconomic evidence, this study provides a robust and actionable tariff framework capable of supporting IKN’s long-term water security [41], financial viability, and social equity.
From a broader sustainable development perspective, the proposed tariff model provides important implications for urban growth management, infrastructure governance, and long-term resource sustainability in IKN. By integrating environmental DDA, hydraulic cost structures, and household affordability, the model supports more adaptive planning in the face of rapid urban expansion and increasing water demand. The progressive tariff structure contributes to social equity by protecting low-income households while enabling cost recovery through cross-subsidization, aligning with inclusive development objectives. At the institutional level, the findings highlight the need for strong governance mechanisms, including transparent tariff-setting, reliable income classification, and performance-based utility management. Furthermore, incorporating efficiency improvements—such as NRW reduction, energy optimization, and MUT systems—supports long-term resource management by reducing system losses and operational pressures. Overall, the model demonstrates how tariff design can function not only as a financial instrument but also as a strategic tool for sustainable urban water planning in emerging metropolitan regions such as IKN.
Based on the integrated analysis of raw-water conditions, hydraulic cost structures, and household affordability, several policy recommendations are proposed to ensure an equitable, financially viable, and environmentally sustainable water-service system for IKN Nusantara:
1. Adopt a Progressive Multi-Block Tariff Structure
Implement a tiered tariff system with lifeline blocks priced below the BCP (IDR 3,313.5/m³), financed through cross-subsidies from upper residential, commercial, and industrial users. Cost-recovery blocks should align with median WTP, while sustainability blocks internalize hydraulic escalation and environmental burden pricing.
2. Apply Seasonal Adjustment Factors (+5–12%)
Introduce wet-season surcharges to reflect higher treatment costs driven by elevated TSS, COD, BOD, nitrate, and turbidity. This ensures financial stability and accurate cost reflection during peak pollution months.
3. Utilize MUT-Driven O&M Efficiencies (15–18%)
Incorporate long-term reductions in O&M and depreciation from MUT deployment into tariff recalculations to moderate tariff escalation, improve reliability, and sustain subsidies for vulnerable users.
4. Implement Groundwater Disincentive Tariffs
To protect the basin’s “conditionally safe” DDA (DDA = 2.26), enforce surcharges on unregulated groundwater extraction, encouraging a shift to piped water and strengthening Perumda revenue.
5. Provide Targeted Subsidies for Low-Income Households (< IDR 3.7 million/month)
Grant subsidized lifeline tariffs (first 10 m³/month) for households with ATP < BCP, ensuring compliance with WHO affordability thresholds (≤ 3–5% of income).
6. Enhance Transparency and Stakeholder Participation
Strengthen tariff acceptance by improving communication on cost structures and planned service improvements, and by involving communities, regulators, and developers in tariff-setting processes.
7. Expand Perumda Market Share Through Non-Perumda User Integration
Prioritize service expansion to non-Perumda households—representing > IDR 6.2 billion/month TEV potential—through accelerated infrastructure rollout, simplified onboarding, and switching incentives.
8. Develop a Dynamic Tariff Adjustment Framework
Establish an adaptive pricing mechanism that incorporates periodic ATP–WTP assessments and economic monitoring to maintain affordability during shocks (inflation, pandemics, socio-political disruptions).
9. Invest in Service Quality to Enhance WTP and Reduce Substitution
Improve drinkability, pressure stability, continuity, and maintenance responsiveness to elevate WTP and reduce reliance on bottled water and groundwater.
10. Integrate Tariff Policy with Long-Term Water Security Planning
Align tariff design with raw-water protection, NRW reduction, energy optimization, wastewater management, and environmental conservation to ensure system-wide sustainability during IKN’s development trajectory.
Conceptualization and study design: Nicco Plamonia (N.P.). Methodology and analytical framework development: Nicco Plamonia (N.P.), Rizky Pratama Adhi (R.P.A.), Doni Fernando (D.F.), and Iif Miftahul Ihsan (I.M.I.). Field investigation and data collection: Elin Diyah Syafitri (E.D.S.), Ariyaningsih (A.), Riyan Benny Sukmara (R.B.S.), and Rahmat Aris Pratomo (R.A.P.). Data analysis and modelling (ATP–WTP, TEV, FCR): Doni Fernando (D.F.), Sarjono Sarjono (S.S.), Gani Soehadi (G.S.), Satrio Utomo (S.U.), and Nasrul Baddu (N.B.). Writing—original draft preparation: Nicco Plamonia (N.P.), Doni Fernando (D.F.). Writing—review and editing: Hardono (H.), Rizki Arizal Purnama (R.A.Pu.), and Helen Fifianny (H.F.). Supervision: Nicco Plamonia (N.P.), Doni Fernando (D.F.), Elin Diyah Syafitri (E.D.S.), and Widiatmini Sih Winanti (W.S.W.). All authors have read and approved the final manuscript.
Research and Innovation Program for Advanced Indonesia (RIIM Batch III) Year 2023, LPDP Indonesia (Indonesia Endowment Fund for Education) funded this study. The author would also like to say thank you to Directorate of Research and Innovation Funding, National Research and Innovation Agency, Republic of Indonesia to deliver grant and administrative requirements and also to Department of Urban and Regional Planning, Kalimantan Institute of Technology as our collaborative colleague during field survey.
[1] Amru, K., Anjani, R., Plamonia, N., Dewa, R.P. (2025). Kajian daya dukung lingkungan berbasis ketersediaan dan kebutuhan air di ibu kota nusantara. Jurnal Teknologi Lingkungan, 26(1): 75-81. https://doi.org/10.55981/jtl.2025.4471
[2] Dewa, R.P., Aryantie, M.H., Amru, K., Anjani, R., Plamonia, N. (2025). Analisis kualitas sumber air baku untuk pemenuhan kebutuhan air minum di ibu kota nusantara. Jurnal Teknologi Lingkungan, 26(1): 82-89. https://doi.org/10.55981/jtl.2025.4037
[3] Plamonia, N., Anjani, R., Amru, K., Dewa, R.P., Kurniawan, B., Wahyono, I.B., Komarudin, M., Zaidan, M., Winarno, B., Syaefudin, Purwanta, W., Sudinda, T.W., Widiatmoko, N., Tresnadi, H., Parato, T.E., Muktiyono. (2026). Seasonal dynamics of raw water quality and pollution load in the Sepaku River: Implications for treatment costs in Nusantara, Indonesia’s New Capital. International Journal of Design & Nature and Ecodynamics, 21(1): 91-104. https://doi.org/10.18280/ijdne.210109
[4] Plamonia, N., Dewa, R.P., Jayanti, M., Riyadi, A., Rahayu, B., Diyono, Sahwan, F.L., Chandra, H., Sulistiawan, I.N., Sudiana, N., Hidayat, N., Prasetiyadi, Tilottama, R.D., Irawanto, R., Wahyono, S., Suprapto, Juniati, A.T., Prasidha, I.N.T. (2025). Sustainable water distribution design for Indonesia's new capital, Nusantara: Integrating eco-design and economic principles. International Journal of Sustainable Development and Planning, 20(2): 537-554. https://doi.org/10.18280/ijsdp.200207
[5] Whittington, D. (2003). Municipal water pricing and tariff design: A reform agenda for South Asia. Water policy, 5(1): 61-76. https://doi.org/10.2166/WP.2003.0003
[6] Yang, H., Bain, R., Bartram, J., Gundry, S., Pedley, S., Wright, J. (2013). Water safety and inequality in access to drinking-water between rich and poor households. Environmental Science & Technology, 47(3): 1222-1230. https://doi.org/10.1021/ES303345P
[7] Alvisi, S., Franchini, M., Marinelli, A. (2003). A stochastic model for representing drinking water demand at residential level. Water Resources Management, 17(3): 197-222. https://doi.org/10.1023/A:1024100518186
[8] Blundell, R., Low, H., Preston, I. (2013). Decomposing changes in income risk using consumption data. Quantitative Economics, 4(1): 1-37. https://doi.org/10.3982/QE44
[9] Abe, N., Yamada, T. (2009). Nonlinear income variance profiles and consumption inequality over the life cycle. Journal of the Japanese and International Economies, 23(3): 344-366. https://doi.org/10.1016/J.JJIE.2009.04.001
[10] Seale Jr, J.L., Regmi, A. (2006). Modeling international consumption patterns. Review of Income and Wealth, 52(4): 603-624. https://doi.org/10.1111/J.1475-4991.2006.00204.X
[11] Jia, J., Li, J., Liu, W. (2023). Expectation-based consumer purchase decisions: Behavioral modeling and observations. Marketing Letters, 34(3): 397-413. https://doi.org/10.1007/S11002-022-09650-7
[12] Plamonia, N.I.C.C.O. (2020). Improving the coverage area of drinking water provision by using build operate and transfer investments in Indonesia. An Institutional Analysis. https://doi.org/10.3990/1.9789036550901
[13] Haab, T.C., Interis, M.G., Petrolia, D.R., Whitehead, J.C. (2013). From hopeless to curious? Thoughts on Hausman's 'dubious to hopeless' critique of contingent valuation. Applied Economic Perspectives and Policy, 35(4): 593-612.
[14] Hanemann, W.M. (1987). Welfare evaluations in contingent valuation experiments with discrete responses: Reply. American Journal of Agricultural Economics, 69(1): 185-186. https://doi.org/10.2307/1241323
[15] Whitehead, J.C., Haab, T. (2013). Contingent valuation method. In Encyclopedia of Energy, Natural Resource, and Environmental Economics, pp. 334-341. https://doi.org/10.1016/B978-0-12-375067-9.00004-8
[16] Birol, E., Karousakis, K., Koundouri, P. (2006). Using economic valuation techniques to inform water resources management: A survey and critical appraisal of available techniques and an application. Science of the Total Environment, 365(1-3): 105-122. https://doi.org/10.1016/J.SCITOTENV.2006.02.032
[17] Blundell, R. (2003). Measuring Consumer Behavior: Semiparametric Estimation and Revealed Preference. Department of Economics, University College London.
[18] Likert, R. (1932). Escala de Likert. Recuperado el, 11.
[19] Hanemann, M., Loomis, J., Kanninen, B. (1991). Statistical efficiency of double-bounded dichotomous choice contingent valuation. American Journal of Agricultural Economics, 73(4): 1255-1263. https://doi.org/10.2307/1242453
[20] Carson, R.T., Hanemann, W.M. (2005). Contingent Valuation. In Handbook of Environmental Economics, 2: 821-936. https://doi.org/10.1016/S1574-0099(05)02017-6
[21] Komives, K. (2005). Water, Electricity, and the Poor: Who Benefits from Utility Subsidies? World Bank Publications.
[22] Mitchell, R.C., Carson, R.T. (2013). Using Surveys to Value Public Goods: The Contingent Valuation Method. RFF Press.
[23] Sevilla, C.G. (1992). Research Methods. Rex Bookstore, Inc.
[24] Israel, G.D. (1992). Determining Sample Size.
[25] Cochran, W.G. (1977). Sampling Techniques. John Wiley & Sons.
[26] Etikan, I., Musa, S.A., Alkassim, R.S. (2016). Comparison of convenience sampling and purposive sampling. American Journal of Theoretical and Applied Statistics, 5(1): 1-4. https://doi.org/10.11648/J.AJTAS.20160501.11
[27] Babbie, E., Buzzi, C. (2010). Ricerca Sociale. Roma, Italy: Apogeo.
[28] Taherdoost, H. (2016). Sampling methods in research methodology; how to choose a sampling technique for research. How to choose a sampling technique for research. https://doi.org/10.2139/ssrn.3205035
[29] Ishtiaq, M. (2019). Book review Creswell, JW (2014). research design: Qualitative, quantitative and mixed methods approaches. Thousand Oaks, CA: Sage. English Language Teaching, 12(5): 40. https://doi.org/10.5539/elt.v12n5p40
[30] DeVellis, R.F., Thorpe, C.T. (2021). Scale Development: Theory and Applications. Sage Publications.
[31] VP, A.B., Tjendani, H.T., Wulandari, E. (2025). Analysis of the value of ability to pay & willingness to pay toll tariffs in the people of gresik regency based on the facilities and infrastructure of the krian–legundi–bunder toll road. Enrichment: Journal of Multidisciplinary Research and Development, 2(10): 1056-1064.
[32] Saunders, M. (2009). Research Methods for Business Students. Person Education Limited.
[33] Yin, R.K. (2018). Case Study Research and Applications (Vol. 6). Thousand Oaks, CA: Sage.
[34] Yolinda, Y., Pharmawati, K. (2019). Analisis willingness to pay sistem penyediaan air minum menggunakan contingent valuation method di kota bandung (studi kasus pelanggan IPA Dago Pakar). Jurnal Reka Lingkungan, 7(2): 78-89. https://doi.org/10.26760/REKALINGKUNGAN.V7I2.78-89
[35] Plamonia, N., Putra, A.P., Yunus, A.F., Saptiarini, D., Lesman, S., Bukit, D.L., Wijayanti, S., A, D.N., Widyastuti, I. (2025). Comparative analysis of multi-utility tunnel and conventional methods: Evaluating cost efficiency, soil stability, and sustainability for infrastructure development in IKN, Nusantara. Mathematical Modelling of Engineering Problems, 12(6): 1981-1996. https://doi.org/10.18280/mmep.120614
[36] Telesetsky, A. (2012). 10. Organisation for Economic Co-operation and Development (OECD). Yearbook of International Environmental Law, 23(1): 578-582. https://doi.org/10.1093/yiel/yvt015
[37] Fagundes, T.S., Marques, R.C., Malheiros, T. (2023). Water affordability analysis: A critical literature review. AQUA—Water Infrastructure, Ecosystems and Society, 72(8): 1431-1445. https://doi.org/10.2166/AQUA.2023.035
[38] Fagundes, T.S., Marques, R.C., Malheiros, T.F. (2025). A comprehensive framework for water affordability analysis. Water Resources Management, 39(6): 2527-2549. https://doi.org/10.1007/S11269-024-04076-4
[39] Pearce, D.W., Turner, R.K. (1989). Economics of Natural Resources and the Environment. Johns Hopkins University Press.
[40] Turner, B.L., Kasperson, R.E., Matson, P.A., McCarthy, J.J., et al. (2003). A framework for vulnerability analysis in sustainability science. Proceedings of the National Academy of Sciences, 100(14): 8074-8079. https://doi.org/10.1073/pnas.1231335100
[41] Grafton, R.Q., Manero, A., Chu, L., Wyrwoll, P. (2023). The price and value of water: An economic review. Cambridge Prisms: Water, 1: e3. https://doi.org/10.1017/wat.2023.2
[42] Brouwer, R., Bateman, I.J. (2005). Benefits transfer of willingness to pay estimates and functions for health-risk reductions: A cross-country study. Journal of Health Economics, 24(3): 591-611. https://doi.org/10.1016/j.jhealeco.2004.09.004
[43] Haab, T.C., McConnell, K.E. (2002). Valuing Environmental and Natural Resources: The Econometrics of Non-Market Valuation. In Valuing Environmental and Natural Resources. Edward Elgar Publishing. https://doi.org/10.4337/9781843765431
[44] Plamonia, N., Anjani, R., Amru, K., Sudaryanto, A. (2024). Exploring effective institutional models for piped drinking water management: A comparative study of Jakarta and Kuala Lumpur and proposal of a new model for Indonesia's new capital city. Water Practice & Technology, 19(12): 4734-4753. https://doi.org/10.2166/wpt.2024.291
[45] Thabit, S., Aguinaga, G., Maroso, R., Mohn, C., et al. (2020). United nations human settlements programme (un-habitat).
[46] WHO. (2011). Guidelines for Drinking-Water Quality, 4th edition.
[47] WHO. (2017). 2017 annual report WHO/UNICEF joint monitoring programme for water supply, sanitation and hygiene. https://washdata.org/sites/default/files/documents/reports/2018-07/JMP-2017-annual-report.pdf.
[48] Liang, Y., Cheng, S.K., Min, Q.W., Ma, D.M. (2005). Study on residents' willingness to pay for improving urban water environment. Shuili Xuebao (J. Hydraul. Eng.), 36(5): 613-617.
[49] Borgomeo, E., Chase, C., Godoy, N.S., Kwadwo, V.O. (2023). Rising from the Depths: Water Security and Fragility in South Sudan. World Bank Publications. https://doi.org/10.1596/978-1-4648-1943-8
[50] Rogers, P., De Silva, R., Bhatia, R. (2002). Water is an economic good: How to use prices to promote equity, efficiency, and sustainability. Water Policy, 4(1): 1-17. https://doi.org/10.1016/S1366-7017(02)00004-1
[51] OECD. (2012). A Framework for Financing Water Resources Management. OECD Publishing. https://doi.org/10.1787/9789264179820-en
[52] OECD. (1999). The Price of Water: Trends in OECD countries. OECD Publishing. https://doi.org/10.1787/9789264173996-EN