Immanuel Panusunan Tua Panggabean![]() | Sirojuzilam*
| Sirojuzilam*![]() | Suwardi Lubis
| Suwardi Lubis![]() | Agus Purwoko
| Agus Purwoko![]()
© 2025 The authors. This article is published by IIETA and is licensed under the CC BY 4.0 license (http://creativecommons.org/licenses/by/4.0/).
OPEN ACCESS
This study presents a GIS-FAHP integrated framework for prioritizing sustainable urban infrastructure, with empirical evidence from Medan City, Indonesia—a rapidly urbanizing area facing spatial inequality, congested road networks, and uneven distribution of public facilities. The framework combines GIS spatial analysis with FAHP-based multi-criteria weighting to enhance objectivity and manage uncertainty in infrastructure planning. The model integrates three key criteria—building density, road infrastructure, and public facilities—selected for their relevance to spatial accessibility and service provision. Expert-based pairwise comparisons, adjusted through fuzzification, reveal that building density exerts the strongest influence (60.4%), followed by road infrastructure (26.4%) and public facilities (13.2%). A GIS-based weighted overlay produces spatial suitability maps, categorizing Medan into five infrastructure development priority zones. Notably, only 4.26% of the city area is identified as highly suitable for infrastructure investment, while over 54% remains unsuitable due to accessibility constraints and infrastructure gaps. Spatial autocorrelation analysis using Moran's I confirms significant clustering patterns, validating the robustness of the model. This integrated GIS-FAHP approach contributes to the advancement of sustainability-focused urban planning by offering a replicable, scalable, and evidence-based tool for prioritizing infrastructure development. The findings support policy decisions aimed at reducing spatial disparities and promoting equitable, sustainable urban growth in Medan and comparable Southeast Asian cities.
sustainable urban development, spatial prioritization, infrastructure planning, GIS-based multi-criteria analysis, Fuzzy Analytic Hierarchy Process (FAHP), spatial decision support systems, urban infrastructure suitability
Urban growth continues to escalate spatial inequality across Southeast Asia, particularly in Indonesia’s secondary and emerging metropolitan cities where infrastructure development often fails to match the pace of demographic expansion. Medan City, the largest urban center in Sumatra, exemplifies these challenges, with rapid urbanization leading to unbalanced building densities, congested transportation networks, and uneven distribution of essential public services [1-3]. These conditions contribute to inefficient urban service delivery, restricted mobility, and deepening socio-spatial segregation, despite the city’s ongoing infrastructure investments.
Effective infrastructure prioritization is critical to ensure balanced urban development and equitable access to public services. However, Medan's current spatial planning strategies have largely been reactive, characterized by limited use of systematic, data-informed decision-making frameworks. This reactive approach has failed to adequately anticipate areas of future demand or optimize the spatial distribution of infrastructure across the city’s diverse neighborhoods.
The integration of Geographic Information Systems (GIS) into urban planning has proven highly effective in mapping spatial phenomena, identifying land suitability, and visualizing infrastructure gaps [4, 5]. However, while GIS excels in spatial data analysis and visualization, it does not inherently resolve uncertainty in planning decisions—especially when these depend on multiple, conflicting criteria and expert-based assessments. These limitations have led to growing interest in enhancing GIS with decision-support mechanisms such as Multi-Criteria Decision-Making (MCDM) models.
Among various MCDM approaches, the Analytic Hierarchy Process (AHP) and its fuzzy extension, Fuzzy AHP (FAHP), have become widely used to support structured decision-making in complex environments [6-8]. AHP, originally developed by Saaty, organizes problems into hierarchical structures and enables expert-driven pairwise comparisons of alternatives. FAHP, building on Zadeh’s fuzzy set theory, allows decision-makers to incorporate imprecise linguistic judgments into quantitative models. This enhancement is particularly valuable in urban infrastructure planning, where subjective expert opinions are often influenced by uncertainty and context-specific variability.
The integration of GIS and FAHP has demonstrated strong potential in a range of spatial planning contexts, such as groundwater zoning, disaster evacuation site selection, renewable energy site planning, and urban green infrastructure prioritization [9-11]. These studies highlight the complementary strengths of GIS (for spatial mapping) and FAHP (for expert-based evaluation), producing more nuanced spatial decision-support models. However, research applying this integrated approach to infrastructure prioritization remains limited—particularly in rapidly urbanizing regions like Indonesia. Most existing studies focus on narrower aspects such as land-use suitability [12] or transport network optimization [13], without addressing the multi-dimensional nature of urban infrastructure demand.
At the same time, Indonesia’s urban development agenda increasingly emphasizes sustainable growth, spatial justice, and alignment with the United Nations Sustainable Development Goals (SDGs), especially Goal 11: Sustainable Cities and Communities. Yet, practical tools for translating these goals into operational planning frameworks remain scarce. In this context, the GIS-FAHP integration represents a promising opportunity to bridge strategic planning objectives with grounded spatial analysis, helping policymakers navigate trade-offs between spatial efficiency, social equity, and long-term resilience [14-17].
Given these challenges, Medan City serves as an appropriate case study for developing and testing a GIS-FAHP integrated framework designed to support infrastructure prioritization. By applying multi-criteria spatial analysis combined with fuzzified expert inputs, this study aims to identify suitable development zones, validate spatial clustering patterns, and provide a decision-support tool that enhances policy formulation [18, 19]. The research contributes not only to methodological advancements but also to practical planning solutions for sustainable urban infrastructure development.
To guide this inquiry, the following research questions are posed:
This study develops an integrated spatial decision-making framework by combining GIS and the Fuzzy Analytic Hierarchy Process (FAHP) to prioritize infrastructure development in Medan City, Indonesia. The methodology is structured to address the research questions by systematically managing spatial data, applying expert-informed multi-criteria analysis, and validating spatial suitability through clustering analysis [20]. The overall process is designed to enhance infrastructure planning objectivity, reduce uncertainty, and support sustainability-oriented urban development.
2.1 Study area
Medan City is located between 3°35'–3°45' North and 98°35'-98°44' East in North Sumatra Province, covering approximately 28,199 km² with a population of over 2.4 million residents as of 2024 (Medan Municipality, 2024) (Figure 1). As the largest metropolitan area in Sumatra, Medan exhibits significant variability in land use, characterized by dense urban cores, peri-urban transition zones, and sparsely developed peripheral districts. Key spatial challenges in the city include overloaded road infrastructure, fragmented distribution of public facilities, and high variability in building density.
Figure 1. Location of Medan City
These characteristics make Medan an appropriate case study for testing the applicability of a GIS-FAHP-based infrastructure prioritization model, focusing on the integration of spatial efficiency and spatial equity.
2.2 Data acquisition and preparation
The model development relies on three primary spatial datasets representing key infrastructure-related criteria (Table 1):
Table 1. Spatial datasets and sources
|
Criteria |
Data Source |
Format/Resolution |
|
Building Density |
Ministry of Home Affairs |
Raster (10m × 10m grid resolution) |
|
Road Infrastructure |
Medan City Spatial Planning Agency |
Vector (main and secondary roads) |
|
Public Facilities |
Geospatial Information Agency (Medan City) |
Vector (schools, hospitals, public services) |
All spatial data were processed and harmonized using ArcGIS Pro, ensuring a common coordinate reference system for overlay analysis. Vector datasets were converted into raster format to enable weighted overlay operations. A raster resolution of 10 meters × 10 meters was selected as an optimal scale to balance computational efficiency and spatial granularity. This resolution aligns with Indonesia’s urban planning standards and provides sufficient detail for differentiating infrastructure characteristics at the neighborhood level without incurring excessive processing loads. Previous studies on urban spatial analysis have also adopted similar resolutions for infrastructure suitability mapping [5, 8].
2.3 Multi-criteria weighting using AHP and FAHP
The weighting of criteria was conducted through a structured pairwise comparison approach utilizing both Analytic Hierarchy Process (AHP) and Fuzzy AHP (FAHP) to incorporate expert judgment while reducing subjectivity.
Expert Selection
Experts evaluated the relative importance of three criteria (building density, road infrastructure, public facilities) using a triangular fuzzy scale to capture uncertainty in pairwise comparisons. The scale employed for fuzzification is shown in Table 2.
Table 2. Triangular fuzzy scale for pairwise comparisons
|
Verbal Scale |
Triangular Fuzzy Number (TFN) |
|
Equal importance |
(1, 1, 1) |
|
Moderate importance |
(2, 3, 4) |
|
Strong importance |
(4, 5, 6) |
|
Very strong importance |
(6, 7, 8) |
|
Extreme importance |
(8, 9, 10) |
The triangular fuzzy numbers used in Table 2 were adapted from standard FAHP practices in the spatial decision-making literature [7, 21], ensuring consistency with previous validated applications of fuzzy logic in infrastructure and environmental planning contexts.
The FAHP process followed these main steps:
The final normalized weights derived from this process were integrated into the GIS-based weighted overlay analysis. The expert-based survey data utilized in this study were sourced from the Mebidang Sustainable Project, a government-supported initiative that had previously obtained ethical and institutional clearance for expert involvement. As such, this research did not involve any direct data collection from human participants, and no identifiable personal data were used. All expert assessments used in the FAHP model were anonymized and derived from documented project outputs.
2.4 Spatial suitability analysis using GIS
We used spatial analysis based on the weighted overlay method in ArcGIS Pro, integrating the FAHP-derived criteria weights. To ensure comparability across different data layers, all raster layers were standardized through fuzzification into a common suitability scale ranging from 0 (unsuitable) to 1 (highly suitable) [22]. The normalization of raster layers was conducted using the min–max normalization method, defined as:
$x_i^{\prime}=\frac{x_i-x_{\min }}{x_{\max }-x_{\min }}$
where, $x_i$ is the original raster cell value, $x_{\text {min }}$ and $x_{\text {max }}$ represent the minimum and maximum values of the layer respectively, and $x_i^{\prime}$ is the resulting standardized value on a 0-1 scale. This transformation ensured that all spatial layers were directly comparable in the weighted overlay.
The weighted overlay formula applied was:
$S=\sum_{i=1}^n w i \times x i$
where,
The resulting suitability surface was classified into five priority categories:
As illustrated in Figure 2, the model development follows a five-step GIS-FAHP integration process. Spatial datasets are preprocessed and rasterized to a common resolution and projection system. Expert opinions are captured through fuzzy pairwise comparisons, processed using the FAHP method to generate normalized weights. These weights are then applied in a GIS-based weighted overlay analysis to produce a composite suitability surface. Finally, the robustness of the resulting spatial patterns is validated using Moran’s I autocorrelation method.
Figure 2. Integrated GIS-FAHP workflow for infrastructure prioritization in Medan City. The workflow consists of five stages: (1) spatial data acquisition and harmonization, (2) expert-based pairwise comparisons using fuzzy logic, (3) FAHP criteria weighting and defuzzification, (4) GIS-based weighted overlay analysis using raster layers, and (5) validation via spatial autocorrelation (Moran’s I) to assess clustering robustness
2.5 Validation through spatial autocorrelation analysis
Validate the spatial clustering of suitability results and confirm the model’s robustness, Moran's I spatial autocorrelation analysis was applied. This step tested whether the identified suitability patterns exhibited statistically significant clustering rather than random spatial distributions [23, 24]. A Queen contiguity spatial weight matrix was used to define spatial relationships. This method considers neighboring spatial units that share either a border or a vertex, allowing for a more comprehensive assessment of spatial dependence in urban infrastructure contexts. The spatial weights were computed using ArcGIS’s spatial statistics tools with row-standardization to ensure comparability across grid units.
The Moran’s I statistic was calculated as:
$I=\frac{n}{w} \cdot \frac{\sum_{i=1}^n \sum_{j=1}^n w_{i j}\left(x_i-\bar{x}\right)\left(x_j-\bar{x}\right)}{\sum_{i=1}^n\left(x_i-\bar{x}\right)}$
where,
2.6 Methodological link to research questions
Table 3. Methodological approach addressing research questions
|
Research Question |
Methodological Approach |
|
How can GIS-FAHP integration effectively prioritize infrastructure development zones? |
Weighted overlay analysis combining FAHP-based criteria weights and GIS raster layers. |
|
What are the relative influences of building density, road infrastructure, and public facilities? |
FAHP criteria weighting through expert-based fuzzy pairwise comparisons. |
|
How does the proposed GIS-FAHP framework contribute to promoting spatial equity? |
Validation through Moran’s I spatial autocorrelation and spatial pattern analysis. |
To ensure coherence between the study's objectives and its analytical procedures, Table 3 outlines how each research question is methodologically addressed. This structured mapping demonstrates the consistency of the GIS-FAHP framework in responding to the study’s core inquiries and enhances transparency in the research design.
The analysis focuses on three core components: (1) criteria weighting using FAHP, (2) spatial suitability classification, and (3) validation through spatial autocorrelation analysis. These results provide evidence to address the research questions regarding the effectiveness of the integrated framework in promoting sustainable and equitable infrastructure planning.
3.1 Criteria weighting results
The multi-criteria analysis employed the FAHP method to derive priority weights for the three infrastructure-related criteria: building density, road infrastructure, and public facilities. The use of FAHP, which incorporates fuzzification in expert assessments, allowed the model to capture uncertainty and variability in expert opinions more effectively than conventional AHP.
The weighting results indicate that building density emerged as the most influential factor in determining infrastructure development priorities, receiving a normalized weight of 0.604. Road infrastructure ranked second with a weight of 0.264, followed by public facilities with 0.132. These findings reflect the central role of urban density as a proxy for population concentration, economic activity, and service demand within the city.
The comparison between AHP and FAHP weighting results is presented in Table 4.
Table 4. Comparison of AHP and FAHP criteria weights
|
Criterion |
AHP Weight |
FAHP Weight |
|
Building Density |
0.620 |
0.604 |
|
Road Infrastructure |
0.240 |
0.264 |
|
Public Facilities |
0.140 |
0.132 |
While the adjustments between AHP and FAHP weights are relatively minor, the fuzzified approach provides a smoother and more adaptable distribution of weights, reducing subjectivity in decision-making. The dominance of building density underscores the importance of targeting infrastructure investments toward zones with high population intensity and urban compactness.
3.2 Spatial suitability classification and area distribution
The weighted overlay analysis, utilizing the FAHP-derived weights, generated a spatial suitability map classifying Medan City into five categories of infrastructure development priority: Very Suitable, Suitable, Moderately Suitable, Less Suitable, and Unsuitable. The distribution of spatial suitability classes is visualized in Figure 3, which clearly shows that highly suitable zones are clustered in the central districts of Medan, while the peripheral areas remain largely unsuitable for immediate infrastructure investment.
Figure 3. Spatial suitability map for infrastructure development prioritization in Medan City
The area distribution of these suitability classes is summarized in Table 5.
The results reveal that more than 54% of Medan’s territory is classified as unsuitable for immediate infrastructure development, primarily located in the peripheral areas characterized by low building density, poor road accessibility, and limited public facility presence. In contrast, the Very Suitable and Suitable zones, comprising approximately 11.55% of the total area, are concentrated in the central urban districts where infrastructure networks are more established and urban compactness is higher.
Table 5. Area distribution by infrastructure suitability class
|
Suitability Class |
Area (km²) |
Percentage (%) |
|
Very Suitable |
1,200.35 |
4.26% |
|
Suitable |
2,054.16 |
7.29% |
|
Moderately Suitable |
2,735.15 |
9.72% |
|
Less Suitable |
6,882.58 |
24.44% |
|
Unsuitable |
15,327.79 |
54.29% |
|
Total |
28,200 |
100.00% |
The transitional zones between core urban districts and peripheral areas, categorized as Moderately Suitable, represent strategic intervention areas where infrastructure development can address growing urbanization pressures while reducing spatial inequality.
This classification not only identifies priority areas but also provides a practical basis for phased infrastructure development planning. By clearly mapping spatial disparities, the model helps prevent inefficient resource allocation and supports more targeted interventions. The suitability map can serve as a valuable reference for policymakers in addressing service gaps while promoting balanced urban expansion. Such spatial insights are essential for ensuring that infrastructure investments contribute effectively to reducing inequality across Medan City.
3.3 Validation through spatial autocorrelation (Moran’s I analysis)
Ensure the robustness of the spatial suitability model, the clustering patterns of each criterion were validated using Moran's I spatial autocorrelation analysis. This validation assesses whether the distribution of building density, road infrastructure, and public facilities exhibits significant spatial clustering or random dispersion.
The analysis yielded the following results:
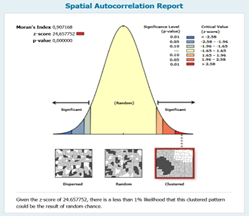
The strong positive autocorrelation for building density (Moran’s I = 0.907) confirms that high-density zones are significantly clustered, particularly within the central districts of Medan. Road infrastructure shows moderate clustering, suggesting concentrated road networks around key urban cores, while public facilities exhibit weaker clustering patterns, indicating service imbalances across peripheral zones.
The spatial clustering patterns for each criterion—building density, road infrastructure, and public facilities—are illustrated in Figures 4 (a)–(c). These spatial autocorrelation maps support the statistical results shown in Table 6 by visually confirming that high-density zones are concentrated, while public facilities are more dispersed.
Table 6. Spatial autocorrelation results (Moran’s I)
|
Indicator |
Moran's I |
Z-Score |
P-Value |
Interpretation |
|
Building Density |
0.907 |
24.65 |
< 0.01 |
Strong clustering |
|
Road Infrastructure |
0.1186 |
7.95 |
< 0.01 |
Moderate clustering |
|
Public Facilities |
0.0998 |
6.12 |
< 0.01 |
Weak clustering |
(a)
(b)
(c)
Figure 4. Spatial autocorrelation patterns for (a) building density, (b) road infrastructure, and (c) public facilities
The validation process strengthens the credibility of the spatial prioritization model by confirming that the observed patterns are not random but structurally significant. This spatial dependence highlights the need for deliberate infrastructure planning that considers existing urban clustering. The results suggest that infrastructure inequality in Medan is a systematic issue shaped by current urban dynamics. Therefore, addressing these clustered patterns through informed policy interventions becomes essential for promoting more equitable infrastructure distribution across the city.
3.4 Key observations
The following key observations emerge from the results:
These findings demonstrate the practical utility of the GIS-FAHP framework in supporting sustainable and equitable infrastructure planning by providing objective, evidence-based spatial prioritization.
3.5 Discussion
The findings of this study provide empirical support for the effectiveness of the GIS-FAHP integrated framework in prioritizing infrastructure development zones in Medan City. The analysis demonstrates that building density, road infrastructure, and public facilities contribute differently to spatial suitability, with density emerging as the most decisive factor. This outcome directly addresses the research questions regarding the relative influence of these criteria and the capacity of the proposed framework to guide infrastructure planning under conditions of uncertainty.
3.5.1 The role of building density in infrastructure prioritization
The results clearly indicate that building density holds the highest weight (0.604) among the selected criteria, affirming its critical role in identifying priority zones for infrastructure development. This finding aligns with the argument presented by Hino et al. [25] and supported by Zapata et al. [26], who emphasized urban compactness as a key determinant of infrastructure efficiency and service provision. High-density areas typically exhibit greater population concentrations, higher economic activity, and increased infrastructure demand, thereby justifying their prioritization.
The strong clustering pattern of building density, as confirmed by Moran’s I (0.907), further reinforces the structural nature of spatial inequality within Medan. This validates the use of density as a primary criterion for spatial prioritization, while also highlighting the risks of underinvestment in low-density peri-urban areas if not complemented by targeted policy interventions.
3.5.2 Accessibility and infrastructure gaps in peripheral zones
While building density dominates the weighting, the moderate contribution of road infrastructure (0.264) and the lower influence of public facilities (0.132) reveal important insights into the current state of infrastructure distribution. The relatively low weight of public facilities may be attributed to their dispersed spatial distribution and weaker proximity influence across Medan. Unlike road infrastructure and building density, public facilities such as clinics, schools, and administrative centers tend to be located sporadically, especially in peripheral districts. This diminishes their aggregated spatial effect in the suitability model, despite their strategic importance for equitable service delivery. The spatial autocorrelation analysis further supports this interpretation, with Moran’s I values indicating only weak clustering of public facilities compared to building density. This spatial imbalance mirrors findings from Yu et al. [27], who reported similar mismatches between infrastructure growth and urban expansion in the Yangtze River Delta Region.
These results underscore the need to balance infrastructure investment not only in high-density urban cores but also across transitional and peripheral zones. Prioritizing these transitional areas—classified as "Moderately Suitable"—represents a strategic opportunity for improving service access and mitigating the deepening of spatial disparities. In particular, targeted investment in public service infrastructure could enhance the role of public facilities in influencing future prioritization models and support more inclusive urban growth trajectories.
3.5.3 Advantages of FAHP for sustainable spatial decision-making
The application of FAHP in this study proved advantageous by reducing subjectivity and accommodating the inherent uncertainty in expert judgments. The original Analytic Hierarchy Process (AHP), developed by Saaty [28], provides a systematic structure for prioritizing multiple criteria through pairwise comparisons. However, AHP assumes decision-makers can provide precise values, which may not reflect the ambiguity often present in expert evaluations. To address this, fuzzy logic—pioneered by Zadeh [29]—introduces linguistic variables and membership functions that allow for more flexible, imprecise reasoning.
The integration of fuzzy logic into AHP, as demonstrated through FAHP, enables more realistic and adaptable weighting of criteria, especially in complex urban systems where data are incomplete or where expert opinions vary. This aligns with the findings of Tepic et al. [21], who showed that FAHP improves the reliability of decision-making in infrastructure contexts by better capturing expert uncertainty. By embedding FAHP into GIS-based spatial modeling, this framework achieves a balance between quantitative spatial analysis and qualitative expert insight, making it highly adaptable for infrastructure planning scenarios where both data-driven metrics and subjective judgment are critical.
3.5.4 Spatial clustering and policy sensitivity
The spatial clustering patterns identified by Moran’s I offer critical insights for targeted planning. The strong clustering of building density (Moran’s I = 0.907) confirms that population and economic activities remain concentrated in the urban core, while peripheral areas continue to face accessibility constraints. Road infrastructure exhibits moderate clustering, indicating partially connected corridors radiating from the core. In contrast, public facilities show weak clustering, suggesting that services are less spatially cohesive and may not be effectively supporting all districts.
From a policy standpoint, these results argue for differentiated infrastructure strategies. High-density clusters should receive capacity upgrades, including multi-modal transport systems, waste management, and vertical infrastructure solutions. Meanwhile, moderately suitable or dispersed areas require catalytic investment in connectivity and basic public services. This zone-specific approach aligns with broader policy frameworks that emphasize spatial equity and infrastructure-led economic strengthening, particularly in underdeveloped and rural regions [30]. For example, integrated infrastructure and agricultural development have been shown to significantly enhance local economic resilience and resource circulation in Southeast Aceh [31].
By acknowledging the spatial dependence of infrastructure demand, planners can shift from reactive, blanket investments to proactive, localized interventions that reflect the nuanced spatial dynamics of inequality across urban and peri-urban landscapes.
3.6 Policy implications for sustainable infrastructure planning
The prioritization framework developed provides practical insights for policymakers aiming to promote spatial equity and sustainable urban development. The identification of priority zones through weighted suitability mapping allows for more targeted infrastructure allocation, reducing inefficiencies and avoiding over-concentration of resources in already well-served areas.
Key policy recommendations arising include:
4.1 Conclusion
The model successfully combined GIS with the FAHP to integrate spatial analysis and expert-based multi-criteria weighting while effectively managing uncertainty. The results confirmed that building density is the most influential factor shaping infrastructure prioritization, followed by road infrastructure and public facilities. The weighted overlay analysis produced a spatial suitability map that identified clear priority zones, with central urban districts classified as highly suitable and peripheral areas as largely unsuitable under current conditions. Validation through Moran’s I spatial autocorrelation further confirmed that infrastructure patterns in Medan are structurally clustered rather than randomly distributed.
The framework directly addressed the research questions by (1) providing objective prioritization of infrastructure zones, (2) revealing the relative significance of the three key criteria, and (3) demonstrating how the integrated model supports spatial equity and sustainable urban planning. The approach offers methodological innovation by incorporating fuzzified expert input and spatial clustering validation into infrastructure planning. This strengthens the model's applicability for other rapidly urbanizing cities in Indonesia, although scalability and adaptability should be further examined through sensitivity testing and localized validation.
4.2 Policy implications
This research offers valuable insights for urban planners, policymakers, and development agencies working toward sustainable infrastructure planning in rapidly urbanizing regions like Medan. These refined recommendations are summarized in Table 7, which outlines concrete steps to institutionalize the GIS-FAHP framework within Medan’s local government planning mechanisms.
Table 7. Actionable policy recommendations for Medan City
|
Policy Focus Area |
Refined Recommendation for Medan City |
|
Prioritize High-Density Urban Cores |
Direct infrastructure investment (e.g., road upgrades, drainage systems, digital infrastructure) into central zones with > 0.6 density score as identified in suitability maps. |
|
Improve Transitional & Peripheral Zones |
Implement phased development projects in "Moderately Suitable" zones by allocating Dana Alokasi Khusus (DAK) for public facility expansion and feeder road construction. |
|
Integration into RTRW & RPJMD |
Use GIS-based suitability maps as overlays in the 2025–2045 RTRW update and embed FAHP-weighted prioritization criteria into the RPJMD’s infrastructure indicator targets. |
|
Institutionalize GIS-FAHP Tools |
Train staff at Bappeda Kota Medan to use GIS-FAHP models in infrastructure budgeting and conduct regular spatial re-analysis during the RPJMD mid-term review cycle. |
|
Align with SDGs & National Agendas |
Establish a cross-sector SDG Working Group within the planning department to ensure infrastructure allocation aligns with SDG 11, Indonesia’s “Kota Tanpa Kumuh” (KOTAKU) program, and Presidential Regulation No. 18/2020 on RPJMN. |
|
Data-Driven Planning Culture |
Develop a public-facing spatial dashboard (e.g., SIPD-based) to visualize infrastructure priorities, increase transparency, and integrate community feedback. |
4.3 Limitations and future research
While the proposed GIS-FAHP model offers a robust and replicable framework for infrastructure prioritization, this study is subject to several limitations. First, the analysis relies on expert-based weights sourced from the Mebidang Sustainable Project, which—despite institutional credibility—may not fully reflect localized planning nuances or community perspectives. The expert panel was also relatively limited in size (n = 8), which could constrain the diversity of professional insights. Expanding stakeholder participation in future studies would enhance the inclusiveness and validity of the criteria weighting process.
Second, the model is built on only three spatial criteria—building density, road infrastructure, and public facilities. While these are highly relevant, they exclude other important determinants of sustainable urban planning, such as environmental resilience (e.g., flood-prone zones, green coverage) and social vulnerability (e.g., poverty distribution, informal settlements). Third, the absence of sensitivity analysis limits the model’s ability to test stability under different weighting scenarios. Future work should incorporate additional variables and apply the framework to other urban contexts, while also conducting scenario testing or Monte Carlo simulations to evaluate the robustness of spatial outputs and decision-support quality.
[1] Wey, W.M., Huang, J.Y. (2018). Urban sustainable transportation planning strategies for livable city's quality of life. Habitat International, 82: 9-27. https://doi.org/10.1016/j.habitatint.2018.10.002
[2] Yang, J., Liu, Y., Ren, S., Fu, W., Qiu, Z. (2025). Quantifying the quality of outdoor space in high-intensity residential areas: A case study of Nanjing in China. Frontiers of Architectural Research, 14(3): 581-595. https://doi.org/10.1016/j.foar.2024.10.004
[3] Ogrodnik, K., Kolendo, Ł. (2021). Application of GIS technology and AHP to determine the areas with fully developed, compact functional and spatial structure: A case study of Bialystok, Poland. Land Use Policy, 109: 105616. https://doi.org/10.1016/j.landusepol.2021.105616
[4] de Moura, R.A.V., Delgado, J.P.M., Dourado, A.B.D.F., de Andrade, M.O. (2024). Exploring the modal integration of bike-sharing and urban rail transit: Multi-criteria evaluation in GIS for the city of Salvador (Bahia-Brazil). Case Studies on Transport Policy, 16: 101182. https://doi.org/10.1016/j.cstp.2024.101182
[5] Foroozesh, F., Monavari, S.M., Salmanmahiny, A., Robati, M., Rahimi, R. (2022). Assessment of sustainable urban development based on a hybrid decision-making approach: Group fuzzy BWM, AHP, and TOPSIS-GIS. Sustainable Cities and Society, 76: 103402. https://doi.org/10.1016/j.scs.2021.103402
[6] Dere, S., Günay, E.E., Kula, U., Kremer, G.E. (2024). Assessing agrivoltaics potential in Türkiye-A geographical information system (GIS)-based fuzzy multi-criteria decision making (MCDM) approach. Computers & Industrial Engineering, 197: 110598. https://doi.org/10.1016/j.cie.2024.110598
[7] Ally, A.M., Yan, J., Bennett, G., Lyimo, N.N., Mayunga, S.D. (2024). Assessment of groundwater potential zones using remote sensing and GIS-based fuzzy analytical hierarchy process (F-AHP) in Mpwapwa District, Dodoma, Tanzania. Geosystems and Geoenvironment, 3(1): 100232. https://doi.org/10.1016/j.geogeo.2023.100232
[8] Dossow, M., Chen, M., Spliethoff, H., Fendt, S. (2025). Advancing GIS-based suitability analysis of BtX, PtX, PBtX, and eBtX facilities using the fuzzy analytic hierarchy process. MethodsX, 14: 103194. https://doi.org/10.1016/j.mex.2025.103194
[9] Lam, C.Y., Cruz, A.M. (2024). Topological network and fuzzy AHP modeling framework for the suitability analysis of evacuation shelters: A case study in Japan. International Journal of Disaster Risk Reduction, 111: 104696. https://doi.org/10.1016/j.ijdrr.2024.104696
[10] Abedini, A., Khalili, A. (2019). Determining the capacity infill development in growing metropolitans: A case study of Urmia City. Journal of Urban Management, 8(2): 316-327. https://doi.org/10.1016/j.jum.2019.04.001
[11] Kriswardhana, W., Toaza, B., Esztergar-Kiss, D., Duleba, S. (2025). Analytic hierarchy process in transportation decision-making: A two-staged review on the themes and trends of two decades. Expert Systems with Applications, 261: 125491. https://doi.org/10.1016/j.eswa.2024.125491
[12] Saragih, D.F., Abdullah, R., Ahamad, M.S.S. (2023). Spatial multi-criteria site selection of retention pond using ordered weighted averaging combination. AIP Conference Proceedings, 2848: 080001. https://doi.org/10.1063/5.0148980
[13] Simarmata, A.M., Husien, A.M., Harahap, M., Aisyah, S. (2019). Determining land priority for housing development: Using fuzzy AHP application. In 2019 International Conference of Computer Science and Information Technology (ICoSNIKOM), (ICoSNIKOM), Medan, Indonesia, pp. 1-5. https://doi.org/10.1109/ICoSNIKOM48755.2019.9111499
[14] Nomura, L.M.N., Bressane, A., Monteiro, V.V., de Oliveira, I.V.B., Ruas, G., Negri, R.G., da Silva, A.M. (2025). Identifying priority areas for planning urban green infrastructure: A fuzzy artificial intelligence-based framework. Urban Science, 9(4): 126. https://doi.org/10.3390/urbansci9040126
[15] Isabelle Flora, F.M. (2025). Site suitability analysis for integrating large-scale hybrid photovoltaic and concentrated solar power plants in Cameroon using Monte Carlo, analytic hierarchy process, and geographic information system methods. Energy Conversion and Management: X, 25: 100871. https://doi.org/10.1016/j.ecmx.2025.100871
[16] Budzik, G., Sylla, M., Kowalczyk, T. (2025). Understanding urban cooling of blue-green infrastructure: A review of spatial data and sustainable planning optimization methods for mitigating urban heat islands. Sustainability, 17(1): 142. https://doi.org/10.3390/su17010142
[17] Elomiya, A., Křupka, J., Simic, V., Švadlenka, L., Průša, P., Jovčić, S. (2024). An advanced spatial decision model for strategic placement of off-site hydrogen refueling stations in urban areas. eTransportation, 22: 100375. https://doi.org/10.1016/j.etran.2024.100375
[18] Kontos, T.D., Zevgolis, Y.G. (2024). A fuzzy spatial multiple criteria analysis methodology for solid waste landfill siting. J — Multidisciplinary Scientific Journal, 7(4): 502-528. https://doi.org/10.3390/j7040031
[19] Sanz-Blasco, E., Gómez-Delgado, M., Clemente-Párraga, J., Aguilera-Benavente, F. (2025). Development of a plugin-based prototype for spatial explicit application of fuzzy multicriteria evaluation. Expert Systems with Applications, 276: 127199. https://doi.org/10.1016/j.eswa.2025.127199
[20] Benabbou, A. (2024). Land use suitability analysis using an approach combining GIS, regionalization, and PROMETHEE II. Annals of GIS, 30(1): 121-136. https://doi.org/10.1080/19475683.2024.2304183
[21] Tepic, G., Djelosevic, M., Brkljac, N., Vukovic, M. (2025). Probabilistic ranking of hazmat logistics subsystems under uncertainty using fuzzy AHP. Journal of Loss Prevention in the Process Industries, 94: 105563. https://doi.org/10.1016/j.jlp.2025.105563
[22] Chen, M., Dossow, M., Spliethoff, H., Fendt, S. (2025). GIS-based suitability analysis and spatial optimization for biomass-to-liquid and power-to-liquid sustainable fuel production in Australia. Journal of Cleaner Production, 489: 144615. https://doi.org/10.1016/j.jclepro.2024.144615
[23] Pang, S.E., Slik, J.F., Zurell, D., Webb, E.L. (2023). The clustering of spatially associated species unravels patterns in tropical tree species distributions. Ecosphere, 14(6): e4589. https://doi.org/10.1002/ecs2.4589
[24] Yuan, S., Mu, N., Bai, J., Zhang, H. (2024). Spatial heterogeneity analysis on distribution patterns and underlying determinants of historical rural settlements: A case study in Taihang Baxing. Heritage Science, 12(1): 395. https://doi.org/10.1186/s40494-024-01486-w
[25] Hino, K., Takeuchi, M., Fukushima, K., Kikuchi, H., Inoue, S., Lowe, M., Cerin, E. (2024). Planning strategies and infrastructure development supporting physical activity: Analyzing municipal compact city plans in Japan. Frontiers of Urban and Rural Planning, 2(1): 21. https://doi.org/10.1007/s44243-024-00049-8
[26] Zapata Campos, M.J., Kain, J.H., Oloko, M., Stenberg, J., Zapata, P. (2022). Urban qualities and residents’ strategies in compact global south cities: The case of Havana. Journal of Housing and The Built Environment, 37(1): 529-551. https://doi.org/10.1007/s10901-021-09856-7
[27] Yu, Z., Chen, L., Li, L., Zhang, T., Yuan, L., Liu, R., Wang, Z., Zang, J., Shi, S. (2021). Spatiotemporal characterization of the urban expansion patterns in the Yangtze River Delta region. Remote Sensing, 13(21): 4484. https://doi.org/10.3390/rs13214484
[28] Saaty, T.L. (1977). A scaling method for priorities in hierarchical structures. Journal of Mathematical Psychology, 15(3): 234-281. https://doi.org/10.1016/0022-2496(77)90033-5
[29] Zadeh, L.A. (1965). Fuzzy sets. Information and Control, 8(3): 338-353. https://doi.org/10.1016/S0019-9958(65)90241-X
[30] Lubis, S.N., Lubis, A.A.R.D. (2024). Enhancing Indonesian coffee trade: Strategies for navigating and reducing trade barriers. International Journal of Innovative Research and Scientific Studies, 7(3): 1248-1267. https://doi.org/10.53894/ijirss.v7i3.3231
[31] Roza, D.F., Lubis, S.N., Sihombing, L., Kesuma, S.I., Lubis, A.A.R.D. (2025). Strengthening rural economies through integrated agriculture: Evidence from Southeast Aceh using input-output modeling. International Journal of Sustainable Development and Planning, 20(4): 1595-1601. https://doi.org/10.18280/ijsdp.200421