Ani Mekaniwati*![]() | Abdul Talib Bin Bon
| Abdul Talib Bin Bon![]()
© 2025 The authors. This article is published by IIETA and is licensed under the CC BY 4.0 license (http://creativecommons.org/licenses/by/4.0/).
OPEN ACCESS
The batik industry, which combines Indonesia's cultural heritage with its creative economy, faces sustainability pressures due to pollution from synthetic dyes, excessive water consumption, and market dynamics. Amid these challenges, an organization's ability to adapt and understand the market determines its long-term competitiveness. This study begins with the context of Java, a center of batik production, where environmentally friendly practices are still developing unevenly. The research objective is to examine how dynamic capabilities (DC) and market orientation (MO) drive sustainable industry performance (SIP) through the mediating role of the green marketing mix (GMM). The methods used were a quantitative survey of 320 batik entrepreneurs (January to March 2024) with measurement and structural model testing. The findings suggest that DC enhances social and environmental performance, while MO improves economic and social performance. The GMM acts as a potent mediator, enabling internal capabilities and MO to more effectively translate into sustainability outcomes. The model explains 63% of the variance in SIP with positive predictive relevance. However, the environmental dimension lags behind the economic and social dimensions. The integration of DC, MO, and GMM needs to be accelerated through green innovations (natural dyes, process efficiency) as well as incentive and training policy support, so that the batik industry becomes more competitive and environmentally responsible.
dynamic capabilities, market orientation, green marketing, sustainable performance, batik industry, Indonesia
The batik industry represents a vital interaction between Indonesia's cultural heritage and creative economy, contributing to employment, regional development, and international trade. Since UNESCO recognized batik as an intangible cultural heritage of humanity in 2009, visibility and expectations regarding authenticity, quality, and sustainability have increased [1]. However, sustainable growth faces challenges from environmental concerns, such as the use of synthetic dyes and water-intensive processes, shifting consumer preferences for ethical products, and competition from mass-produced textiles [2].
In this dynamic context, two strategic orientations gain attention: dynamic capabilities (DC), which involve sensing opportunities, exploiting them, and reconfiguring resources, and market orientation (MO), reflecting an organization's responsiveness to market needs [3]. Although widely studied in manufacturing and services, the joint impact of these factors on sustainable performance in cultural sectors, especially Southeast Asia’s creative industries, remains limited [4]. The textile sector is one of the most harmful industries to the environment, responsible for climate change and global warming. That is to say, businesses must make use of green ways to both the economy and the environment. The sector now points at economic growth, environmental protection, and social welfare as the three pillars of sustainability [5]. An increasing number of global citizens are realizing the importance of sustainability. The change ensures a steady supply of raw material for the industry and helps in making the production more efficient. According to Müller et al. [6], this finding is being paid more attention to by researchers, especially in developing countries. The use of green technologies, conceptual design and sustainable innovations helps to reduce energy use, waste and depletion of resources [7, 8]. This will accelerate the transition to a greener environment.
Sustainable success involves economic, biological, and social aspects [9]. As part of efforts to achieve this goal, cyclical economics and natural dyes, considered more environmentally friendly, are being used. However, the Indonesian batik industry still faces numerous challenges due to the use of artificial dyes, which have a negative impact on the environment [10], as noted by UNESCO. Some alternatives include reusing old materials to protect the environment [11], creating local motifs such as Batik Betawi Seraci [12], and utilizing plant-based dyes sourced from regional areas [13].
Teece [14] and Wilden et al. [15] defined DC as an organization's capacity to leverage resources to generate new value and enhance its competitiveness. In batik, this is demonstrated by the integration of ancient techniques with modern advancements and the use of environmentally friendly technologies, which promote sustainability [16, 17]. The global market reputation of batik producers has been enhanced by the integration of green marketing strategies into their marketing mix, achieved through the use of natural dyes and effective waste management [18, 19]. The adoption of a DC framework that integrates Industry 4.0 and sustainable productivity improves operational efficiency and flexibility [20], thereby impacting the organization, the environment, and society [21]. Simultaneously, MO drives sustainability by prioritizing customer needs, thereby encouraging innovation and marketing strategies rooted in ecologically sustainable practices [22, 23].
Green marketing links environmental awareness with design, production, and promotional strategies [24]. Although this concept is increasingly discussed, related research remains limited. Empirical proof confirming the connection between DC, MO, and sustainable performance is restricted [25]. Examples include the use of natural colors, minimizing waste, and disseminating sustainability messaging to environmentally aware consumers [26]. Moreover, the mediating function of green marketing remains underexplored [27], and targeted research within the context of batik centers is also notably scarce [28].
Despite growing interest in sustainability within cultural and creative industries, existing studies tend to examine DC, MO, and green marketing in isolation, leaving a limited understanding of how these constructs interact to shape sustainability outcomes in heritage-based sectors like batik. Prior research has also been dominated by manufacturing or service contexts, resulting in theoretical frameworks that may not fully capture the cultural, artisanal, and resource-constrained nature of traditional craft industries. Therefore, a conceptual gap remains regarding how DC and MO jointly stimulate environmentally oriented marketing practices and influence multidimensional sustainability performance. Addressing this gap is crucial for advancing theory and providing evidence specific to cultural industries operating in emerging economies.
This research aims to fill these gaps by examining the correlation between dynamic capacities, MO, and sustainable performance, with green marketing serving as a mediating variable. The study was administered to batik businesses, namely those based in batik hubs in Central Java.
2.1 Hypotheses and conceptual framework of the research
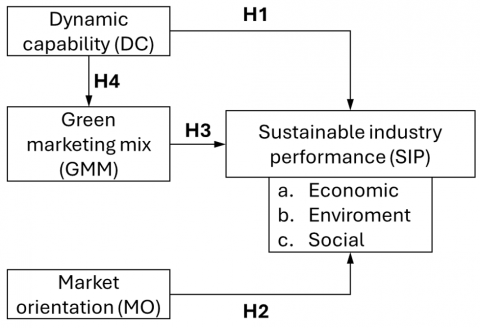
This study uses a quantitative survey design to examine the relationship between DC, MO, green marketing, and sustainable performance in the Indonesian batik industry. The survey approach is deemed appropriate because it allows for assessing the suitability of the theoretical model while simultaneously testing the proposed hypotheses. Figure 1 illustrates the conceptual framework and research ideas that underpin this study. This theory considers MO and DC as two essential elements for improving sustainable performance. Green marketing serves as a channel that enhances its impact. Its core concepts are derived from the resource-based view (RBV) and the dynamic capabilities view (DCV), which form the basis of sustainable marketing theory. This model summarizes the process of value creation with an environmental focus in the cultural industries. Through internal strengths and a focus on the market, GMM is leveraged to generate impacts that not only benefit the business but also benefit the environment. Overall, this framework tests four hypotheses to assess the direct and indirect influence of DC and MO on the industry's long-term performance.
Figure 1. Conceptual framework from this research
This research examines four hypotheses that validate a robust correlation among DC, MO, and green marketing techniques in enhancing the sustainable performance of the batik sector.
• DC is expected to directly enhance sustainable industry performance (SIP), as firms with stronger adaptive and integrative abilities tend to achieve better economic, environmental, and social outcomes.
• MO is expected to positively influence SIP, as firms attuned to market expectations tend to adopt practices that support long-term sustainability.
• GMM is projected to contribute significantly to SIP, indicating that environmentally oriented marketing actions can translate into improved sustainability across multiple dimensions.
• DC is presumed to positively affect the GMM, reflecting the organization’s ability to reconfigure its resources and adopt greener, more responsible marketing strategies.
2.2 Procedure of data collection and ethical considerations
The target population for this study was the owners and managers of batik businesses operating in Central Java Province, Indonesia. Respondents were selected using a purposive sampling technique based on specific criteria: owning and managing an active batik business, having been in operation for at least three years, and expressing a willingness to participate in the study. Data were gathered via structured questionnaires, administered both online and in person. The study took place between January and March 2024. We received 320 valid responses from a diverse range of sizes, products, and markets. Because the survey achieved a complete response from the contacted population, no additional non-response bias tests were conducted.
This study adhered to ethical standards by securing prior ethical approval. Participants provided their informed consent and were assured that their information would be kept confidential. Additionally, respondents had the option to withdraw at any time without repercussions. The research team was the only one that could access the encrypted files where the respondent data was stored safely and anonymously. The data was only used for academic reasons. We provided a summary of the results to ensure everything was clear.
2.3 Data analysis
We analyzed the data using partial least squares structural equation modeling in SmartPLS 4.0. Abdallah et al. [29] chose this methodology because it enables the evaluation of complex interactions by considering both reflective and formative components. Composite reliability (CR), average variance extraction (AVE), and Cronbach's alpha were applied to assess the reliability and validity of the measurement model. Simultaneously, the structural model was evaluated using path coefficients (R²) and bootstrapping methodology. Furthermore, the predictive efficacy of green marketing was assessed to verify its mediating effect, as evidenced by the variables Q² and f².
Table 1 presents a complete summary of the reliability and validity test results for the model in this study. The results indicate that the measurement model has a high level of reliability and validity. Cronbach-α values for all constructs were recorded above 0.5 (DC = 0.500; MO = 0.80), confirming internal consistency among the indicators. The average variance extracted (AVE) values were above 0.5 (DC = 0.796; MO = 0.680), and the CR values exceeded 0.6 (DC = 0.680; MO = 0.864), indicating convergent validity. These results highlight that batik firms with DC, a strong MO, and effective green marketing practices are better positioned to achieve enhanced economic, environmental, and social competitive sustainability outcomes. This study tested all first-order models to ensure the authenticity of estimates. The variables are DC, including sensing (DC1), learning (DC2), integration (DC3), and reconfiguration (DC4); marketing orientation (MO), including customer orientation (MO1), competitor orientation (MO2), and inter-functional coordination (MO3).
Table 1. Summary of reliability of reflective construct
|
Variables |
Indicator |
AVE |
CR |
Cronbach-α |
|
Dynamic capability (DC) |
|
0.796 |
0.680 |
0.500 |
|
|
Sensing capability (DC1) |
0.860 |
0.680 |
0.680 |
|
Learning capability (DC2) |
0.847 |
0.640 |
0.735 |
|
|
Integration capability (DC3) |
0.714 |
0.833 |
0.599 |
|
|
Reconfiguration capability (DC4) |
0.800 |
0.923 |
0.874 |
|
|
Marketing orientation (MO) |
|
0.680 |
0.864 |
0.880 |
|
|
Customer orientation (MO1) |
0.716 |
0.835 |
0.604 |
|
Competitor orientation (MO2) |
0.656 |
0.851 |
0.739 |
|
|
Inter-functional coordination (MO3) |
0.558 |
0.835 |
0.735 |
|
|
Sustainable performance industry (SIP) |
|
|||
|
|
Economics (SIPa) |
0.878 |
0.815 |
0.644 |
|
Environmental (SIPb) |
0.884 |
0.739 |
0.792 |
|
|
Social (SIPc) |
0.709 |
0.880 |
0.796 |
|
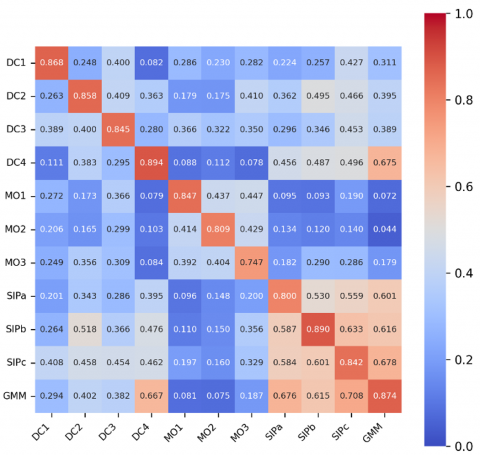
Figure 2. Cross-loading between variables
A minimum threshold of 0.70 was set for all components with intelligent features evaluated. Following, AVE values must exceed 0.50, while internal consistency (Cronbach-α and CR) should be above 0.70. Figure 2 presents the validity results based on these threshold values. The cross-loadings confirm discriminant validity, as each construct loads higher on its own factor than on any other [30]. The highest cross-loading was observed in the GMM, ranging from 0.676 to 0.708, which meets the required thresholds. This ensures each construct captures distinct phenomena.
According to Chin et al. [31], R² values are classified as high (> 0.67), moderate (0.33–0.67), weak (0.19–0.33), and unacceptable (< 0.19). Similarly, Hair et al. [32] consider R² values of 0.75 to be substantial, 0.50 to be moderate, and 0.25 to be weak for endogenous variables. Table 2 shows that three constructs, including reconfiguration capability (DC4), inter-functional coordination (MO3), and socially appropriate industrial performance (sense3, have high determinant coefficients). Six constructs, including learning capability (DC2), integration capability (DC3), client identification (MO1), competitor orientation (MO2), and two sustainability measures (SIPa, SIPb), fall into the moderate category, while detection capability (DC1) is weak. Overall, capabilities in learning, integration, reconfiguration, client recognition, competitor recognition, and inter-functional coordination emerge as the main drivers of development. The empirical results show a clear distinction among the three dimensions of SIP. Both the descriptive statistics and the coefficient of determination values indicate that environmental performance (SIPb) consistently lags behind the economic (SIPa) and social dimensions (SIPc). This is reflected in the lower R² value for SIPb (0.544), compared with 0.599 for SIPa and 0.718 for SIPc, suggesting that environmental initiatives are not yet as strongly embedded within batik firms as their economic and social efforts. These findings highlight a performance gap in the environmental domain, reinforcing the notion that ecological practices receive comparatively less attention and support.
Table 2. The coefficient of determination results from the first-order reflective
|
Variables |
R2 |
Remarks |
|
|
Chin et al. [31] |
Hair et al. [30], Hair et al. [32] |
||
|
DC1 |
0.270 |
Weak |
Weak |
|
DC2 |
0.566 |
Moderate |
Moderate |
|
DC3 |
0.534 |
Moderate |
Moderate |
|
DC4 |
0.627 |
High |
Moderate |
|
MO1 |
0.582 |
Moderate |
Moderate |
|
MO2 |
0.682 |
Moderate |
Moderate |
|
MO3 |
0.776 |
High |
Substantial |
|
SIPa |
0.599 |
Moderate |
Moderate |
|
SIPb |
0.544 |
Moderate |
Moderate |
|
SIPc |
0.718 |
High |
Moderate |
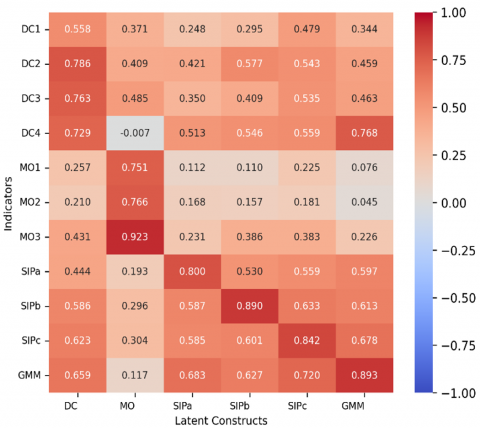
According to Sarstedt et al. [33], PLS-SEM is commonly used to model higher-order constructs that combine concrete lower-order and abstract higher-order dimensions. This study employs a reflective, formative hierarchy model, using the GMM. Using the two-stage PLS method, mediation effects were tested, ensuring more accurate estimates and stronger validity. GMM integrates eco-friendly elements, including people, processes, and products, derived from first-order constructs.
Figure 3. Cross-loading second order
In Figure 3, an indicator is considered significant if it has the highest factor loading on the target construct compared to other constructs. This figure shows that the loading factor for the DC indicators (DC1 to DC4) is higher for the DC construct than for the different constructs. The loading factor of DC2 to DC4 is 0.729-0.786, which is higher than those of the GMM (0.659), SIPa (0.444), SIPb (0.586), and SIPc (0.623). Hence, the latent variable better predicts the indicators in its block compared to others.
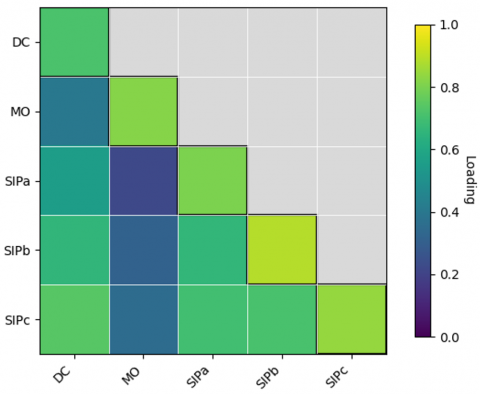
Figure 4. Fornell and Larcker’s for the second-order construct
Based on the Fornell-Larcker test (Figure 4), the constructs–energy capability (DC), MO, financially viable industrial performance (SIPa), environmentally sustainable industrial performance, and socially sustainable industrial performance, satisfy discriminant validity, as their diagonal values exceed those below them. Convergent and discriminant validity were further assessed using the HTMT test, where HTMT < 0.9 indicates validity. These tests confirm that each construct makes a significant contribution to explaining the dependent variable, as shown in Table 3.
Table 3. Heterotrait-monotrait ratio (HTMT) bootstrab - reflective second order
|
Hypotheses |
Original |
Mean |
2.5% |
97.5% |
|
|
H1a |
DC–SIPa |
-0.109 |
-0.111 |
-0.204 |
-0.005 |
|
H1b |
DC–SIPb |
0.244 |
0.241 |
0.122 |
0.362 |
|
H1c |
DC–SIPc |
0.211 |
0.212 |
0.116 |
0.309 |
|
H2a |
MO–SIPa |
0.115 |
0.114 |
0.056 |
0.176 |
|
H2b |
MO–SIPb |
0.128 |
0.128 |
0.063 |
0.194 |
|
H2c |
MO–SIPc |
0.156 |
0.156 |
0.077 |
0.223 |
|
H3a |
GMM–SIPa |
0.831 |
0.834 |
0.731 |
0.915 |
|
H3b |
GMM–SIPb |
0.490 |
0.494 |
0.379 |
0.584 |
|
H3c |
GMM–SIPc |
0.624 |
0.624 |
0.531 |
0.706 |
|
H4 |
DC–GMM |
0.810 |
0.811 |
0.775 |
0.840 |
The HTMT test results (Table 3) confirm good convergent validity and construct differentiation for DC to SPIb (0.362) and SPIc (0.309). However, the path from DC to SIPa is negative (-0.005). The negative and significant path from DC to the economic dimension of sustainable industry performance (SIPa) suggests that strengthening DC may create short-term economic pressure for batik firms. This pattern is theoretically reasonable, as the development of DC typically requires substantial investment in learning, experimentation, and resource reconfiguration, activities that increase operating costs and reduce short-term financial gains. Prior studies emphasize that capability upgrading often produces temporary inefficiencies, learning burdens, and adjustment costs before the long-term benefits emerge [35]. In the context of batik MSMEs, which generally operate with limited capital buffers, these transitional costs are likely to be more pronounced, explaining the observed adverse effect on economic SIP. The highest MO variable is SPIc at 0.223. Meanwhile, the GMM shows values ranging from 0.584 to 0.840 across all SPI.
This study presents four main hypotheses: three directly related to the dependent and independent variables, and one involving the interaction effects of mediating factors. Hypotheses regarding direct effects are discussed first, followed by those related to mediating factors, in line with Henseler et al. [36], who emphasized the importance of assessing direct effect hypotheses before conducting analyses with interactive variables in PLS path modeling. All main and sub hypotheses regarding the unidirectional relationships between the dependent and independent factors are supported by the findings, as shown in Table 4. These include the relationships between DC, MO, and GMM with sustainability outcomes. These relationships are significant with p-values less than 0.01, except for the hypotheses regarding DC and economic sustainability (H1a), which were rejected. This study tests hypotheses on the links between DC, MO, green marketing mix (GMM), and SIP. Findings show that DC has a strong influence on GMM but only limited effects on SIP, particularly in environmental and social aspects. MO demonstrates weak impacts on both GMM and SIP, with the lowest effect on environmental SIP. Conversely, GMM acts as the primary driver of SIP, with notable impacts on both economic and social dimensions, although its effect on ecological SIP remains modest. Bias-corrected confidence intervals confirm these results, including the most minor yet statistically significant path from DC to SIPc. Overall, the study highlights GMM’s pivotal role in promoting sustainable performance, while underscoring the need for more robust strategies to address environmental outcomes.
Table 4. Hypotheses testing results
|
Hypotheses |
Original |
SD/SE |
t |
p |
R2 |
f2 |
Q2 |
Name |
|
|
H1a |
DC–SIPa |
-0.109 |
0.050 |
2.168 |
0.015 |
0.599 |
0.011 |
0.375 |
NE |
|
H1b |
DC–SIPb |
0.244 |
0.061 |
4.003 |
0.000 |
0.544 |
0.046 |
0.422 |
** |
|
H1c |
DC–SIPc |
0.211 |
0.052 |
4.083 |
0.000 |
0.718 |
0.056 |
0.500 |
** |
|
H2a |
MO–SIPa |
0.115 |
0.031 |
3.698 |
0.000 |
0.599 |
0.028 |
0.375 |
** |
|
H2b |
MO–SIPb |
0.128 |
0.034 |
3.786 |
0.000 |
0.544 |
0.031 |
0.422 |
* |
|
H2c |
MO–SIPc |
0.156 |
0.037 |
4.218 |
0.000 |
0.718 |
0.075 |
0.500 |
** |
|
H3a |
GMM–SIPa |
0.831 |
0.047 |
17.785 |
0.000 |
0.599 |
0.669 |
0.375 |
*** |
|
H3b |
GMM–SIPb |
0.490 |
0.052 |
9.398 |
0.000 |
0.544 |
0.204 |
0.422 |
** |
|
H3c |
GMM–SIPc |
0.624 |
0.046 |
13.592 |
0.000 |
0.718 |
0.536 |
0.500 |
*** |
|
H4 |
DC–GMM |
0.810 |
0.017 |
47.240 |
0.000 |
0.611 |
1.497 |
0.461 |
*** |
Table 5. Confidence interval bias results
|
Hypotheses |
Sample |
Mean |
Bias |
2.5% |
97.5% |
Name |
|
|
H1a |
DC–SIPa |
-0.109 |
-0.112 |
-0.003 |
-0.204 |
-0.005 |
* |
|
H1b |
DC–SIPb |
0.244 |
0.241 |
-0.003 |
0.122 |
0.362 |
** |
|
H1c |
DC–SIPc |
0.211 |
0.21 |
-0.002 |
0.116 |
0.309 |
** |
|
H2a |
MO–SIPa |
0.115 |
0.114 |
-0.001 |
0.056 |
0.176 |
** |
|
H2b |
MO–SIPb |
0.128 |
0.128 |
0.0 |
0.063 |
0.194 |
** |
|
H2c |
MO–SIPc |
0.156 |
0.156 |
0.0 |
0.077 |
0.223 |
** |
|
H3a |
GMM–SIPa |
0.831 |
0.835 |
0.004 |
0.731 |
0.915 |
** |
|
H3b |
GMM–SIPb |
0.49 |
0.494 |
0.005 |
0.379 |
0.584 |
** |
|
H3c |
GMM–SIPc |
0.624 |
0.626 |
0.002 |
0.531 |
0.706 |
** |
|
H4 |
DC–GMM |
0.81 |
0.812 |
0.002 |
0.775 |
0.84 |
** |
Table 5 reports confidence intervals at 2.5%–95%. Relationships are significant when zero is not included, while intervals crossing zero indicate insignificance. Bias-corrected intervals confirm significance for several hypotheses, including DC–SPIb, DC–SPIc, MO–SPIa, MO–SPIb, MO–SPIc, DC–GMM, GMM–SPIa, GMM–SPIb, and GMM–SPIc.
Table 6. Convergent validity of the second order of reflective variables
|
Variables |
Cronbach-α |
$\rho_{\mathrm{a}}$ |
Composite |
Average Variance Extracted |
|
DC |
0.798 |
0.811 |
0.796 |
0.500 |
|
MO |
0.835 |
0.838 |
0.864 |
0.680 |
|
SIPa |
0.815 |
0.844 |
0.878 |
0.644 |
|
SIPb |
0.739 |
0.755 |
0.884 |
0.792 |
|
SIPc |
0.796 |
0.806 |
0.880 |
0.709 |
This study investigates the mediating role of the GMM in the proposed model. Results show that GMM mediates the link between DC and sustainable economic and environmental performance, as well as between MO and SPIb and SPIc performance. Mediation was tested using PLS-SEM with bootstrapping, ensuring robustness through valid measurement indicators (factor loading, CR, convergent validity). Table 6 confirms strong empirical support for GMM as a mediating mechanism.
This study examines the factors influencing SIP in the batik sector of Central Java, Indonesia. The findings highlight the interplay of DC, MO, and GMM in shaping economic, social, and environmental sustainability. DC, particularly sensing, learning, and integration, contribute positively to social and ecological outcomes, although reconfiguration remains underdeveloped. This suggests that batik firms can recognize opportunities and adopt sustainable practices but face challenges in restructuring processes for long-term adaptation. Strengthening reconfiguration is therefore essential to advance green technologies and sustainable production methods.
MO greatly enhances economic and social sustainability by fostering a robust emphasis on customers and competitors. It has a weaker effect on environmental performance, highlighting the importance of taking proactive steps to protect the environment, such as reducing waste, using environmentally friendly materials, and promoting cleaner practices. The GMM variable also helps DC and MO turn internal strengths into measurable results. You can achieve this by developing new, eco-friendly products, establishing competitive prices, and effectively advertising them. There are still a few new products or ways to discuss the environment in the batik industry. The batik industry demonstrates a high level of social responsibility. However, its environmental sustainability is slightly lower. These results indicate that community involvement is already strong; however, further efforts are needed to mitigate environmental impacts and ensure the industry's long-term sustainability.
DC, MO, and the GMM collectively enhance SIP in Central Java’s batik sector. While DCs support social and environmental outcomes, weak reconfiguration limits adaptability. MO drives economic and social performance, and GMM translates DC and MO into measurable sustainability outcomes. Policy support and innovation are crucial for long-term resilience. Practitioners should strengthen DC, MO, and GMM to achieve sustainability goals, while policymakers need to provide incentives, regulations, and training for eco-friendly practices. For academia, this study presents a framework that links DC, MO, and GMM to SIP, with potential for broader application. This study focuses on Central Java’s batik sector with a quantitative, short-term approach. Future research should be conducted across multiple regions and industries, utilizing mixed or longitudinal methods.
[1] Harsanto, B., Permana, C.T. (2020). Sustainability-oriented innovation (SOI) in the cultural village: An actor-network perspective in the case of Laweyan Batik Village. Journal of Cultural Heritage Management and Sustainable Development, 11(3): 297-311. https://doi.org/10.1108/jchmsd-08-2019-0102
[2] Mukhopadhyay, S. (2025). Balancing tradition and challenges in Indian handlooms: The way ahead. In SDGs and Textiles, pp. 375-397. https://doi.org/10.1007/978-981-96-6530-3_18
[3] Alam, M.M., Mazumder, M.S.N., Mofasser, A.Z.M., Ibn Sayed, N., Mia, R. (2025). Sustainable fashion through naturally tie-dyed textiles. In Advancements in Textile Coloration, pp. 229-248. https://doi.org/10.1007/978-981-96-5091-0_8
[4] Underwood, J., Islam, S. (2024). Garment machinery for regenerative manufacturing. In Sustainable Innovations in the Textile Industry, pp. 405-426. https://doi.org/10.1016/b978-0-323-90392-9.00017-3
[5] Muñoz-Torres, M.J., Fernández-Izquierdo, M.Á., Rivera-Lirio, J.M., Ferrero-Ferrero, I., Escrig-Olmedo, E. (2020). Sustainable supply chain management in a global context: A consistency analysis in the textile industry between environmental management practices at company level and sectoral and global environmental challenges. Environment, Development and Sustainability, 23(3): 3883-3916. https://doi.org/10.1007/s10668-020-00748-4
[6] Müller, J.M., Buliga, O., Voigt, K.I. (2018). Fortune favors the prepared: How SMEs approach business model innovations in Industry 4.0. Technological Forecasting and Social Change, 132: 2-17. https://doi.org/10.1016/j.techfore.2017.12.019
[7] Zimon, D., Madzik, P., Sroufe, R. (2020). The influence of ISO 9001 & ISO 14001 on sustainable supply chain management in the textile industry. Sustainability, 12(10): 4282. https://doi.org/10.3390/su12104282
[8] Sitorus, A., Fauzi, A., Ramadhan, G., Kuswandi, R., Hasan, A.R., Karyadi, A. (2018). Conceptual design of harvesters knife for Chinese spinach (Ipomoea reptans poir.): CAD approach. In 2018 International Conference on Computing, Engineering, and Design (ICCED), Bangkok, Thailand, pp. 7-12. https://doi.org/10.1109/icced.2018.00012
[9] Raharjo, K. (2019). The role of green management in creating sustainability performance on the small and medium enterprises. Management of Environmental Quality: An International Journal, 30(3): 557-577. https://doi.org/10.1108/meq-03-2018-0053
[10] Ditahardiyani, P., Indrianingsih, A.W., Darsih, C., Lestari, D.W. (2025). Batik and textile supply chain management based on United Nations’ sustainable development goals: Indonesian case studies. In Sustainable Textiles: Production, Processing, Manufacturing & Chemistry, pp. 117-153. https://doi.org/10.1007/978-3-031-80240-9_6
[11] Shindhal, T., Rakholiya, P., Varjani, S., Pandey, A., Ngo, H.H., Guo, W., Ng, H.Y., Taherzadeh, M.J. (2020). A critical review on advances in the practices and perspectives for the treatment of dye industry wastewater. Bioengineered, 12(1): 70-87. https://doi.org/10.1080/21655979.2020.1863034
[12] Syahid, A., Fauzi, A.M., Ismayana, A. (2024). Sustainability investigation of batik production at Seraci Batik Betawi. IOP Conference Series: Earth and Environmental Science, 1358(1): 012037. https://doi.org/10.1088/1755-1315/1358/1/012037
[13] Novita, N., Dahlan, D., Bahi, M., Erni, E. (2021). Preliminary study of local plant utilization (Mahogany) for natural textile dyes. IOP Conference Series: Earth and Environmental Science, 667(1): 012105. https://doi.org/10.1088/1755-1315/667/1/012105
[14] Teece, D. (1999). Dynamic capabilities and strategic management. In Knowledge and Strategy, pp. 77-115. https://doi.org/10.1016/b978-0-7506-7088-3.50009-7
[15] Wilden, R., Gudergan, S., Lings, I. (2019). The interplay and growth implications of dynamic capabilities and market orientation. Industrial Marketing Management, 83: 21-30. https://doi.org/10.1016/j.indmarman.2018.11.001
[16] Feng, L., Zhao, Z., Wang, J., Zhang, K. (2022). The impact of knowledge management capabilities on innovation performance from dynamic capabilities perspective: Moderating the role of environmental dynamism. Sustainability, 14(8): 4577. https://doi.org/10.3390/su14084577
[17] Ratnawati, A., Kholis, N. (2021). Developing innovation capability to improve marketing performance in Batik SMEs during the COVID-19 pandemic. In Lecture Notes in Networks and Systems, pp. 309-323. https://doi.org/10.1007/978-3-030-79725-6_30
[18] Dangelico, R.M., Vocalelli, D. (2017). “Green Marketing”: An analysis of definitions, strategy steps, and tools through a systematic review of the literature. Journal of Cleaner Production, 165: 1263-1279. https://doi.org/10.1016/j.jclepro.2017.07.184
[19] Demir, H., Sharma, S.K. (2021). Green chemistry and water remediation. In Green Chemistry and Water Remediation: Research and Applications, pp. 1-33. https://doi.org/10.1016/b978-0-12-817742-6.00001-3
[20] Hassan, M.G., Akanmu, M.D., Yusoff, R.Z. (2018). Technological integration and sustainable performance in manufacturing firms. International Journal of Technology, 9(8): 1639. https://doi.org/10.14716/ijtech.v9i8.2747
[21] Shirvanimoghaddam, K., Motamed, B., Ramakrishna, S., Naebe, M. (2020). Death by waste: Fashion and textile circular economy case. Science of the Total Environment, 718: 137317. https://doi.org/10.1016/j.scitotenv.2020.137317
[22] Azzaz, A., Malki, M., Slama, Z., Dennouni, N. (2025). Social information retrieval using linked data and deep learning. Engineering, Technology & Applied Science Research, 15(3): 23360-23366. https://doi.org/10.48084/etasr.10551
[23] Fatoki, O. (2019). Green marketing orientation and environmental and social performance of hospitality firms in South Africa. Foundations of Management, 11(1): 277-290. https://doi.org/10.2478/fman-2019-0023
[24] Zameer, H., Wang, Y., Yasmeen, H. (2024). Strengthening green competitive advantage through organizational learning and green marketing capabilities in a big data environment: A moderated-mediation model. Business Process Management Journal, 30(6): 2047-2072. https://doi.org/10.1108/bpmj-09-2023-0691
[25] Forliano, C., Battisti, E., de Bernardi, P., Kliestik, T. (2025). Mapping the greenwashing research landscape: A theoretical and field analysis. Review of Managerial Science, 19(11): 3407-3456. https://doi.org/10.1007/s11846-025-00856-3
[26] Nguyen-Viet, B. (2022). The impact of green marketing mix elements on green customer based brand equity in an emerging market. Asia-Pacific Journal of Business Administration, 15(1): 96-116. https://doi.org/10.1108/apjba-08-2021-0398
[27] Nguyen-Viet, B. (2022). Understanding the influence of eco-label, and green advertising on green purchase intention: The mediating role of green brand equity. Journal of Food Products Marketing, 28(2): 87-103. https://doi.org/10.1080/10454446.2022.2043212
[28] Trang, P.N.T., Hanh Le, A.N., Tan, L.P., Sung Cheng, J.M. (2023). Sustainable marketing management: Using bibliographic coupling to review the state-of-the-art and identify future research prospects. Journal of Business-to-Business Marketing, 30(1): 63-85. https://doi.org/10.1080/1051712x.2023.2188134
[29] Abdallah, W., Harraf, A., Ghura, H., Abrar, M. (2024). Financial literacy and small and medium enterprises performance: The moderating role of financial access. Journal of Financial Reporting and Accounting, 23(4): 1345-1364. https://doi.org/10.1108/jfra-06-2024-0337
[30] Hair, J., Hollingsworth, C.L., Randolph, A.B., Chong, A.Y.L. (2017). An updated and expanded assessment of PLS-SEM in information systems research. Industrial Management & Data Systems, 117(3): 442-458. https://doi.org/10.1108/imds-04-2016-0130
[31] Chin, W.W., Marcolin, B.L., Newsted, P.R. (2003). A partial least squares latent variable modeling approach for measuring interaction effects: Results from a Monte Carlo simulation study and an electronic-mail emotion/adoption study. Information Systems Research, 14(2): 189-217. https://doi.org/10.1287/isre.14.2.189.16018
[32] Hair, J.F., Ringle, C.M., Sarstedt, M. (2013). Partial least squares structural equation modeling: Rigorous applications, better results and higher acceptance. Long Range Planning, 46(1-2): 1-12. https://doi.org/10.1016/j.lrp.2013.01.001
[33] Sarstedt, M., Ringle, C.M., Smith, D., Reams, R., Hair, J.F. (2014). Partial least squares structural equation modeling (PLS-SEM): A useful tool for family business researchers. Journal of Family Business Strategy, 5(1): 105-115. https://doi.org/10.1016/j.jfbs.2014.01.002
[34] Ramayah, T., Cheah, J., Chuah, F., Ting, H., Memon, M.A. (2018). Partial Least Squares Structural Equation Modeling (PLS-SEM) Using SmartPLS 3.0: An Updated Guide and Practical Guide to Statistical Analysis (2nd ed.). Kuala Lumpur, Malaysia: Pearson.
[35] Bell, M., Figueiredo, P.N. (2012). Innovation capability building and learning mechanisms in latecomer firms: Recent empirical contributions and implications for research. Canadian Journal of Development Studies/Revue Canadienne D'études du Développement, 33(1): 14-40. https://doi.org/10.1080/02255189.2012.677168
[36] Henseler, J., Hubona, G., Ray, P.A. (2016). Using PLS path modeling in new technology research: Updated guidelines. Industrial Management & Data Systems, 116(1): 2-20. https://doi.org/10.1108/imds-09-2015-0382