Saleh Al-Omery![]()
© 2025 The author. This article is published by IIETA and is licensed under the CC BY 4.0 license (http://creativecommons.org/licenses/by/4.0/).
OPEN ACCESS
Planning standards for residential neighborhoods have historically evolved in response to regional and temporal factors, often shaped by economic, social, environmental, and political dynamics. However, traditional planning frameworks have frequently failed to incorporate newly emerging variables—such as technological innovation, artificial intelligence, and the increasing prevalence of environmental hazards, including earthquakes, floods, and landslides. This omission has raised concerns regarding the adaptability, sustainability, and resilience of urban residential environments in the face of contemporary challenges. In this study, the impact of emerging variables on existing residential neighborhood planning standards was examined through a case study of the Kingdom of Saudi Arabia. Particular attention was given to the extent to which these standards reflect or overlook the dynamic requirements of modern urban development. The findings are expected to contribute to the advancement of comprehensive planning models that align more closely with the complexities of contemporary urbanization, particularly within rapidly developing regions. By integrating emerging variables into planning protocols, residential neighborhoods may be rendered more adaptive, sustainable, and capable of withstanding evolving environmental and technological pressures. The proposed framework holds the potential to support long-term urban stability in Saudi Arabia and to serve as a reference for similar initiatives globally.
emerging variables, planning standards, residential neighborhoods, Kingdom of Saudi Arabia
With the rapid changes occurring globally across economic, social, environmental, and political dimensions, it has become imperative to reconsider the planning standards that govern the design and development of residential neighborhoods. These standards are no longer fixed nor fully capable of meeting the needs of the modern era, which necessitates adopting a more flexible and adaptable approach in response to emerging variables. In this context, technological advancement and artificial intelligence play a pivotal role in improving quality of life within cities and promoting the development of residential neighborhoods by providing more sustainable and intelligent urban environments capable of comprehensively meeting residents’ needs [1].
Nevertheless, environmental challenges such as earthquakes, flash floods, and landslides necessitate the adoption of innovative and effective solutions to ensure the safety of residents and the stability of urban infrastructure. These challenges call for a planning approach that is adaptive to such risks [2, 3]. Amidst these shifts, the Kingdom of Saudi Arabia is witnessing rapid transformations across multiple sectors, making it an ideal case for studying the impact of these variables on residential neighborhood planning policies. The Kingdom is actively seeking to develop planning standards aligned with these transformations, thus supporting sustainable urban development in accordance with Vision 2030.
Accordingly, this study addresses the following research question:
To what extent do residential neighborhood planning standards in the Kingdom of Saudi Arabia respond to emerging environmental, technological, and social variables?
1.1 Research objectives
In light of the evolving environmental, technological, and social context, this study aims to achieve the following objectives:
•To assess the gap between current planning standards and emerging variables.
•To propose an updated regulatory framework that aligns with future changes.
•To promote the integration of sustainability and urban resilience within residential planning.
1.2 Research problem
This study assumes that the traditional planning standards adopted in the Kingdom of Saudi Arabia are no longer sufficient to address contemporary challenges—environmental, social, or technological. The core issue lies in the absence of a flexible and modern framework that accommodates these variables and keeps pace with the rapid transformations in urban development. Therefore, the central question arises: Can a more adaptive and dynamic standards framework be developed to support the creation of sustainable and resilient residential neighborhoods?
By analyzing the current situation and assessing the impact of new variables, it is possible to formulate advanced planning standards that support sustainable development in residential areas across the Kingdom. This can be achieved through urban planning strategies that are aligned with both global and local developments.
Amid rapid urban transformations, reviewing the literature related to planning standards for residential neighborhoods is essential to understand the extent to which these standards can respond to emerging variables. Some reports [4] have emphasized the importance of sustainable and inclusive planning that addresses environmental, social, and economic challenges. Other studies [5-8] have classified planning standards into qualitative, quantitative, and developmental categories and discussed concepts such as smart cities and resilient cities, which represent direct responses to contemporary technological and social changes. Some studies [9] have highlighted the importance of technological advancement and digital transformation in shaping new models for neighborhood planning. In contrast, other studies [10-12] have examined the impact of social variables, including internal migration and women's empowerment, on the distribution of services and the form of urban development.
2.1 Emerging variables
Emerging variables refer to newly introduced factors that directly and indirectly influence urbanization and they must be taken into account. These include positive variables, such as technological advancements and the rise of artificial intelligence, which can enhance urban life and make daily living easier for residents. On the other hand, negative variables include environmental disasters that threaten urban areas such as rockslides, earthquakes, and floods. Each of these risks requires specific mitigation strategies that aim to minimize their impact on both residents and residential zones. These emerging variables can be classified into four categories.
a) Environmental variables
These variables are among the most prominent factors that negatively impact urbanization and represent some of the most urgent challenges of our time. They directly affect the basic political and social needs of individuals. These environmental variables include epidemics, famines, earthquakes, volcanoes, problematic soils, tsunamis, landslides and rockslides, sand dune movement, floods, torrents, storms and hurricanes, droughts, forest fires, climate change, and the unfair use of environmental resources [13].
The impact of environmental variables on urbanization is as follows:
•Loss of drinking water stocks.
•Decline in the productivity of agricultural land.
•Destruction of coastal environments.
•Economic degradation of societies.
•Depletion of non-renewable sources.
•High temperatures at the surface level of the Earth.
•Depletion and perforation of the protective layer that shields the Earth.
•The disappearance of forests due to climatic and environmental changes.
•Ecological imbalance and loss of biodiversity.
b) Developed urban variables
Urban planning in Egyptian cities faces numerous environmental challenges and variables. One modern trend is the increasing use of advanced technologies in planning, particularly through various software applications in the fields of Geographic Information Systems (GIS) and remote sensing. These technologies contribute to building sustainable urban communities that are adaptable to environmental risks, making urban areas more resilient and capable of enduring over long periods.
This approach ensures that all generations can benefit from urban resources while aligning with the Sustainable Development Goals (SDGs), which were launched in 2015 as a global action plan for people and the planet toward prosperity, as stated in the charter. The actual implementation of these goals began in January 2016, as illustrated in Figure 1.
Figure 1. United Nations SDGs [14]
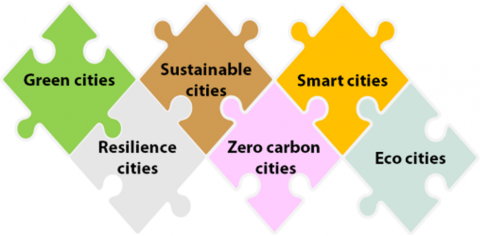
As a result, many urban planning trends have emerged in an effort to address the depletion of environmental resources, which threatens the stability and continuity of both the environmental and economic systems. Modern global trends in city planning can be summarized as follows (Figure 2):
•Sustainable cities
•Green cities
•Smart cities
•Eco-cities
•Resilient cities
c) New social variables
Countries and societies are accelerating their efforts to achieve higher rates and levels of development, improve quality of life, and enhance human development. However, development cannot occur without relying on people, as they are the ones who create, direct, and ultimately benefit from it. With the rapid changes taking place around the world, individuals are not isolated from these developments. There have been significant shifts in the socioeconomic structure of societies, resulting in both positive and negative outcomes.
The new social variables include the following:
•Women's empowerment: Women now play an increasingly vital role in society. The manifestations of women’s empowerment vary from one society to another. For example, in the Kingdom of Saudi Arabia, notable progress includes the decision to allow women to drive cars — a significant step toward gender equality.
•Rapid population growth: Some neighborhoods have struggled with the problem of urban sprawl, especially those that have developed as small, scattered communities. This makes it difficult to provide services equally to all residents, particularly in low-income countries.
•Internal migration: According to a 2014 World Bank report, internal migration has been found to contribute positively to both origin and destination areas—contrary to earlier economic theories, which often view it as a socially, economically, and politically destabilizing process [15-17].
These emerging social variables have both positive and negative effects on urbanization. For instance, they may contribute to the formation of slums and the failure to achieve social justice. In many developing countries, the unequal provision of services across urban areas has led to the spread of informal settlements. Migration areas often emerge on the outskirts of cities, where residents build small and simple housing structures using available natural resources, frequently without adherence to formal urban planning or architectural standards.
d) New technological variables
Technology has evolved gradually throughout the ages and has been closely linked to the emergence of agriculture and early agricultural civilizations, which were concentrated in regions such as Egypt, Mesopotamia, India, and China.
The significant development of technology can be traced back to the mid-eighteenth century, with the rise of artisans, technicians, and skilled workers. This technological advancement was closely associated with the Industrial Revolution, which marked a major turning point in human history. Table 1 shows service in its traditional and modern forms and future expectations.
Table 1. The traditional and modern forms of service and the expectation of its future reflection
|
Service |
Traditional Shape |
Recent Developments |
Future Expectations for Transformation |
|
Education |
Classrooms, lecture halls, schools, and universities |
Libraries, galleries, and museums; broadcast studios for educational material; spaces for viewing and holding teleconferences; websites; virtual libraries; and educational software packages |
Changing the sizes of educational buildings, the type of space, and its distribution |
|
Health |
Hospitals (general and specialized), clinics, dispensaries, and health centers |
Medical records, medical consultations, examination and follow-up of diseases remotely, reference systems for storing medical records on communication networks, artificial intelligence systems for medical service, disease description, diagnosis, prescription of treatment via the Internet and analyses via a mobile car that reaches the patient’s location |
Reducing the areas of health buildings at their level and creating health convalescence areas outside the cities |
|
Commerce |
Traditional shops, malls, and markets |
Shopping malls through TV or radio advertising, electronic vending machines, and online sales sites |
Lack of store spaces and their transformation into warehouses and their lack of connection to a specific place or hierarchy |
|
Transportation and communication |
Complex network of roads and different means of transportation |
Internet connectivity (remote services reach home) |
The reduction in service locations will reduce the use of the road network and various means of transportation. |
|
Entertainment |
Theaters, cinemas, sports arenas, and stadiums |
Music recording studios, places to listen to recorded music and watch video films, entertainment broadcast studios, living rooms and cafes, programmed video equipment, and sites for obtaining audio or film material on demand |
Increasing recreational areas, green spaces, clubs, and open areas and reducing recreational buildings such as cinemas and others |
As a result of the rapid and significant process of technological and scientific development—which cannot be resisted by the non-human and moral components of humanity—this development has impacted several manifestations of scientific and technological progress in any society, concentrated in three main areas as follows:
•Means of transportation and movement (transportation systems of various types).
•Non-structural technology and construction (development of various non-structural methods alongside technological advancements through the ages).
•Non-product technology and manufacturing (use of the latest non-product methods and modern tools and equipment in the development and manufacturing processes of all non-structural and technologically advanced components).
The effects of new technological changes can be summarized as follows:
•Self-sufficiency of cities, as technological development in agriculture, energy (particularly clean energy), and industrialization has led to an increased ability of residents to produce their own needs in a decentralized manner.
•Digital transformation of government institutions and public services using closed record chains.
•City information modeling, based on principles very similar to the Building Information Modeling (BIM) system.
•Reduced need for certain physical spaces, due to the rise of remote work and distance learning.
•Changes in urban spaces and land use.
•Changes in spatial relationships and the pattern of service distribution.
•Impact on traffic networks, including the emergence of digital routes, a decrease in the number of trips to various urban spaces, changes in activity requirements for communication, and variations in walking distances.
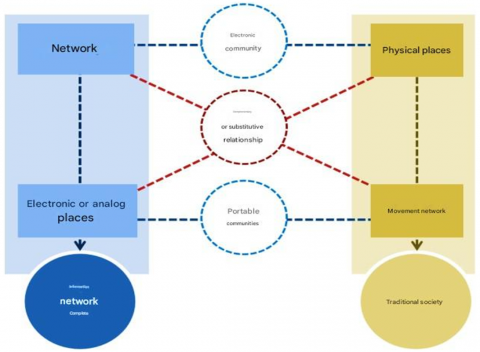
Figure 3 shows the relationships created by the impact of technology on urbanism.
Figure 3. Relationships created by the impact of technology on urbanism
2.2 Planning standards for residential neighborhoods
Planning standards are among the concepts closely linked to the current global population increase. Their role lies in guiding housing development plans to meet housing needs and promote the transition toward sustainable housing communities. Accordingly, there has been a growing need to review existing planning standards as one of the potential solutions to housing problems. A standard is typically defined as a criterion or reference used as a tool for testing, measuring weight, length, or other attributes to determine the required level or degree. It represents a constant reference value or model upon which other variable elements are assessed or calibrated, serving as a validated guide for what an object or process should be [18]. Planning standards are divided into three types as follows:
•Qualitative standards: concerned with mixed-use development and the quality of outdoor spaces.
•Quantitative standards: these include densities, building heights, coverage ratios, setbacks, areas, and access, as well as service and route parameters.
•Development control standards: these standards must be applied in relation to various forms of development, including residential development standards in conservation areas and all types of development.
A sustainable residential community is a group of housing units of various styles based on sustainable planning standards that enhance the quality of life for residents. It provides opportunities for a variety of options that consider the quality of essential services, shopping and commercial activities, entertainment events, and access to workplaces. Such communities are characterized by diversity, flexibility, solidarity, mixed uses, and a strong emphasis on walkability. The United Nations [4] has developed four basic principles for sustainable residential neighborhoods as follows:
•Vibrant streets: Support and enhance street life through a variety of activities and events, with an emphasis on pedestrian and bicycle traffic, as well as public transportation. Streets should be organized hierarchically, with both arterial and local roads within neighborhoods, and should include adequate street space and a street network covering at least 30% of residential neighborhoods.
•Pedestrian traffic: Enhance pedestrian movement by encouraging walking and creating high-density public spaces with mixed-use developments. This promotes proximity between homes, workplaces, and services, reduces reliance on cars, and helps alleviate traffic congestion.
•Facilitation: Provide housing with varied and flexible prices and sizes to accommodate different income levels. Between 20% and 50% of the residential area should be allocated to low-cost and mixed-use housing. This helps reduce the waste of time and resources by promoting accessibility and inclusivity.
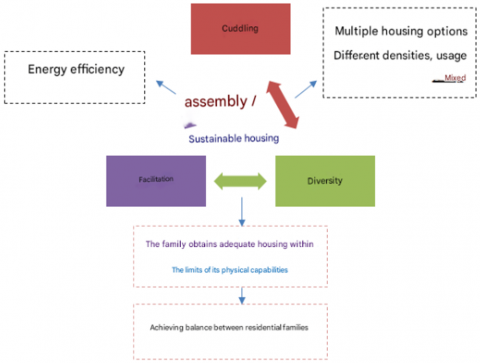
These sustainable planning standards are classified into social, environmental, and economic categories, which are interconnected and mutually supportive. They serve as key influences in achieving urban sustainability standards, taking into account that some of these standards are digital, while others are non-digital. Figure 4 shows the essential elements of a sustainable residential community.
Figure 4. Essential elements of a sustainable residential community
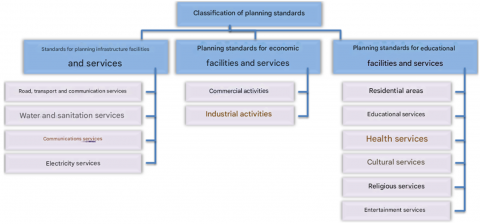
Urban planning is considered one of the important civilized aspects in the life of peoples and nations. Since this type of planning has not yet taken its share of research and application in many countries of the developing world in general and the Arab countries in particular, it is necessary to dive into the merits of this important topic. Therefore, this study aims to focus on these planning standards. Talking about urban planning is talking about planning standards and vice versa, since the concept of standards is relative and varies across environments, regions, and time periods. Figure 5 shows the schematic of criteria classification.
Figure 5. Classification of schematic criteria
This chapter presents the methodological framework adopted to achieve the research objectives and analyze the impact of emerging variables on planning standards for residential neighborhoods in the Kingdom of Saudi Arabia. The study adopts a comparative analytical approach, analyzing the planning standards adopted in the Kingdom during the years 2005 and 2016 and comparing them in light of recent variables. Two types of data were utilized. The primary data were collected from official regulations and systems issued by the Ministry of Municipal and Rural Affairs and Housing, as well as approved regional plans. The secondary data included documents related to Vision 2030, reports from the General Authority for Statistics, academic references, and global standards such as UN-Habitat urban development indicators and SDGs.
Comparative analysis was applied to the two official versions of the standards (2005 and 2016). An analytical matrix was developed to link planning standards with emerging variables. Tables and charts were used to illustrate changes and areas of impact. The study covers the period from 2005 to 2023, as it represents the phase of the most significant shifts in planning and urban policies. To ensure the reliability of results, several methods were employed in this study. Triangulation was used to compare data from multiple official sources. Expert review was gathered from urban planning specialists to validate the proposed findings. The selected methodology was justified by the nature of the research, which necessitates linking existing standards with emerging variables and exploring shortcomings and gaps within current planning practices.
4.1 Elements of the residential environment in Saudi Arabia
A residential group is a cluster of residential buildings that accommodates family communities totaling between 900 and 1,200 inhabitants, although the number may be slightly more or less depending on specific conditions. The concept of a residential neighborhood was originally based on walkability, particularly the walking distance for elementary school students. A maximum distance of 500 meters is commonly used to define the neighborhood’s geographical extent, ensuring easy access to schools and essential services.
However, this concept may no longer be entirely applicable, as cars are now frequently used for both commuting and school transport. Modern residential neighborhoods typically house between 3,000 and 6,000 people and cover an area of approximately 25 to 100 hectares. The required land area decreases as population density increases, and the neighborhood model is not rigid—it is flexible and adaptable to the existing urban context.
4.2 Criteria for locating the neighborhood center
The siting of the neighborhood center is based on two primary sets of standards: environmental and urban.
The environmental standards are as follows:
•Avoid areas with steep slopes; the slope should not exceed 12%.
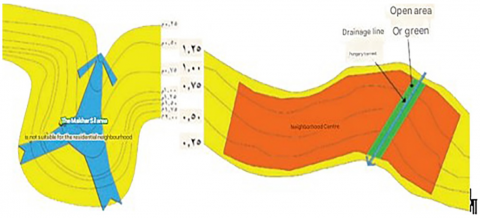
•The center of the neighborhood should not be located in floodplain areas. If necessary, the floodplain should not pass through built-up areas and may instead pass through open spaces, as illustrated in Figure 6.
Figure 6. Schematic representation of city elevation levels
•If the site terrain includes elevated areas and slopes, it is preferable to locate the neighborhood center on a peak area, as this provides visual prominence and easy access from all directions.
•The center must be situated at an elevation that allows water supply networks to reach it efficiently.
•The terrain should support easy access by both pedestrians and vehicles. It is recommended that pedestrian path slopes do not exceed 4%, and vehicular road slopes do not exceed 7%.
Figure 7 shows the relationship between the stream outlet and the adjacent center.
Figure 7. Relationship between the stream outlet and the adjacent center
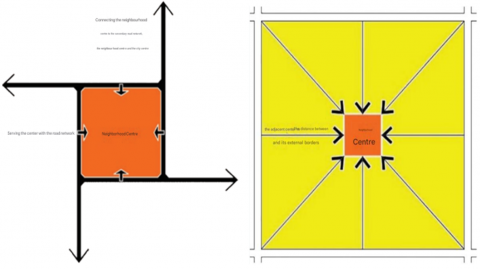
As shown in Figure 8, the urban standards are as follows:
•The neighborhood center should be located in a central location in the neighborhood that provides easy access to the center (for pedestrians and cars) from all sides of the neighborhood.
•The center should be served by a road network from all sides and not be penetrated by any transit traffic and be connected to the neighborhood and city services.
Figure 8. Location of an adjacent center in an intermediate position
4.3 Service distribution standards
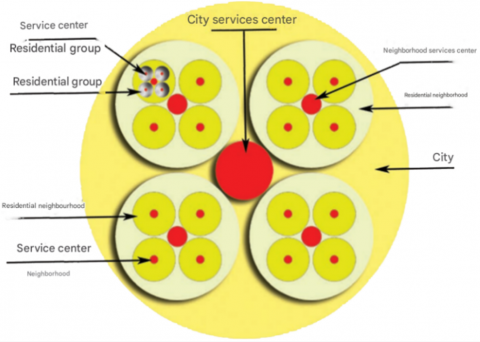
Service distribution within residential neighborhoods can be organized in several ways, as shown in Figure 9. As for the central distribution of services, the service center is located in the inner center of the residential neighborhood and provides a great opportunity to serve all residents with the shortest walking distance. It is also often limited to the residents of the neighborhood, which provides a great opportunity to develop social relations among the residents. As for the decentralized distribution of services, services are placed on the edges of the residential neighbourhood in the form of scattered commercial centers that include some subsidiary services such as the local mosque and the park. Placing the center on the edges results in no disturbance to the residents in addition to providing a great opportunity for investment. The disadvantage of this type is the increased walking distance. As for the stripe distribution of services, the service center takes the form of a strip parallel to the main pedestrian path and is characterized by homogeneous service to all residents of the neighborhood, without disturbing the residents, providing a great opportunity for pedestrian movement and confirming the idea of the Kasbah found in traditional Arab cities. This style can be applied in neighborhoods with high residential density.
Figure 9. Centralized, decentralized, and stripe distributions of residential neighborhood centers
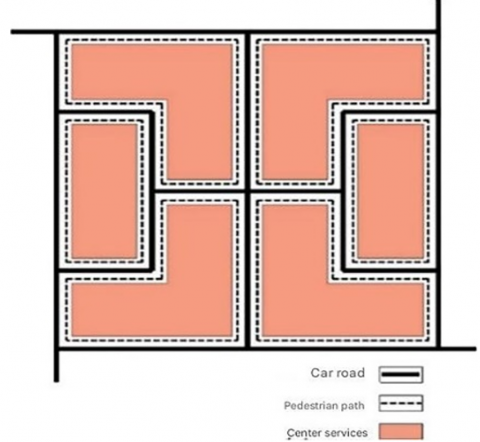
4.4 Standards for roads and pedestrian paths
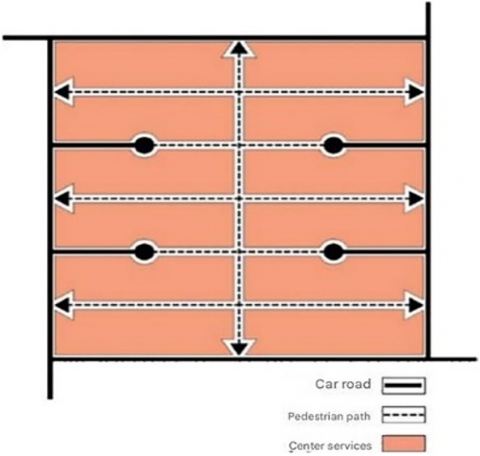
Roads, pedestrian paths, and the spaces between the services within the neighborhood center are essential elements that contribute to the center’s efficiency and ease of use. There are two alternatives for organizing the road network and pedestrian paths. The first is the separation of pedestrian and vehicle traffic. A dedicated network of pedestrian walkways is created to connect the center’s services without any intersections with vehicular traffic. This approach is notable for enhancing safety and security, as it eliminates conflicts between pedestrians and vehicles. However, its main disadvantage lies in the weaker connectivity among land use elements, as illustrated in Figure 10. The second is the integration of pedestrian and vehicular movement. This approach is the opposite of the previous one. Each road includes a lane for vehicular traffic and sidewalks for pedestrian use. The main disadvantages of this method are the reduced level of safety and security, as well as the challenges in achieving the desired visual aesthetics, as shown in Figure 11. Table 2 shows the components of the neighborhood service center.
Figure 10. Separation of pedestrian and vehicle traffic
Figure 11. Integration of pedestrian and vehicle movement
Table 2. Neighborhood service center components
|
No. |
Service |
Statement |
From |
To |
|
1 |
Mosque |
Number of population served |
300 |
7500 |
|
Service range (m) |
500 |
800 |
||
|
Capacity of the number of male worshippers |
200 |
1200 |
||
|
Capacity of the number of female worshippers |
200 |
500 |
||
|
Worshipper's share of the area (m²) |
1.5 |
1.8 |
||
|
One parking space for every five worshippers |
||||
|
2 |
Kindergarten |
Number of population served |
1500 |
3000 |
|
Service range (m) |
200 |
300 |
||
|
Total number of children out of total |
18 |
90 |
||
|
Number of classes |
2 |
8 |
||
|
Child's share of space (m²) |
5 |
10 |
||
|
One parking space for every five children |
||||
|
3 |
Primary school |
Number of population served |
3000 |
6000 |
|
Service range (m) |
- |
500 |
||
|
Total number of students |
480 |
960 |
||
|
Number of students in the school (capacity) |
240 |
720 |
||
|
Number of classes |
12 |
24 |
||
|
Number of students per class |
20 |
30 |
||
|
Student's share of area (m²) |
15 |
25 |
||
|
One parking space for every five students |
||||
|
4 |
Middle school |
Number of population served |
6000 |
10000 |
|
Service range (m) |
- |
750 |
||
|
Total number of students |
540 |
900 |
||
|
Number of students in the school (capacity) |
240 |
600 |
||
|
Number of classes |
12 |
20 |
||
|
Number of students per class |
20 |
30 |
||
|
Student's share of area (m²) |
25 |
30 |
||
|
One parking space for every five students |
||||
|
5 |
Commercial center |
Number of population served |
3000 |
6000 |
|
Service range (m) |
- |
500 |
||
|
Area per capita (m²) |
0.25 |
1 |
||
|
Six parking spaces per 100 m² of total floor area |
4.5 Criteria for determining the residential district center
The residential area should be centrally located and easily accessible from all parts of the neighborhood. The center must be served by a good road network from all sides and not be crossed by any road for transit traffic. In addition, it must be linked to the city services and the services of the neighborhoods via the road network, as shown in Figure 12. Table 3 shows the components of the residential district center.
Figure 12. The occurrence of an adjacent center in an intermediate location
Table 3. Components of the residential district center [19]
|
No. |
Service |
Description |
From |
To |
Notes |
|
1 |
Mosque |
Served population |
2000 |
7500 |
Serves neighborhood residents within the service range and the number of served population |
|
Service range (m) |
500 |
800 |
|||
|
Men's prayer capacity |
120 |
200 |
|||
|
Women's prayer capacity |
200 |
500 |
|||
|
Prayer space allocation (m²) |
1.5 |
1.8 |
|||
|
Car parking |
One parking spot for every five worshipers |
||||
|
2 |
Primary healthcare center |
Served population |
4000 |
10000 |
In neighboring residential boundaries or more than one adjacent neighborhood |
|
Service range (m) |
- |
- |
|||
|
Space per individual (m²) |
1.2 |
1.5 |
|||
|
Car parking |
One parking spot per 100 m² of total floor area |
||||
|
3 |
Post office |
Served population |
10000 |
15000 |
Neighborhood level |
|
Service range (km) |
1.0 |
1.5 |
|||
|
Space per individual (m²) |
0.4 |
0.4 |
|||
|
Car parking |
One parking spot per 25 m² of total floor area |
||||
|
4 |
Local police station |
Served population |
20000 |
70000 |
Neighborhood level or residential sector |
|
Service range (km) |
2 |
3 |
|||
|
Space per individual (m²) |
0.6 |
1.0 |
|||
|
Car parking |
One parking spot per 25 m² of total floor area |
||||
|
5 |
Branch library |
Served population |
4000 |
10000 |
Neighborhood level or residential sector |
|
Service range (km) |
- |
- |
|||
|
Seats per population ratio (%) |
1.5 |
2.0 |
|||
|
Reading area per seat (m²) |
10 |
15 |
|||
|
Car parking |
One parking spot per 25 m² of total floor area |
||||
|
6 |
Civil defense center |
Served population |
15000 |
20000 |
Neighborhood level or residential sector |
|
Service range (km) |
1.2 |
1.6 |
|||
|
Space per individual (m²) |
0.5 |
1.0 |
|||
|
Car parking |
One parking spot per 25 m² of total floor area |
||||
|
7 |
Public garden & playground |
Served population |
10000 |
15000 |
At the neighborhood level |
|
Service range (km) |
- |
- |
|||
|
Space per individual (m²) |
2 |
4.5 |
|||
|
Car parking |
Two parking spots per 100 m² of total floor area |
||||
|
8 |
Neighborhood commercial center |
Served population |
10000 |
15000 |
At the neighborhood level |
|
Service range (km) |
- |
- |
|||
|
Space per individual (m²) |
1 |
1.45 |
|||
|
Car parking |
8 parking spots per 100 m² of total floor area |
||||
|
9 |
Secondary school |
Served population |
10000 |
15000 |
At the neighborhood or residential sector level |
|
Service range (km) |
2.5 |
- |
|||
|
Total students |
750 |
- |
|||
|
Students per school (capacity) |
360 |
- |
|||
|
Number of classrooms |
18 |
- |
|||
|
Students per classroom |
18 |
- |
|||
|
Space per student (m²) |
3 |
6 |
|||
|
Car parking |
One parking spot per five students |
The changes that have occurred in Saudi society are among the most recent developments that have influenced the formulation of the new planning standards in 2016. These changes include the following:
•Women empowerment: Women have been granted greater leadership opportunities and empowered in various employment sectors.
•Rising educational and cultural levels in society: This has led to the expansion of educational and cultural services and an increase in the per capita share of such services. For example, privacy provisions for girls’ schools are maintained, but there is no longer a strict focus on separating primary grades, as integration has been introduced in the first, second, and third grades.
•Significant expansion of cultural services: The variety and distribution of cultural service units within residential neighborhoods have increased, including the introduction of literary clubs and theaters. In contrast, the 2005 planning standards report only mentioned libraries and did not include classifications for other cultural centers.
•Increased focus on health aspects at all planning levels: This has resulted in the expansion of health-related services and a higher per capita share. The 2005 report lacked a clear classification of health service units, which has been addressed in the updated standards.
•Significant expansion of entertainment services: Entertainment services have seen a major increase, along with a higher per capita share. The 2005 standards did not include planning criteria or classifications for sports clubs and focused only on public parks.
Tables 4 to 10 illustrate the impact of these emerging variables on the planning standards for residential neighborhoods in the Kingdom of Saudi Arabia between 2005 and 2016, focusing on seven key aspects: educational, cultural, health, social, entertainment, and business.
Table 4. Impact of emerging variables on educational planning standards for residential neighborhoods (2005–2016)
|
Services at the Residential Neighborhood Level |
Traditional Planning Standards (2005) |
Variables |
Updated Planning Standards (2016) |
|
Educational services |
Kindergarten: The child's share of space ranges from 5 to 10 m2 for the child. |
Rising educational and cultural level of society, expansion of educational services and an increase in per capita access, and integration of primary classes for boys and girls. Rising educational and cultural level of society, expansion of educational services and an increase in per capita access, and integration of primary classes for boys and girls. |
Kindergarten: The child's share of the site ranges from 15 to 20 m2 for the child. |
|
Elementary school: The student's share of space ranges from 15 to 25 m2. |
Primary school: The student's share of the site ranges from 15 to 20 m2. A separate school is provided for girls and the utmost privacy is provided. |
||
|
Middle school: The student's share of the area is from 25 to 30 m2 per student. |
Middle school: The student's share of the site ranges from 20 to 25 m2 per student. |
||
|
High school: Per capita area is from 25 to 30 m2 per student. |
High school: The student's share of the site ranges from 25 to 30 m2 per student. |
||
|
Kindergarten: The child's share of space ranges from 5 to 10 m2 for the child. |
Kindergarten: The child's share of the site ranges from 15 to 20 m2 for the child. |
Table 5. Impact of emerging variables on cultural planning standards for residential neighborhoods (2005–2016)
|
Services at the Residential Neighborhood Level |
Traditional Planning Standards (2005) |
Variables |
Updated Planning Standards (2016) |
|
Cultural services |
Branch libraries: The per capita share of the number of seats per 1000 people ranges between 1.5 and 2 seats. |
Rising educational and cultural level of society, expansion of cultural services and an increase in per capita access, and increased variety and diversification of cultural service units at the residential neighborhood level. Rising educational and cultural level of society, expansion of cultural services and an increase in per capita access, and increased variety and diversification of cultural service units at the residential neighborhood level. |
Cultural centers: Cultural center (A): The per capita share of the site area ranges from 0.02 to 0.03 m² per person. Cultural center (B): The per capita share of the site area ranges from 0.03 to 0.04 m² per person. Cultural center (C): The per capita share of the site area ranges from 0.06 to 0.07 m² per person. |
|
Central libraries: The per capita share of the number of seats per 1000 people ranges between 1.5 and 2 seats. |
Public libraries: Large public library: The per capita share of the site area ranges from 0.01 to 0.02 m² per person. Intermediate public library: The per capita share of the site area ranges from 0.01 to 0.02 m² per person. Small public library: The per capita share of the site area ranges from 0.03 to 0.05 m² per person. |
||
|
The report did not mention planning criteria for cultural centers or their classifications, such as literary clubs and theaters. Cultural services were limited to libraries only. |
Literary clubs: Literary club (A): The per capita share of the site area ranges from 0.01 to 0.012 m² per person. Literary club (B): The per capita share of the site area ranges from 0.03 to 0.06 m² per branch. Theaters: The per capita share of the site area ranges from 0.01 to 0.02 m² per person. |
||
|
Branch libraries: The per capita share of the number of seats per 1000 people ranges between 1.5 and 2 seats. |
Cultural centers: Cultural center (A): The per capita share of the site area ranges from 0.02 to 0.03 m² per person. Cultural center (B): The per capita share of the site area ranges from 0.03 to 0.04 m² per person. Cultural center (C): The per capita share of the site area ranges from 0.06 to 0.07 m² per person. |
Table 6. Impact of emerging variables on religious planning standards for residential neighborhoods (2005–2016)
|
Updated Planning Standards (2016) [20] |
Variables |
Traditional Planning Standards (2005) [20] |
Services at the Residential Neighborhood Level |
|
Local mosque: The per capita share of the local mosque site area ranges from 0.7 to 0.5 m2 per person. A prayer room for women is required. Grand mosque: The per capita share of the area of the site ranges from 0.4 to 0.3 m2 per person. Quran memorization center: Provided at the residential district level in cities and at the development center and rural service center level in rural areas, aiming to serve the group of villages located within the center’s scope. The per capita share of the area of the Holy Quran memorization center ranges from 0.09 to 0.16 m2 per person. |
Women empowerment variable: It has been suggested that a prayer room for women should be provided in the local mosque. |
Local mosque: The population served ranges from 750 to 1,500. It is not necessary to provide a prayer room for women. Grand mosque: The population served ranges from 3,000 to 7,500. Quran memorization center: There are no planning standards for Quran memorization centers located in residential neighborhoods. |
Religious services |
Table 7. Impact of emerging variables on health planning standards for residential neighborhoods (2005–2016)
|
Updated Planning Standards (2016) [20] |
Variables |
Traditional Planning Standards (2005) [20] |
Services at the Residential Neighborhood Level |
|
Public hospitals: A general hospital with 500-600 beds serves approximately 3-4 families per 1,000 people; a general hospital with 300-400 beds serves approximately 3-4 families per 1,000 people; and a general hospital with 100-200 beds serves approximately 3-4 families per 1,000 people. Specialized hospitals: The bed rate ranges from 1 to 1.5 beds per 1,000 people. Primary health care centers: As for the category A center, the per capita share of the site area ranges from 0.13 to 0.2 m2 per person. As for the category B center, the per capita share of the site area ranges from 0.12 to 0.2 m2 per person. Red Crescent ambulance centers: The per capita share of the site area ranges from 0.02 to 0.04 m2 per person. School health unit and dental centers: The per capita share of the site area ranges from 0.02 to 0.03 m2 per person. |
Expansion of educational services and the average per capita share, and there is no precise classification of health service units in the 2005 report. |
Public hospitals: The number of beds per 1,000 inhabitants ranges from 2 to 4. Specialized hospitals: The number of beds per 1,000 inhabitants ranges from 0.5 to 2. Primary health care centers: The per capita area ranges from 0.12 to 0.15 m2. |
Health services |
Table 8. Impact of emerging variables on social planning standards for residential neighborhoods (2005–2016)
|
Updated Planning Standards (2016) [20] |
Variables |
Traditional Planning Standards (2005) [20] |
Services at the Residential Neighborhood Level |
|
Social development centers: As for the category A center, the per capita share of the area site ranges from 0.02 to 0.03 m2 per person; as for the category B center, the per capita share of the area site ranges from 0.1 to 0.15 m2 per person; and as for the category C center, the per capita share of the area site ranges from 0.1 to 0.15 m2 per person. Social security offices: As for the category A office, the per capita share of the area site ranges from 0.01 to 0.03 m2 per person; and as for the category B office, the per capita share of the area site ranges from 0.05 to 0.07 m2 per person. |
|
The report did not mention planning criteria for social services. |
Social services |
Table 9. Impact of emerging variables on entertainment planning standards for residential neighborhoods (2005–2016)
|
Updated Planning Standards (2016) [20] |
Variables |
Traditional Planning Standards (2005) [20] |
Services at the Residential Neighborhood Level |
|
Sports clubs: As for the class A club, the per capita share of the site area ranges from 0.4 to 0.8 m2 per person; as for the category B office, the per capita share of the area site ranges from 0.7 to 1 m2 per person; and as for the category C office, the per capita share of the area site ranges from 1 to 1.5 m2 per person. Municipal squares: The per capita share of the area ranges from 0.2 to 0.3 m2 per person. Public parks: As for the city park, the per capita share of site area ranges from 0.3 to 0.4 m2 per person; as for the residential neighborhood park, the per capita share of the site area ranges from 0.4 to 0.5 m2 per person; and as for the residential neighborhood park, the individual area of the site ranges from 0.9 to 1.2 m2 per person. |
Expansion of entertainment services and the average per capita share. |
Residential complex garden: Per capita share of the site area ranges from 0.3 to 0.83 m2 per person. Residential neighborhood park: Per capita share of the site area ranges from 0.33 to 1 m2 per person. Residential neighborhood park: Per capita share of the site area ranges from 0.8 to 1.66 m2 per person. The report did not mention planning criteria for sports clubs and their classifications and was limited to public parks only. |
Entertainment services |
Table 10. Impact of emerging variables on business planning standards for residential neighborhoods (2005–2016)
|
Updated Planning Standards (2016) [20] |
Variables |
Traditional Planning Standards (2005) [20] |
Services at the Residential Neighborhood Level |
|
Residential district commercial center: Serves between 10,000 and 15,000 people and the average per capita share ranges between 5 and 10 shops in the neighborhood mall for every 1,000 people. The average per capita commercial space ranges from 0.25 to 1 m2. |
|
Residential district commercial center: Average per capita commercial space ranges from 0.25 to 1.5 m2. |
Business services |
Planning standards play a vital role in the planning, design, and development of residential settlements in the context of urban and housing development and the implementation of national policy. However, the current planning standards for residential neighborhoods require periodic updating due to the increasing speed and intensity of global changes, along with the continuous population growth that places pressure on limited resources. It is therefore essential to achieve planning objectives with minimal depletion of these resources.
The comparative analysis between the 2005 and 2016 standards revealed that earlier standards lacked the flexibility needed to accommodate emerging variables. Some standards have not been updated to include concepts such as digital transformation or spatial equity. Through the analysis of the attached tables and matrices, it became evident that standards related to educational and health services showed relative improvement, while public transportation and open space standards remained notably weak. The results also showed that the integration of concepts such as women’s empowerment, environmental sustainability, and digital transformation is still partial and has not been comprehensively addressed in the current standards.
Planning standards need to be reformulated to align with global changes and to incorporate the principles of sustainability across all dimensions of the planning process. This study presents the current planning standards in general, in addition to analyzing the existing gaps in their implementation. It is necessary to establish clear timelines and phases for the application, execution, and revision of planning standards, aiming to help direct and regulate urban development while accommodating urban growth within a defined period.
There is a need to study and analyze emerging variables that directly or indirectly impact urban development. These include positive variables such as technological advancement and artificial intelligence, which can enhance urban life, and negative variables such as environmental disasters (e.g., landslides, earthquakes, and floods), each requiring appropriate responses to ensure that urban areas are adaptive and resilient to such risks, without compromising the safety of residents or the integrity of residential zones. Studying the impact of these emerging variables—whether social, economic, technological, or environmental—can significantly contribute to the reformulation of planning standards for residential areas in a way that ensures sustainable urban development and reflects the broader concept of sustainability. Traditional standards have been characterized as primarily quantitative, whereas the newer standards aligned with sustainable development trends are more qualitative in nature. The process of formulating, modifying, and updating planning standards is based on a transitional approach: integrating new variables while phasing out outdated criteria to create standards that reflect current realities.
Unified planning standards help achieve the following objectives:
•Ensure consistency in methodology and facilitate efficient land allocation to meet current and future development needs.
•Guide the preparation of urban plans by determining the appropriate land area and location for development projects.
•Evaluate existing land uses and assess their efficiency and functionality, and define a hierarchical pattern of urban settlements to guide the distribution of public services.
•Provide guiding rules for the distribution of services and allocation of land, aiding planning and implementation authorities in making informed decisions.
•Serve as tools for planners to determine user needs for different land uses and translate them into spatial areas and specifications that shape detailed planning schemes.
•Act as a mechanism for government entities to monitor the legality and environmental compatibility of various projects, ensuring compliance with predefined regulations for approval or rejection—effectively serving as the state's tool for evaluating project efficiency and function.
•Facilitate coordination among various agencies to determine land requirements and assign responsibility for specific uses.
•Guide urban development at all planning levels by identifying the characteristics of development projects and proposing technical criteria for determining the quantity and types of services required based on the planning level at which they are to be provided.
•Support environmental, social, and economic sustainability in residential and service-oriented projects, integrating environmental considerations such as reducing carbon emissions and improving energy and water efficiency.
•Align with the goals of Saudi Arabia's Vision 2030, particularly in enhancing quality of life and promoting sustainable development, and contribute to achieving balanced and modern urban expansion in support of the national vision.
•Enable the establishment of a centralized database to guide future projects, analyze demographic and economic changes, and forecast future needs of urban communities.
•Support the design of infrastructure systems that are resilient to natural disasters such as floods and earthquakes, and promote risk-reducing urban planning that protects people and property.
Supervisors:
1. Prof. Dr. Ghada Mahmoud Ahmed Hassan
Professor of Urban Planning, Faculty of Urban and Regional Planning, Cairo University.
2. Prof. Dr. Marwa Sibawayh Hamed
Professor, Department of Urban Planning, Faculty of Urban and Regional Planning, Cairo University.
[1] Aly, H.S. (2021). The future of workplaces post (COVID-19) towards integrating biophilic design and smart technologies in the office workplaces. Journal of Urban Research, 39(1): 1-27. https://app.scinito.ai/article/W3115699083.
[2] Alcántara-Ayala, I. (2025). Landslides in a changing world. Landslides. https://doi.org/10.1007/s10346-024-02451-1
[3] Dai, F.C., Lee, C.F., Ngai, Y.Y. (2002). Landslide risk assessment and management: An overview. Engineering Geology, 64(1): 65-87. https://doi.org/10.1016/S0013-7952(01)00093-X
[4] Habitat, U.N. (2013). State of the World's Cities 2012/2013: Prosperity of Cities. Routledge.
[5] Bibri, S.E. (2018). Backcasting in futures studies: A synthesized scholarly and planning approach to strategic smart sustainable city development. European Journal of Futures Research, 6: 13. https://doi.org/10.1186/s40309-018-0142-z
[6] Ramirez Lopez, L.J., Grijalba Castro, A.I. (2021). Sustainability and resilience in smart city planning: A review. Sustainability, 13(1): 181. https://doi.org/10.3390/su13010181
[7] Bibri, S.E. (2018). Smart Sustainable Cities of the Future. Springer Cham. https://doi.org/10.1007/978-3-319-73981-6
[8] Bibri, S.E., Krogstie, J. (2019). Generating a vision for smart sustainable cities of the future: A scholarly backcasting approach. European Journal of Futures Research, 7: 5. https://doi.org/10.1186/s40309-019-0157-0
[9] UNEP. (2019). Global environment outlook 6. https://www.unep.org/resources/global-environment-outlook-6.
[10] Gaye, A., Jha, S. (2011). Measuring women’s empowerment through migration. Diversities, 13(1): 49-66. https://newdiversities.mmg.mpg.de/fileadmin/user_upload/2011_13-01_Gaye_Jha.pdf.
[11] Malhotra, A., Schuler, S.R., Boender, C. (2002). Measuring women's empowerment as a variable in international development. World Bank Workshop on Poverty and Gender: New Perspectives. https://doi.org/10.1037/E597202012-004
[12] Afsar, R. (2003). Internal migration and the development nexus: The case of Bangladesh. https://assets.publishing.service.gov.uk/media/57a08d16e5274a31e0001632/WP-CP2.pdf.
[13] Herslund, L.B., Jalayer, F., Jean-Baptiste, N., Jørgensen, G., et al. (2016). A multi-dimensional assessment of urban vulnerability to climate change in Sub-Saharan Africa. Natural Hazards, 82(Suppl 2): 149-172. https://doi.org/10.1007/s11069-015-1856-x
[14] Our Work on the Sustainable Development Goals in Egypt. https://egypt.un.org/ar/sdgs.
[15] World Bank. (2014). Internal migration: Opportunities to speed up the urbanization process. https://blogs.worldbank.org/en/peoplemove/internal-migration-opportunities-speed-urbanization-process.
[16] de Haas, H. (2007). Migration and development: A Theoretical perspective, bielefeld: COMCAD. Working Papers – Center on Migration, Citizenship and Development; No. 29. https://heindehaas.org/wp-content/uploads/2015/05/de-haas-2007-comcad-wp-migration-and-development-theory.pdf.
[17] Adepoju, A. (2002). Issues and recent trends in international migration in Sub-Saharan Africa. International Social Science, 52(165): 383-394. https://doi.org/10.1111/1468-2451.00267
[18] Stevenson, A. (2010). Oxford Dictionary of English (3 ed.). Oxford University Press.
[19] Ministry of Municipal and Rural Affairs. (2004). Guide to Planning Neighborhood Centers and Residential Neighborhoods. https://docs.google.com/file/d/0B5lydHYQukiYZl95R00yWGM5WjA/edit?resourcekey=0-4JYdZRRG2QdS6bKqQ11UKA.
[20] Ministry of Municipal and Rural Affairs. (2005). Guide to Planning Standards for Services. King Fahd National Library. https://www.scribd.com/doc/265183875/.