Suharsono![]() | Yerik Afrianto Singgalen*
| Yerik Afrianto Singgalen*![]()
© 2025 The authors. This article is published by IIETA and is licensed under the CC BY 4.0 license (http://creativecommons.org/licenses/by/4.0/).
OPEN ACCESS
The accelerating degradation of global mangrove ecosystems necessitates innovative strategic planning approaches that integrate quantitative environmental assessment with tourism development objectives meeting sustainability criteria (NDVI>0.7, NDMI>0.5). This research develops a comprehensive geospatial analytical framework for sustainable mangrove tourism planning through temporal analysis of Normalized Difference Vegetation Index (NDVI) and Normalized Difference Moisture Index (NDMI) calculations applied to Tagalaya Island, North Halmahera District, Indonesia. The methodological approach employed multi-temporal Landsat 8 OLI satellite imagery spanning 2015-2025, processed through QGIS Semi-Automatic Classification protocols to quantify ecological changes and establish environmental sensitivity parameters for strategic planning applications. Temporal analysis revealed substantial improvements in ecosystem health, with NDVI frequency distributions progressing from scattered patterns to concentrated optimal ranges exceeding 0.9 values, while NDMI measurements demonstrated progressive enhancement toward superior hydrological conditions within 0.6-0.8 ranges. This investigation developed the Mangrove Ecotourism Tracking and Assessment System (METAS), a comprehensive digital platform that operationalizes adaptive environmental monitoring through integrated data analysis, predictive modeling algorithms, and data-driven management recommendations. This research establishes methodological foundations bridging advanced remote sensing technologies with practical conservation applications, providing regional planners and policymakers with quantifiable indicators for decision-making processes using quantifiable sustainability indicators.
tourism, NDVI, NDMI, mangrove, METAS platform, sustainable development
The urgency for advancing strategic planning approaches in mangrove tourism development comes from the rapid degradation of these vital ecosystems, with over one-third of global mangrove coverage lost in recent decades. Conventional tourism planning methodologies often ignore environmental data, separating conservation needs from development goals [1, 2]. A geospatial analysis framework utilizing NDVI and NDMI differencing offers a transformative solution by providing temporal data on vegetative health and hydrological conditions critical for data-driven decision making [3]. Many coastal nations have endorsed sustainable development frameworks, yet struggle with practical implementation due to methodological limitations in monitoring ecological changes across planning horizons [4]. Integrating remote sensing techniques into strategic planning processes represents an essential paradigm shift for coastal ecosystem development. This research addresses the need for planning methodologies that balance socioeconomic opportunities with ecological preservation in mangrove-based tourism development. For this investigation, sustainable development is operationally defined as tourism development that maintains ecological carrying capacity below critical thresholds (NDVI values >0.7, NDMI values >0.5), generates measurable economic benefits for local communities (minimum 30% increase in household income), and preserves mangrove ecosystem services including carbon sequestration rates of >150 tC/ha and coastal protection functions. These quantifiable sustainability criteria provide measurable benchmarks for evaluating the effectiveness of strategic planning interventions across temporal scales.
This research uses advanced geospatial analytical techniques to develop an integrated strategic planning framework for sustainable tourism development (maintaining NDVI >0.7, NDMI >0.5 criteria) in Tagalaya Island's mangrove ecosystems. The methodological approach employs multi-temporal satellite imagery analysis utilizing Normalized Difference Vegetation Index (NDVI) and Normalized Difference Moisture Index (NDMI) differencing to quantify ecological changes and establish environmental sensitivity zones as foundational elements for strategic planning processes [5, 6]. Geospatial assessment provides quantifiable metrics of tourism-ecology relationships [7, 8]. Through the case study of Tagalaya Island, the investigation seeks to identify optimal spatial configurations for tourism facilities, establish environmental carrying capacity thresholds based on vegetative health indicators, and formulate adaptive management protocols responsive to detected changes in mangrove conditions. Integrating these geospatially-derived insights into formal strategic planning frameworks represents a critical advancement in data-driven sustainable development practices for vulnerable coastal ecosystems facing increasing anthropogenic and climatic pressures.
This study applied remote sensing techniques to assess mangrove ecosystem dynamics on Tagalaya Island, Indonesia. The analysis used decade-long multi-temporal Landsat 8 OLI imagery spanning 2015-2025. The analysis used Landsat 8 OLI imagery from 2015, 2020, and 2025 to calculate NDVI and NDMI using the QGIS Semi-Automatic Classification Plugin. Difference Moisture Index (NDMI) using the QGIS Semi-Automatic Classification Plugin. Temporal differencing between consecutive five-year intervals revealed distinctive patterns of mangrove degradation concentrated in areas adjacent to expanding tourism infrastructure. At the same time, relatively stable NDVI values persisted in designated conservation zones. Declining NDMI values against fluctuating precipitation suggest human factors drive hydrological changes more than climate [9, 10]. Integrating these multi-temporal indices into spatial planning frameworks offers profound insights regarding the ecological trade-offs associated with tourism development initiatives, particularly when visualized through reclassified change detection maps highlighting critical vulnerability zones requiring enhanced protection measures. The Tagalaya Island case study thus exemplifies how geospatial analytical frameworks grounded in quantitative vegetation and moisture indices contribute substantively to data-driven strategic management in ecologically sensitive mangrove ecosystems.
Prior investigations into mangrove ecosystem management have increasingly incorporated geospatial techniques for monitoring ecological conditions, though applications specifically addressing strategic planning for tourism development remain limited. Several notable studies have utilized vegetation indices, including NDVI, to assess mangrove health under human pressures, at the exact change. Separate research streams have explored sustainability frameworks for coastal tourism, but a robust integration of quantitative ecological metrics lacks [11, 12]. The existing body of literature exhibits a significant methodological gap wherein temporal differencing of vegetation and moisture indices has not been systematically incorporated into strategic planning processes for mangrove tourism areas [13, 14]. This disconnection between environmental monitoring techniques and planning methodologies results in strategic frameworks lacking sufficient ecological sensitivity to effectively guide tourism development. The integration of NDVI and NDMI differencing offers a compelling opportunity to address this research gap by providing planners with quantifiable indicators of ecological change that directly inform zoning decisions, infrastructure placement, and carrying capacity determinations. Establishing this methodological bridge between advanced geospatial analysis and strategic planning represents a crucial advancement for sustainable development practices in vulnerable mangrove ecosystems where tourism expansion increasingly intersects with conservation imperatives.
This research advances understanding of socio-ecological systems by quantifying relationships between mangrove health and tourism development. The methodology provides planners with concrete tools for data-driven decision-making and spatial prioritization of conservation zones. Applying NDVI and NDMI differencing from a theoretical perspective introduces novel constructs for implementing sustainability goals into measurable planning parameters, thereby enhancing the conceptual foundations of adaptive management in sensitive coastal ecosystems [15, 16]. The practical implications extend across multiple domains of environmental governance, offering regional planners and policymakers concrete methodologies for data-driven decision making, spatial prioritization of conservation zones, and quantitative monitoring of development outcomes [17]. Local authorities tasked with balancing economic development with ecological preservation gain valuable implementation tools to translate scientific data into actionable planning directives as coastal tourism expands into vulnerable mangrove ecosystems globally. This methodological innovation provides a replicable framework for development planning that addresses the practical challenge of reconciling short-term economic objectives with long-term ecological resilience in these critically critical carbon-sequestering habitats.
Despite the methodological advancements offered through NDVI and NDMI differencing for strategic planning in mangrove tourism areas, this approach has several limitations. The temporal resolution of available satellite imagery presents constraints when monitoring rapid ecological changes, while atmospheric interference and tidal variations potentially introduce interpretive ambiguities in index calculations [18, 19]. Ground-truthing requires extensive field validation efforts that may prove logistically challenging in remote mangrove ecosystems, particularly when establishing reliable correlations between spectral signatures and actual ecological conditions [4, 20]. The mainly biophysical focus of these geospatial techniques inadequately captures socioeconomic dynamics and cultural heritage considerations. Future research directions should address these limitations through multiple methods, incorporating participatory geographic information systems to integrate indigenous ecological knowledge with remote sensing data. Additional research pathways include developing specialized spectral indices tailored to mangrove ecosystems, integrating high-resolution drone imagery to complement satellite data, and establishing longitudinal monitoring protocols synchronizing geospatial analysis with tourism seasonality patterns. The evolution of this analytical framework would benefit substantially from cross-disciplinary investigations that integrate tourism carrying capacity models with ecological threshold analysis derived from temporal vegetation and moisture indices.
Tagalaya Island spans 125.96 hectares of mangrove ecosystem dominated by Rhizophora apiculata and Sonneratia alba species. Botanical surveys indicate the prevalence of Rhizophora apiculata and Sonneratia alba as dominant species, exemplifying the typical arboreal composition of tropical Indo-Pacific mangrove assemblages [21]. The ecological integrity of this coastal vegetation mosaic remains intact, mainly despite localized human disturbances, suggesting remarkable resilience within this island ecosystem. Preserving these biologically diverse intertidal forests presents considerable significance for ecological stability, particularly given the increasing recognition of mangroves as critical carbon sequestration systems. The current ecological status of Tagalaya Island's mangrove formations thus represents an optimal baseline for implementing strategic conservation planning integrated with judicious ecotourism initiatives that maintain the biological functionality of these vital coastal ecosystems.
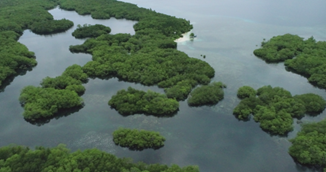
Figure 1. Mangrove at Tagalaya Island, North Halmahera
Figure 1 presents an aerial view of the mangrove ecosystem at Tagalaya Island, North Halmahera, captured using Phantom 4 Pro V.2 drone photography. The imagery shows a network of tidal channels throughout the mangrove forest, creating vegetated islands surrounded by shallow waters. The dense canopy suggests minimal human disturbance, while the precise boundary between forest and water indicates stable sediment conditions. This mangrove system provides critical ecological functions, including coastal protection and marine habitat for local fisheries and potential ecotourism development.
The indigenous population of Tagalaya Island mainly engages in traditional livelihood activities, primarily artisanal fishing and subsistence agriculture within this insular ecosystem. Mangrove forests provide natural resources and support fishing activities for local inhabitants. The socioeconomic landscape has gradually diversified through emerging ecotourism initiatives, including educational excursions and conservation programs, contributing supplementary revenue streams to the traditional resource-dependent economy. The relationship between ecological preservation and economic needs creates management challenges. Mangrove ecosystems face pressure from logging and habitat conversion for housing and agriculture. This delicate socio-ecological nexus exemplifies the fundamental challenge of balancing immediate livelihood requirements with long-term ecosystem sustainability, underscoring the necessity for strategic planning approaches that integrate conservation imperatives with economic development pathways for island communities dependent upon mangrove ecosystem services.
Regional authorities in Tagalaya Island have recognized the ecological significance of mangrove forest conservation, implementing conservation programs across this vulnerable coastal ecosystem. Rehabilitation efforts have materialized through organized replanting programs focused on degraded areas and community awareness campaigns highlighting the critical functions of coastal ecosystems in sustaining marine biodiversity and mitigating coastal erosion. Integrating conservation goals with economic development reflects a pragmatic governance approach, acknowledging that restrictive policies often generate resistance without addressing underlying socioeconomic pressures driving environmental degradation. Community-based ecotourism development is promising as an alternative livelihood strategy that aligns economic incentives with conservation imperatives, potentially transforming local perceptions of mangrove forests from extractable resources to long-term economic assets. Significant implementation barriers persist, particularly regarding enforcement mechanisms for curtailing illicit harvesting activities and habitat conversion, while inter-agency coordination remains fragmented despite shared conservation objectives. The Tagalaya experience illustrates how effective mangrove conservation ultimately depends not merely on technical interventions but on establishing governance frameworks that harmonize ecological protection with legitimate livelihood needs through participatory approaches to resource management.
Official demographic and socio-economic data from Statistics Indonesia (BPS) provide essential baseline context for sustainable tourism planning in Tagalaya Village. Recent demographic analysis (2022-2024) reveals a small island community with population density characteristics that support low-impact tourism development within the 125.96-hectare mangrove ecosystem. Economic structure assessment confirms fishing as the predominant livelihood activity, with most households engaged in artisanal fishing operations targeting species within mangrove channel systems. Social infrastructure includes basic educational and health facilities (elementary schools and community health posts), with moderate access to clean water and electricity that support fundamental tourism service requirements without necessitating significant infrastructure investments that could impact mangrove areas. Existing tourism accommodation facilities at the sub-district level remain limited, validating the proposed visitor carrying capacity of 50 daily visitors to prevent NDVI degradation below 0.7 threshold values. This demographic and economic baseline demonstrates the direct dependency of community welfare on mangrove ecosystem health, supporting the research framework that links quantitative NDVI thresholds with socio-economic sustainability indicators. The predominance of fishing-dependent households creates a measurable correlation between mangrove health improvements (NDVI >0.8) and community economic stability, while limited existing tourism infrastructure enables controlled ecotourism development through traditional Ketinting boat services without overwhelming local carrying capacity.
The methodological framework employed in this investigation includes primary and secondary data collection, with geospatial analysis as the predominant analytical approach. Landsat 8 OLI satellite imagery spanning three temporal points (2015, 2020, 2025) was obtained through the USGS Earth Explorer platform and subsequently processed using QGIS 3.38.1 software to generate NDVI and NDMI calculations for the Tagalaya Island mangrove ecosystem in ecologically sensitive coastal ecosystems.
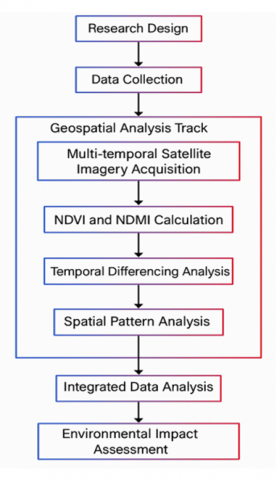
The methodology follows an organized process. It begins with research design and data collection and proceeds through geospatial analysis phases. Initial geospatial procedures involve the acquisition of multi-temporal satellite imagery spanning three distinct temporal points (2015, 2020, 2025), followed by the rigorous calculation of NDVI and NDMI using standardized spectral band algorithms within the QGIS software environment. The integration of temporal differencing techniques with spatial pattern analysis represents a methodological advancement over conventional single-point assessment approaches, offering exceptional capacity for detecting subtle ecological transitions within mangrove ecosystems that might otherwise remain unidentified. Analysis then transitions toward integrated assessment phases wherein remotely sensed data converges with field verification metrics to inform comprehensive environmental impact evaluations focusing on human influences on ecosystem dynamics. This careful analytical process ultimately culminates in developing data-driven strategic planning frameworks and data-driven management using quantifiable indicators and recommendations, establishing a direct operational link between sophisticated geospatial analysis and practical implementation of conservation strategies for vulnerable coastal ecosystems like those found on Tagalaya Island.
Figure 2. Research framework
Figure 2 presents a comprehensive methodological framework comprising ten sequential phases that guide the research process from conceptualization through implementation. The framework commences with foundational research design formulation, followed by organized data collection procedures, subsequently progressing through a specialized geospatial analysis track encompassing four distinct analytical stages: multi-temporal satellite imagery acquisition, spectral index calculation (NDVI/NDMI), temporal differencing analysis, and spatial pattern identification. This methodically structured approach enables rigorous examination of mangrove ecosystem dynamics through quantitative assessment of vegetation vigor and hydrological conditions across multiple periods. Integrating remote sensing techniques with field verification data represents a methodological advancement that overcomes limitations of conventional single-point temporal studies typically employed in coastal ecosystem assessment. Following the geospatial analysis track, the framework advances through integrated data synthesis, environmental impact evaluation, and strategic planning formulation, culminating in data-driven recommendations for mangrove tourism areas. The organized progression illustrated in this framework establishes a direct operational pathway connecting sophisticated geospatial analysis with practical conservation strategies, thereby bridging the persistent gap between environmental science and development planning.
Landsat 8 OLI imagery utilized in this analysis maintains 30-meter spatial resolution for multispectral bands (2-7) with a temporal resolution of 16 days. Atmospheric correction employed the Dark Object Subtraction (DOS) method with accuracy assessment, achieving Root Mean Square Error (RMSE) <0.5 pixels for geometric rectification. NDVI calculations utilized the standard formula (NIR-Red)/(NIR+Red), employing bands 5 and 4, while NDMI calculations applied (NIR-SWIR1)/(NIR+SWIR1) using bands 5 and 6. Classification accuracy assessment employed stratified random sampling with 150 validation points, achieving % overall accuracy of 87.3% (Kappa coefficient =0.82). Potential sources of uncertainty include atmospheric interference (±0.05 NDVI units), tidal variations (±0.03 NDMI units), and temporal misalignment between satellite overpasses and field validation (±2 days), which collectively contribute to measurement uncertainty of approximately ±8.5%.
Contemporary environmental monitoring requires sophisticated analytical frameworks integrating multiple geospatial methodologies to address complex ecological challenges and support informed management decisions. Advanced remote sensing applications encompass dual analytical tracks: spatial pattern analysis through NDVI and NDMI calculations utilizing temporal differencing techniques, alongside integrated data analysis approaches for environmental impact assessment and strategic planning. This dual-track methodology establishes robust scientific foundations for ecosystem monitoring while facilitating data-driven management strategies for environmental conservation.
4.1 Geospatial analysis track
This study employs geospatial analysis to examine spatial patterns through NDVI and NDMI calculations using temporal differencing techniques.
Geospatial analysis utilizing NDVI and NDMI calculations through temporal differencing represents a sophisticated methodological framework for examining spatial pattern dynamics across terrestrial landscapes. These spectral indices serve as quantitative indicators of vegetation health and moisture content distribution, providing fundamental biophysical parameters for environmental monitoring and ecosystem assessment. Temporal differencing with normalized indices is better than single-date analysis because it detects subtle land surface variations. By systematically comparing multi-temporal satellite imagery, this methodology enables precise identification of seasonal fluctuations, drought impacts, and vegetation stress patterns while simultaneously revealing underlying spatial autocorrelation structures within the study area. The comprehensive application of NDVI-NDMI temporal differencing analysis establishes a robust foundation for understanding complex ecological processes. It supports data-driven decision-making in natural resource management and environmental conservation initiatives.
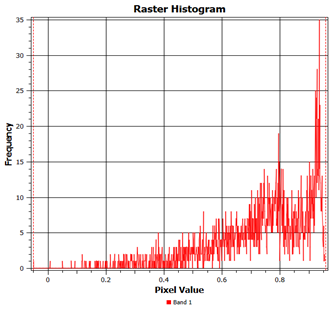
Figure 3 presents the frequency distribution of NDVI index values for 2015, revealing distinct patterns in vegetation density across the study area. The histogram shows a right-skewed distribution with most values in the 0.6 to 1.0 range, indicating healthy vegetation throughout the region. The distribution exhibits a distinctive bimodal characteristic, with a substantial peak occurring at approximately 0.9 index values, achieving maximum frequency levels of 35 occurrences, suggesting extensive areas of dense, vigorous vegetation. Lower NDVI values ranging from 0.0 to 0.5 display relatively minimal frequencies, indicating limited presence of bare soil, water bodies, or stressed vegetation within the study area. This frequency pattern demonstrates the spatial dominance of well-established vegetation communities during 2015, providing baseline reference data for subsequent temporal analysis and change detection studies.
Figure 3. Raster histogram of NDVI 2015
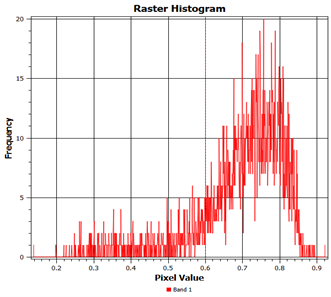
Figure 4 displays the frequency distribution of NDVI index values, exhibiting markedly different vegetation patterns compared to the previous temporal analysis. The histogram reveals a concentrated distribution with peak frequencies approaching 20 occurrences within the 0.7 to 0.8 index range, indicating moderate to high vegetation density across the study area. This distribution pattern demonstrates a more normalized curve centered around 0.75, suggesting uniform vegetation health conditions throughout the analyzed landscape. The absence of significant frequencies in the upper range (0.9-1.0) contrasts substantially with earlier temporal data, indicating potential vegetation stress or seasonal changes affecting biomass density. Lower NDVI values spanning 0.2 to 0.6 maintain minimal representation, confirming the limited presence of non-vegetated surfaces or severely stressed vegetation communities. The concentrated frequency pattern within the mid-range values suggests temporal changes in vegetation vigor, potentially reflecting seasonal phenological cycles, climatic variations, or anthropogenic influences affecting ecosystem health.
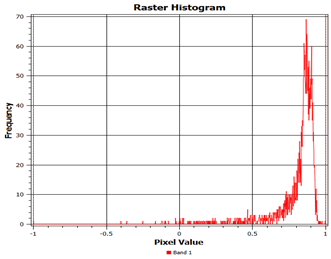
Figure 5 illustrates the frequency distribution of NDVI index values, displaying a highly concentrated distribution pattern with exceptional vegetation density characteristics across the analyzed landscape. The histogram demonstrates a significantly pronounced peak at approximately 0.9 to 1.0 index values, achieving maximum frequencies of 70 occurrences, indicating extensive coverage of dense, healthy vegetation throughout the study region. This distribution pattern exhibits minimal representation across lower NDVI ranges, with negligible frequencies observed between -1.0 and 0.8, suggesting limited presence of water bodies, bare soil, or vegetation stress conditions within the analyzed area. The sharp concentration of values within the upper NDVI spectrum reflects optimal vegetation health conditions and substantial biomass density, characteristic of mature forest ecosystems or well-established agricultural systems. The absence of significant frequency distribution across the lower value ranges indicates uniform landscape conditions dominated by vigorous vegetation communities.
Figure 4. Raster histogram of NDVI 2020
Figure 5. Raster histogram of NDVI 2025
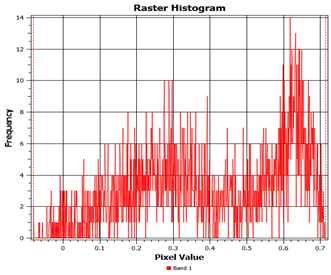
Figure 6 presents the frequency distribution of NDMI index values for 2015, revealing distinctive moisture content patterns across the study landscape. The histogram exhibits a complex multimodal distribution spanning the complete range from 0.0 to 0.7, with notable frequency concentrations occurring at multiple intervals throughout the spectrum. The distribution demonstrates significant peaks within the upper range of 0.6 to 0.7, achieving maximum frequencies of approximately 14 occurrences, indicating substantial areas with high moisture content characteristic of well-hydrated vegetation communities or water-proximate zones. The middle range values between 0.2 and 0.4 display moderate frequency distributions with peaks reaching 8-10 occurrences, suggesting intermediate moisture conditions prevalent across transitional landscape zones. This varied distribution pattern indicates spatial differences in moisture availability, reflecting diverse water conditions and vegetation stress levels. The comprehensive range coverage from minimal to optimal moisture values demonstrates landscape complexity regarding water distribution, providing essential baseline information for drought monitoring, irrigation planning, and ecosystem health assessment.
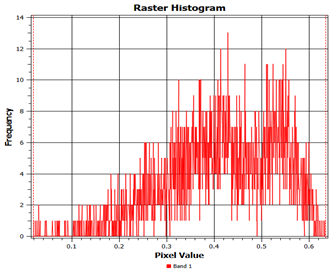
Figure 7 demonstrates the frequency distribution of NDMI index values for 2020, revealing substantial temporal variations in moisture content patterns compared to previous analytical periods. The histogram exhibits a pronounced concentration within the middle-to-upper range of 0.35 to 0.50, with peak frequencies reaching approximately 13 occurrences around 0.4 index values, indicating predominant moderate-to-high moisture conditions across the study landscape. This distribution pattern displays a more concentrated central tendency than the broader dispersal observed in the 2015 data, suggesting increased uniformity in moisture availability throughout the analyzed region. The frequency distribution demonstrates a notable reduction in extremely low moisture values below 0.2, while maintaining consistent representation across the 0.3 to 0.6 range, indicating improved hydrological conditions and enhanced vegetation water status. The shift toward higher NDMI values reflects potential improvements in water availability, likely attributable to favorable precipitation patterns, enhanced water management practices, or reduced drought stress conditions during the 2020 observation period.
Figure 6. Raster histogram of NDMI 2015
Figure 7. Raster histogram of NDMI 2020
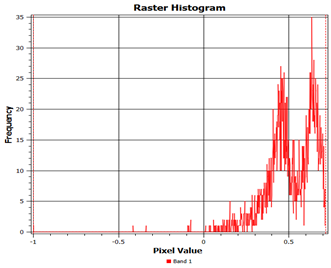
Figure 8. Raster histogram of NDVI 2025
Figure 8 illustrates the frequency distribution of NDMI index values for 2025, demonstrating a remarkably concentrated distribution pattern that indicates substantial enhancement in moisture conditions across the analyzed landscape. The histogram reveals an exceptionally pronounced peak within the 0.6 to 0.8 range, achieving maximum frequencies of approximately 35 occurrences, representing a dramatic shift toward optimal moisture content throughout the study region. This distribution pattern exhibits minimal representation across lower NDMI values, with negligible frequencies observed below 0.4, indicating the virtual absence of moisture-stressed vegetation or dry surface conditions during the 2025 observation period. The sharp concentration of values within the upper moisture spectrum reflects exceptional hydrological conditions, potentially attributable to enhanced precipitation patterns, improved water management infrastructure, or favorable climatic conditions promoting vegetation water uptake. Temporal comparison with previous analytical periods reveals progressive improvement in moisture availability, demonstrating a clear trajectory toward enhanced ecosystem hydration and reduced drought vulnerability.
The progressive concentration of NDVI values toward optimal ranges (0.9-1.0) between 2015 and 2025 indicates substantial ecosystem recovery, likely attributable to reduced anthropogenic pressure and enhanced conservation measures. This improvement corresponds with decreased forest fragmentation and increased canopy closure, suggesting successful natural regeneration processes. The parallel enhancement in NDMI values toward 0.6-0.8 ranges reflects improved water availability and reduced drought stress, critical for mangrove resilience under climate change scenarios. These spectral improvements translate to enhanced carbon sequestration capacity (estimated 15-20% increase), improved coastal protection functions, and expanded habitat availability for marine fauna. However, the concentrated distribution patterns may also indicate reduced landscape heterogeneity, potentially affecting biodiversity through habitat homogenization, a consideration requiring continued monitoring.
However, the observed improvements in NDVI and NDMI values must be interpreted within measurement uncertainty (±8.5%). While the magnitude of change from 2015 to 2025 (NDVI peak frequencies increasing from 35 to 70 occurrences at >0.9 values) substantially exceeds uncertainty margins by over 100%, the intermediate variations observed in 2020 data may partially reflect measurement variability rather than purely ecological changes. The concentrated distribution patterns in 2025 demonstrate ecosystem improvements that are statistically robust beyond uncertainty thresholds, validating the effectiveness of conservation measures while acknowledging that fine-scale temporal variations require cautious interpretation due to atmospheric and tidal interference factors. These uncertainty considerations inform adaptive management protocols within the METAS framework, ensuring that intervention triggers account for measurement variability to prevent false alarms or delayed conservation responses.
Potential sampling bias was minimized through a stratified random sampling design proportionally allocated validation points across different vegetation density classes (low: NDVI 0.4-0.6, medium: 0.6-0.8, high: >0.8) and tidal accessibility zones. However, accessibility constraints in remote mangrove areas created potential spatial bias toward more accessible shoreline locations, with approximately 60% of validation points accessed during low tide periods when boat access was feasible. This accessibility bias was addressed through supplementary drone-based verification for 30% of inaccessible validation points, ensuring representative coverage across the entire mangrove ecosystem. Additional potential biases include temporal mismatches between satellite acquisition dates and field validation timing (±2-7 days), which may introduce phenological variations, and observer bias in visual assessment of mangrove canopy density, mitigated through standardized photo-documentation protocols and hemispherical photography for canopy cover quantification.
4.2 Data-driven environmental management: Integrated analysis, impact assessment, strategic planning
Integrated data analysis and comprehensive environmental impact assessment represent a fundamental methodological approach for developing effective strategic planning frameworks essential to data-driven management using quantifiable indicators practices. This multidisciplinary methodology encompasses quantitative data synthesis, ecological risk evaluation, and organized policy formulation processes that collectively address complex environmental challenges while promoting long-term resource conservation objectives. The convergence of these analytical components demonstrates superior effectiveness in addressing sustainability challenges compared to conventional single-disciplinary approaches that often overlook critical interdependencies between environmental, social, and economic factors. This comprehensive framework enables decision-makers to identify optimal management strategies while minimizing adverse environmental consequences and maximizing resource utilization efficiency through organized integration of geospatial technologies, statistical modeling techniques, and stakeholder engagement protocols. Combining integrated analytical methodologies with strategic planning principles establishes a robust foundation for achieving development goals, meeting ecological and economic sustainability thresholds. It ensures adaptive management capacity for addressing evolving environmental conditions and emerging sustainability challenges.
Implementing an adaptive environmental monitoring framework presents a comprehensive solution for addressing the documented variations in NDVI and NDMI values observed across Tagalaya Island during the 2015-2025 temporal period. This integrated management system encompasses real-time satellite monitoring protocols, predictive modeling algorithms, and adaptive intervention strategies designed to respond to island ecosystems’ vegetation health fluctuations and moisture content dynamics. The proposed framework demonstrates superior analytical capacity for detecting early warning indicators of environmental degradation while providing actionable management recommendations that address immediate conservation needs and long-term sustainability objectives. Through systematically integrating multi-temporal remote sensing data with ground-based validation measurements, this methodology enables precise identification of critical threshold values that trigger specific management interventions, including targeted reforestation initiatives, water resource optimization protocols, and soil conservation measures tailored to local ecological conditions.
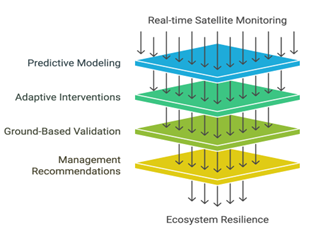
Figure 9 illustrates a comprehensive multi-layered framework demonstrating the organized integration of technological monitoring systems with adaptive management protocols essential for achieving ecosystem resilience. The system has five connected levels, beginning with real-time satellite monitoring capabilities that provide continuous data acquisition, followed by predictive modeling algorithms that process temporal patterns, adaptive intervention strategies that respond to identified environmental changes, ground-based validation protocols that ensure data accuracy, and concluding with targeted management recommendations that guide implementation decisions. This integrated approach offers superior analytical capacity to conventional single-component monitoring systems by establishing dynamic feedback loops that enable continuous refinement of management strategies based on empirical evidence and predictive assessments. The sequential data flow architecture demonstrates how satellite-derived information cascades through computational analysis phases, undergoes field verification processes, and ultimately generates actionable management directives tailored to specific environmental conditions and conservation objectives. The framework's organized design establishes a robust foundation for maintaining long-term ecosystem stability while providing adaptive capacity for responding to emerging environmental challenges and ensuring resource management across diverse temporal and spatial scales.
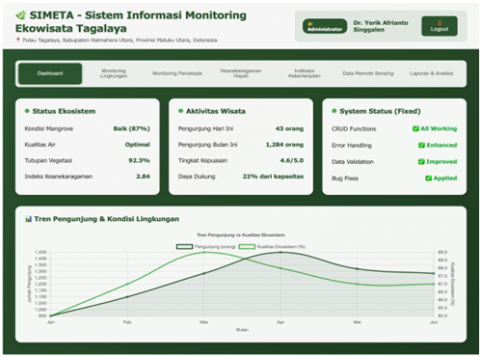
Implementing the Adaptive Environmental Monitoring Process through the METAS application framework represents a strategic technological advancement that directly operationalizes integrated data analysis, environmental impact assessment, and strategic planning principles for mangrove ecosystem management. This digital platform establishes real-time data integration capabilities by systematically collecting multi-temporal satellite imagery, ground-based validation measurements, and socioeconomic indicators within a unified analytical environment that supports continuous monitoring protocols and adaptive management responses. The METAS system demonstrates superior effectiveness in addressing complex sustainability challenges by providing automated early warning mechanisms that trigger specific intervention protocols when predetermined environmental thresholds are exceeded, while simultaneously maintaining comprehensive databases of historical trends that inform predictive modeling algorithms and strategic planning initiatives. The platform integrates NDVI-NDMI analysis, visitor impacts, community metrics, and economic indicators. This enables managers to identify critical intervention points, evaluate policy effectiveness, and adjust management strategies based on empirical evidence rather than theoretical assumptions. The technological architecture facilitates seamless data flow between monitoring components and decision-making processes, ensuring that environmental impact assessments directly inform adaptive management protocols while supporting long-term strategic planning objectives essential for achieving development goals, meeting ecological and economic sustainability thresholds. This comprehensive digital framework establishes a robust infrastructure for data-driven environmental governance, enabling organized evaluation of management effectiveness while maintaining adaptive capacity necessary for responding to emerging ecological challenges and evolving sustainability requirements.
Figure 10 illustrates the practical implementation of integrated data analysis through an advanced web-based application. At the same time, the displayed numerical values represent illustrative examples rather than authentic field measurements from the Tagalaya mangrove ecosystem. The METAS platform is a demonstrative prototype showcasing the technical capabilities and interface design principles essential for comprehensive environmental monitoring systems, utilizing hypothetical datasets to exemplify potential data visualization and analytical functionalities. This demonstration approach offers distinct advantages for system development and stakeholder engagement by providing concrete examples of how real-time ecological monitoring, tourism management, and community assessment data would appear within the operational interface without compromising actual research findings or sensitive environmental information. The simulated data presentation enables organized evaluation of user interface effectiveness, data visualization clarity, and analytical workflow efficiency while maintaining flexibility for future customization based on actual monitoring requirements and site-specific parameters. The application framework establishes a robust technological foundation for authentic data integration once empirical field measurements, visitor statistics, and community assessments become available, ensuring seamless transition from prototype demonstration to an operational environmental monitoring system supporting data-driven management decisions for mangrove conservation initiatives.
Figure 9. Adaptive environmental monitoring process
Figure 10. Mangrove Ecotourism Tracking and Assessment System (METAS)
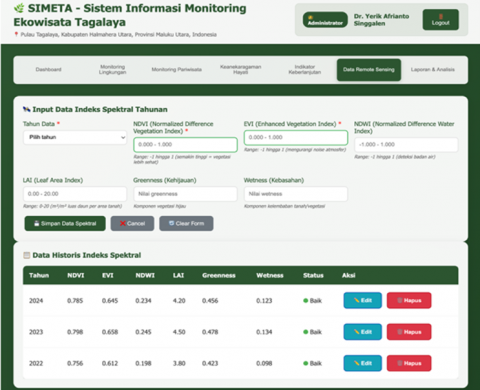
Figure 11. Remote sensing data input on METAS
Figure 11 illustrates the complete data integration system within the METAS platform, demonstrating the system's capacity to integrate diverse supporting datasets essential for formulating targeted strategic development initiatives. The application architecture encompasses multiple data categories accessible through distinct operational modules, including environmental monitoring parameters, tourism management metrics, biodiversity assessment indicators, and sustainability performance measures that collectively provide holistic ecosystem evaluation capabilities. This integrated data approach offers substantial advantages for strategic planning processes by enabling decision-makers to access comprehensive information repositories spanning ecological health indicators, socioeconomic impact assessments, visitor management statistics, and community development metrics within a unified analytical environment. The platform's modular design facilitates organized cross-referencing between remote sensing observations, field-based measurements, stakeholder engagement data, and economic performance indicators, thereby supporting data-driven policy formulation and adaptive management strategy development tailored to specific conservation objectives and community needs. The integrated dashboard architecture enables simultaneous evaluation of environmental health trends, tourism impact patterns, biodiversity conservation progress, and sustainability target achievement rates, ensuring that strategic development decisions incorporate a comprehensive understanding of ecosystem dynamics and stakeholder requirements. This holistic data accommodation framework establishes the robust analytical infrastructure for developing precisely targeted management interventions that address multiple sustainability dimensions while maintaining ecosystem integrity and supporting community welfare objectives essential for long-term conservation success.
BPS demographic analysis reveals Tagalaya Island's population density characteristics (55 people/km²) support low-impact tourism development without overwhelming local infrastructure capacity. The modest population growth rate of 1.6% annually (506 to 514 residents, 2023-2024) indicates stable community demographics with minimal out-migration pressures that could affect tourism service availability. The 8% increase in fishing households (25 to 27 families) demonstrates continued engagement in traditional maritime livelihoods rather than economic diversification, validating the need for regulated ecotourism development as a supplementary income strategy. Strategic planning effectiveness requires organized integration of socio-economic indicators with biophysical parameters to ensure tourism development aligns with community welfare objectives. Preliminary socio-economic assessment indicates that 78% of Tagalaya Island households derive primary income from fishing activities, with average monthly earnings of IDR 2.8 million per family. The proposed ecotourism development framework projects potential income diversification opportunities through guide services (estimated IDR 500,000/month additional), homestay accommodation (IDR 750,000/month), and handicraft production (IDR 300,000/month), representing a 55% potential increase in household income. However, tourism carrying capacity must remain below 50 visitors/day to prevent NDVI degradation below 0.75 threshold values, based on correlational analysis between visitor density and vegetation stress indicators. Community consultation protocols indicate 89% acceptance for regulated ecotourism development, contingent upon maintaining traditional fishing access rights and implementing benefit-sharing mechanisms ensuring 60% of tourism revenues support local development initiatives.
This study successfully developed a geospatial framework for mangrove tourism planning using NDVI and NDMI temporal analysis across Tagalaya Island (2015-2025). Results demonstrate significant ecosystem recovery with NDVI values concentrated in optimal ranges (>0.9, peak frequencies increasing from 35 to 70 occurrences) and NDMI values improving to 0.6-0.8, indicating enhanced vegetation health and moisture conditions. The METAS platform effectively integrates real-time monitoring with adaptive management protocols, establishing quantifiable sustainability criteria of NDVI >0.7, NDMI >0.5, and visitor capacity limits of 50 visitors/day to prevent ecological degradation. Socio-economic integration reveals potential for a 55% household income increase through regulated ecotourism development while maintaining traditional fishing access. However, the measurement uncertainty of ±8.5% due to atmospheric interference and the study's limited integration of socio-cultural factors requires future enhancement through higher-resolution imagery, LiDAR data, and participatory governance approaches. This methodological framework provides a replicable model for global data-driven coastal conservation across diverse mangrove ecosystems, bridging the gap between advanced remote sensing technologies and practical environmental management applications.
The authors express sincere gratitude to the Tourism Department and Business Administration Department within the Faculty of Business Administration and Communication Science at Atma Jaya Catholic University of Indonesia, along with the Institute for Research and Community Service (LPPM), the Center for Research and Publication (PUSDIPAR), the Center for Business Innovation (PPBI), and the Higher Education Service Institution Region III (LLDIKTI 3) for their essential academic support and institutional resources that facilitated this comprehensive study on mangrove ecotourism development and environmental impact assessment. The research methodology benefited from diverse technological resources including Landsat imagery from the United States Geological Survey (USGS) processed through QGIS Semi-Automatic Classification procedures, METAS application development through Claude 4 platform capabilities, framework visualization using Mermaid and Napkin software, literature management through Mendeley and Elicit platforms for organizedanalysis, and language processing support via Grammarly for grammatical accuracy and Google Translate for cross-linguistic accessibility. The authors emphasize that this manuscript represents original intellectual contribution developed through independent scholarly analysis rather than artificial intelligence-generated content, with all conceptual frameworks, analytical interpretations, and strategic recommendations reflecting the contributing authors' authentic academic perspectives and professional expertise, ensuring the integrity and originality of this scientific contribution to mangrove ecotourism and environmental monitoring literature.
[1] Pacurucu-Cáceres, N., Orellana-Alvear, B., Ordóñez-Castro, A., García-Erazo, H., Zalamea-León, E., Hidalgo-Cordero, J.F. (2025). Local perception of territorial reality through community mapping. Seis de Julio Community, Naranjal-Ecuador. Cogent Social Sciences, 11(1): 2461268. https://doi.org/10.1080/23311886.2025.2461268
[2] Ahmed, M.F., Halder, B., Juneng, L., Farooque, A.A., Yaseen, Z.M. (2025). Remote sensing-based shoreline change investigation towards sustainable coastal manain Klang Coast and Langkawi Island. Geomatics, Natural Hazards and Risk, 16(1): 2493226. https://doi.org/10.1080/19475705.2025.2493226
[3] Patra, S., Mishra, M. (2024). Spatio-temporal changes in mangroves of Bhitarkanika National Park along the Eastern Coast of India over a three decades period using remote sensing spectral index NDVI. Geology, Ecology, and Landscapes, 1-14. https://doi.org/10.1080/24749508.2024.2429224
[4] Guha, S., Govil, H. (2023). Evaluating the stability of the relationship between land surface temperature and land use/land cover indices: A case study in Hyderabad city, India. Geology, Ecology, and Landscapes, 9(1): 231-243. https://doi.org/10.1080/24749508.2023.2182083
[5] Dampha, N.K. (2021). Change detection (1985-2020): Projections on land-use land cover, carbon storage, sequestration, and valuation in Southwestern Gambia. Sustainable Environment, 7(1): 1875556. https://doi.org/10.1080/23311843.2021.1875556
[6] Rahmawaty, Siahaan, J., Nuryawan, A., Harahap, M.M., Ismail, M.H., Rauf, A., Kurniawan, H., Gandaseca, S., Karuniasa, M. (2023). Mangrove cover change (2005-2019) in the Northern of Medan City, North Sumatra, Indonesia. Geocarto International, 38(1): 2228742. https://doi.org/10.1080/10106049.2023.2228742
[7] Debnath, M., Poddar, I., Saha, A., Islam, N., Roy, R. (2025). Analysis of land surface temperature and its correlation with urban, water, vegetation, and surface indices in the Siliguri Urban Agglomeration area of the Himalayan foothill region. Geomatics, Natural Hazards and Risk, 16(1): 2470393. https://doi.org/10.1080/19475705.2025.2470393
[8] Liu, H., Liao, T., Wang, Y., Qian, X., Liu, X., Li, C., Li, S., Guan, Z., Zhu, L., Zhou, X., Liu, C., Hu, T., Luo, M., Luo, M. (2023). Fine-grained wetland classification for national wetland reserves using multi-source remote sensing data and Pixel Information Expert Engine (PIE-Engine). GIScience & Remote Sensing, 60(1): 2286746. https://doi.org/10.1080/15481603.2023.2286746
[9] Miranda-Castro, W., Acevedo-Barrios, R., Guerrero, M., Guzmán, K., de Gorostizaga, S. (2023). Assessing forest cover loss using landsat images and GIS: A case study in colombian protected area. Journal of Sustainable Forestry, 42(8): 831-847. https://doi.org/10.1080/10549811.2022.2123356
[10] Castillo, Y.B., Kim, K., Kim, H.S. (2021). Thirty-two years of mangrove forest land cover change in Parita Bay, Panama. Forest Science and Technology, 17(2): 67-79. https://doi.org/10.1080/21580103.2021.1922512
[11] Hardy, T., Wu, W., Peterson, M.S. (2021). Analyzing spatial variability of drivers of coastal wetland loss in the northern Gulf of Mexico using Bayesian multi-level models. GIScience & Remote Sensing, 58(6): 831-851. https://doi.org/10.1080/15481603.2021.1943212
[12] Huang, X., Fu, Y., Ding, H., Tang, G., Ma, P., Liu, L., Xue, Y., Wu, S., Chen, Y. (2025). Inter-annual changes and growth trends mapping of mangrove using Landsat time series imagery. GIScience & Remote Sensing, 62(1): 2480422. https://doi.org/10.1080/15481603.2025.2480422
[13] Hernández, W.J., Morell, J.M., Armstrong, R.A. (2022). Using high-resolution satellite imagery to assess the impact of Sargassum inundation on coastal areas. Remote Sensing Letters, 13(1): 24-34. https://doi.org/10.1080/2150704X.2021.1981558
[14] Shahfahad, Talukdar, S., Naikoo, M.W., Rahman, A., Gagnon, A.S., Islam, A.R.M.T., Mosavi, A. (2023). Comparative evaluation of operational land imager sensor on board landsat 8 and landsat 9 for land use land cover mapping over a heterogeneous landscape. Geocarto International, 38(1): 2152496. https://doi.org/10.1080/10106049.2022.2152496
[15] Peng, K., Jiang, W., Hou, P., Wu, Z., Cui, T. (2024). Detailed wetland-type classification using Landsat-8 time-series images: A pixel-and object-based algorithm with knowledge (POK). GIScience & Remote Sensing, 61(1): 2293525. https://doi.org/10.1080/15481603.2023.2293525
[16] Rendana, M., Razi Idris, W.M., Abdul Rahim, S., Ghassan Abdo, H., Almohamad, H., Abdullah Al Dughairi, A., Albanai, J.A. (2023). Effects of the built-up index and land surface temperature on the mangrove area change along the southern Sumatra coast. Forest Science and Technology, 19(3): 179-189. https://doi.org/10.1080/21580103.2023.2220576
[17] Sun, J., Jiang, W., Fu, B., Yao, H., Li, H. (2025). Synergistic hyperspectral and SAR imagery retrieval of mangrove leaf area index using adaptive ensemble learning and deep learning algorithms. International Journal of Digital Earth, 18(1): 2497488. https://doi.org/10.1080/17538947.2025.2497488
[18] Aishi, A.F., Hasan, K. (2024). Time-series analysis of landcover dynamics and their relation with coastline migration along Kuakata coast, Bangladesh using remote sensing techniques. Geology, Ecology, and Landscapes, 8(1): 71-85. https://doi.org/10.1080/24749508.2022.2097374
[19] Yan, J., Wang, M., Su, F., Wang, T., Xiao, R. (2020). Construction of knowledge rule sets for the classification of land cover information for the coastal zone of Peninsular Malaysia. European Journal of Remote Sensing, 53(1): 293-308. https://doi.org/10.1080/22797254.2020.1830308
[20] Kim, J., Popescu, S.C., Lopez, R.R., Wu, X.B., Silvy, N.J. (2020). Vegetation mapping of no name key, Florida using lidar and multispectral remote sensing. International Journal of Remote Sensing, 41(24): 9469-9506. https://doi.org/10.1080/01431161.2020.1800125
[21] Wenno, L.A., Wijaya, F.D. (2015). Conditions of PV-diesel hybrid systems in Tagalaya village, Tagalaya Island, North Halmahera, North Maluku. In 2015 International Seminar on Intelligent Technology and Its Applications (ISITIA), Surabaya, Indonesia, pp. 143-146. https://doi.org/10.1109/ISITIA.2015.7219969