Mayshafira Listianingsih![]() | Majidah Majidah*
| Majidah Majidah*![]()
© 2025 The authors. This article is published by IIETA and is licensed under the CC BY 4.0 license (http://creativecommons.org/licenses/by/4.0/).
OPEN ACCESS
Amid intensifying climate change and its implications for global sustainability, the transparent disclosure of carbon emissions has become a critical aspect of corporate environmental accountability. This study investigates the determinants of Carbon Emissions Disclosure (CED) by focusing on publicly listed firms included in the LQ45 index of the Indonesia Stock Exchange over the period 2021-2023. A total of 84 firm-year observations from 28 companies were selected using purposive sampling. Panel data regression analysis was conducted using Stata 17 to assess the influence of governance structure, capital allocation, financial slack, industry type, and membership in the Low Carbon Leaders (LCL) segment of the LQ45 index. The empirical findings indicate that director size (β1 = 0.008, p = 0.014), industry type (β5 = 0.0977, p < 0.001), and inclusion in the LQ45 LCL index (β6 = 0.0435, p < 0.001) serve as significant positive determinants of CED. In contrast, the proportion of female directors (β2 = -0.065, p < 0.001) and capital expenditure (β3 = -0.947, p = 0.018) were found to negatively influence disclosure levels. These results challenge conventional assumptions regarding the role of gender diversity and capital investment in promoting environmental transparency. Notably, the inclusion of the LQ45 LCL variable has not been previously explored as a determinant of CED in the Indonesian context, offering a novel contribution to the literature.
carbon emissions disclosure, board of directors, capital expenditure, financial slack, industry type, low carbon leaders, LQ45 index
One of the goals of the Sustainable Development Goals (SDGs), which are targeted for achievement by 2030, is to combat climate change — a pressing issue due to its potential to damage the world’s ecosystems [1]. As a commitment to global efforts in addressing climate change, various international forums and agreements have been established, including the Rio de Janeiro Earth Summit, the signing of the Kyoto Protocol in 1997, and the Paris Agreement in 2015 [2]. Indonesia also actively contributes to reducing Greenhouse Gas (GHG) emissions through the implementation of various national policies as a global community member [3]. One such effort is implemented through the issuance of regulations related to sustainable development, such as Presidential Decree No. 98 of 2021 on the implementation of the economic value of carbon to support the achievement of emission control targets in national development.
According to the Ministry of Energy and Mineral Resources, the government has set a GHG reduction target of 31.89% with its own capacity and 43.20% with international support by 2030 [4]. Indonesia also aims to achieve Net Zero Emission (NZE) in 2060. Various efforts have been made to control GHG emissions intensity, such as applying carbon credits, introducing carbon capture and storage technology, implementing renewable energy, and establishing a Reducing Emissions from Deforestation and Forest Degradation (REDD+) program. However, the reality is that the intensity of carbon emissions in Indonesia continues to increase. According to the Indonesian Central Statistics (2022), Indonesia’s total GHG emissions in 2022 reached 1,008,178 Gg carbon dioxide equivalent (CO₂e), with 77% of total emissions being carbon dioxide (CO2) [5]. Emissions continue to increase, from 957.373 million tons of CO₂e in 2017 to 1,200.20 million tons of CO₂e in 2023, representing a 25.36% increase, indicating a gap between the target and the realization of reductions [6].
One contributing factor to increased emissions is company behavior that is not in line with sustainability principles. For example, TPIA experienced a disruption in equipment that required the company to burn off the chimney or flaring, resulting in dense smoke and a strong odor [7]. Another relevant phenomenon is the charge of greenwashing against ADRO companies in the LQ45 index for continuing to develop a coal-fired captive steam power plant project to support their aluminum smelter operations. This practice is deemed to contradict the company's claims of a green energy transition and to hinder the achievement of Indonesia's NZE objective [8]. These phenomena lead to a question about companies’ motives for disclosing their carbon emissions, whether only to fulfill regulations or as a business strategy to maintain an image in the context of demanding environmental issues. Poorly managed GHG emissions are a negative effect not only for the environment but also for the social aspects of society. Therefore, corporate transparency in CED is important as a form of accountability for environmental performance [9].
Research on the determinants of CED has been conducted, including director size [10, 11], female directors [12, 13], capital expenditure [14, 15], financial slack [16-18], and industry type [19-21], which show inconsistent empirical results. Furthermore, research on LQ45 LCL as a determinant factor of CED has not been conducted in previous studies. Therefore, it is essential to investigate CED and the influencing factors, particularly for companies listed on the LQ45 index of the Indonesia Stock Exchange for the 2021-2023 period. CED contains business prospects and various data related to climate change used for stakeholders. It is part of sustainability reporting that reflects the company's concern for environmental issues [22]. The disclosure includes various aspects, such as carbon emissions intensity, energy consumption, strategies to deal with climate change, measures for carbon emissions reduction, and risk management due to climate change impacts [23]. CED is one example of risk reduction, which is a process that businesses use to reduce the risk of damages from operational activities [24].
2.1 Theoretical background
A corporate social contract requires the company to remain sensitive to environmental conditions and conduct its activities in accordance with environmental values. The theory of legitimacy reveals that businesses try to keep their operational activities in line with the norms and rules that apply to the surrounding community [25]. Company activities that are perceived as sensitive and detrimental to the environment will encourage management to utilize disclosure to redefine public perceptions in order to change stakeholder perceptions [26]. Disclosures are made by companies as a step to restore and enhance their image and legitimacy in society and with stakeholders [27].
In addition, the main principle in stakeholder theory is that each individual must be responsible for the consequences of their actions on others [28]. Therefore, the interests of each stakeholder need to be considered and treated differently according to the magnitude of the impact caused by the company. If the company can be well-received by the surrounding community, then it is possible to increase the value of the company to stakeholders [29]. To maintain a positive relationship with stakeholders, it is essential to disclose information about production activities that have an environmental impact [30]. One of the important steps companies can take to meet the needs and expectations of stakeholders is to disclose factors related to the sustainability of their business [16].
2.2 Hypothesis development
The board of directors is a group of professionals who have diverse skills, experience, and backgrounds to support the development of a company [31]. Carbon emissions are more likely to be disclosed by companies with a larger board of directors. Since there are many boards of directors, it is simpler to monitor how business activities impact the environment and implement various strategies to mitigate the effects of carbon emissions [32]. Furthermore, a larger board of directors can reduce agency conflicts that lead to increased disclosure of information, including carbon emissions, hence reducing information asymmetry for stakeholders [33].
H1: Director size is a positive determinant of CED.
A female director is a woman who has the responsibility and authority to lead, supervise, and participate in strategic decision-making at the highest level within an organization or company [34]. Females are more cautious and they use supporting evidence to make judgments. However, males are more pragmatic. Therefore, gender diversity on the board of directors has an essential role in the coverage and quality of sustainability reports [35]. Females can adopt a more stakeholder-oriented approach than males, which enables them to evaluate the interests of many stakeholders [36]. The substantial proportion of females on the board of directors encourages management to adopt responsible steps that can increase the company's connection with stakeholders, including CED [37].
H2: Female directors are positive determinants of CED.
Capital expenditure is a budget expenditure used to acquire fixed assets and other assets that provide long-term benefits beyond one accounting period [38]. Businesses with large capital expenditures want to communicate to the market the environmental effect of their operations because each additional unit of capital expenditure generates more carbon emissions. The signal seeks to lessen stakeholders' unfavorable opinions of the business's carbon emissions-related operations [14]. In addition, companies invest in renewable and clean energy and rehabilitate company assets to reduce the intensity of carbon emissions [39]. This indicates that companies participate in climate change prevention campaigns to gain legitimacy from society through evidence of reduced carbon emissions produced [40].
H3: Capital expenditure is a positive determinant of CED.
Financial slack refers to surplus, unrestricted financial resources, such as cash and receivables [41]. Companies with high financial slack show the ability to utilize their excess financial resources in carrying out activities that would be infeasible with lower levels of financial slack [27]. Financial resources play an important role in supporting companies to make strategic moves that have a significant impact, such as disclosures related to environmental issues. The allocation of these funds can include training programs to enhance employee awareness of energy savings, acquiring renewable energy sources, procuring fixed assets, and making green investments that focus on corporate sustainability [30].
H4: Financial slack is a positive determinant of CED.
Industry type describes a company's characteristics related to its line of business, business risks, workforce, and operating environment [42]. Industry types can be classified as high- or low-profile industries. High-profile industries attract public attention due to their extensive activities. Negligence in securing processes and production can have significant consequences for society [21]. Companies whose operational activities are related to the exploitation of natural resources, such as the materials, utilities, transportation, and energy sectors, are likely to produce larger amounts of exhaust emissions. The quantity of emissions is a key concern for companies as it affects the relationship and legitimacy between the company and society [43]. High levels of carbon emissions require establishing policies to report their production activities through social disclosure, including CED, with the aim that these activities can be in harmony with the surrounding environment and nature [44].
H5: Industry type is a positive determinant of CED.
The LQ45 LCL is an index designed to reduce the portfolio’s weighted average carbon intensity by 50% relative to the parent LQ45 index. Issuers that are part of the LQ45 LCL index are required to disclose Scope 1 and Scope 2 GHG emissions data in their sustainability reports [45]. Therefore, issuers included in this index should disclose more information on carbon emissions than those excluded from it.
H6: Companies included in the LQ45 LCL are a positive determinant of CED.
3.1 Research data and samples
This study is quantitative research with hypothesis testing. The research object is companies listed in the LQ45 index for the period 2021-2023, specifically 45 companies that meet the criteria for high stock transaction liquidity, market capitalization, and company fundamentals, such as financial performance and compliance level. Purposive sampling was used in this study based on the following specific criteria: (a) companies listed in the LQ45 index during the 2021-2023 period, (b) companies consistently included in the index throughout that period, and (c) companies that published complete annual and sustainability reports for each year from 2021 to 2023.
Based on the sampling criteria, 28 companies, or around 62% of the total 45 companies in the LQ45 index, were used as samples and considered capable of representing the population. Considering the three-year research period, the total number of observations analyzed is 84. The period from 2021 to 2023 was chosen because the companies included in the LQ45 index began to show concern for environmental issues starting in 2021.
3.2 Variable measurements
CED was measured using an index developed by Choi et al. [46], which encompasses various aspects across five categories comprising 18 items in total, covering both quality and quantity. These aspects include attention to climate change risks that could affect business continuity, GHG emissions calculations and the methodologies used, energy consumption disclosure to show the dominance of the types of energy used, and efforts to reduce GHG emissions by considering current and future costs, which reflect the company's commitment to reducing emissions. Additionally, the implementation of good corporate governance serves as an indicator that the company is evaluating issues related to climate change. The definitions and measurements of each variable in this study are presented in Table 1.
Table 1. Variable operationalization
|
Variable |
Indicator |
Scale |
|
CED (Y) |
Each item reported in the business's sustainability report receives a score of 1, while items that are not disclosed receive a score of 0 [46], with the calculation: Total score of disclosure items / Maximum possible disclosure score. |
Ratio |
|
Director size (X1) |
Total number of directors on the board [47] |
Ratio |
|
Female directors (X2) |
A dummy variable with a score of 1 if the firm has a female director and a score of 0 otherwise [48] |
Nominal |
|
Capital expenditure (X3) |
Ratio of asset acquisition value to total assets in previous year (t-1) [14] |
Ratio |
|
Financial slack (X4) |
Cash and cash equivalents/Total sales [27] |
Ratio |
|
Industry type (X5) |
A dummy variable with a score of 1 for companies categorized as carbon-intensive and a score of 0 for companies categorized as non-carbon-intensive [20] |
Nominal |
|
LQ45 LCL (X6) |
Dummy variable with a firm receiving a score of 1 if it is listed in the LQ45 LCL index and a score of 0 otherwise |
Nominal |
3.3 Data analysis techniques
Panel data regression analysis was conducted based on the selection of an appropriate estimation model between the fixed effects model (FEM), the random effects model (REM), and the pooled (common effects) model. The equation of the panel data regression model of this study is as follows:
$\begin{aligned} & C E D=\alpha+\beta_1 D S Z_{1 i t}+\beta_2 F M D_{2 i t}+\beta_3 C A P E X_{3 i t}+\beta_4 F S L A C K_{4 i t}+\beta_5 T I D_{5 i t}+\beta_6 L C L_{6 i t}+\varepsilon\end{aligned}$ (1)
where, α is the constant, β1 to β6 represent the regression coefficients, DSZ denotes the director size, FMD is the female directors, CAPEX denotes the capital expenditure, FSLACK represents the financial slack, TID is the industry type, LCL denotes the low carbon leader, t denotes the time period, i represents the i-th entity, and ε is the error standard.
4.1 Descriptive statistics analysis
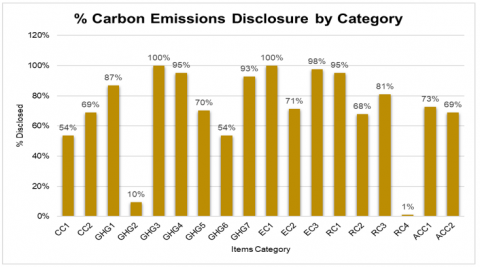
The results of the descriptive statistics are shown in Table 2. The mean of CED is 0.7149 with a standard deviation of 0.1532, meaning that companies listed on the LQ45 disclose carbon emissions by 71.49% or 13 items out of 18 disclosure items. Based on this, companies included in the LQ45 index show a good level of awareness in disclosing their carbon emissions-related activities to fulfill compliance, with disclosure details shown in Figure 1.
Table 2. Descriptive statistics
|
Ratio Scale |
|||||
|
Var. |
Obs |
Mean |
Std.dev |
Min |
Max |
|
ced |
84 |
.714944 |
.1532445 |
.3333 |
.9444 |
|
dsz |
84 |
8.071429 |
2.831772 |
4 |
15 |
|
capex |
84 |
.0473345 |
.0476294 |
.0011 |
.2828 |
|
fslack |
84 |
.2555083 |
.161477 |
.0082 |
.6666 |
|
Nominal Scale |
|||||
|
Var. |
Obs |
1 |
0 |
||
|
fmd |
84 |
.6428572 |
.3571428 |
||
|
tid |
84 |
.6785714 |
.3214286 |
||
|
lcl |
84 |
.5357143 |
.4642857 |
||
Figure 1. Details of CED
The majority of these companies do not disclose the item of future emissions cost calculated in capital expenditure planning (RC4), and the item indicating the existence of external verification of carbon emissions calculation (GHG2). Meanwhile, the mean of director size is 8.0714 with a standard deviation of 2.8317. This indicates that the company has at least eight members on the board of directors. The number of directors is sufficient to support an effective distribution of responsibilities. Female director has a mean value of 0.6428 with a standard deviation of 0.4820, indicating that more than 50% of companies in LQ45 have female directors in their corporate structure. Capital expenditure has a mean value of 0.0473 with a standard deviation of 0.0476. This indicates that LQ45 companies allocate 4.73% of their total assets for capital expenditure. A higher standard deviation indicates variation, which reflects the different investment needs of each company. The allocation of 4.73% is relatively moderate or low, especially for companies in the energy, mining, and manufacturing sectors, indicating limited investment in asset expansion or renewal and a focus on efficiency, except for infrastructure industry companies that have high capital expenditure values.
Furthermore, the financial slack mean is 0.2555, and the standard deviation is 0.1614. This value suggests that LQ45 companies have financial availability around 25.55% which reflects a relatively high level of liquidity compared to companies in Indonesia, ranging from 15% to 25%. This condition shows the company's conservative strategy to maintain financial flexibility or reflects suboptimal utilization of funds for productive investment. Then, the mean of industry type is 0.6785 and the standard deviation is 0.4898. This shows that around 67.85% of LQ45 companies are included in the category of high carbon intensive companies, i.e., companies in the energy, transportation, materials and utilities industries that produce high carbon emissions and have high potential for environmental pollution. LQ45 LCL has a mean value of 0.5357 with a standard deviation of 0.5017. This shows that 53.57% of the LQ45-indexed companies are also included in the LQ45 LCL-indexed companies.
4.2 Inferential/inductive analysis
4.2.1 Selection of the best model
The selection process of the panel data regression model includes the Chow likelihood ratio test to determine between the pooled model and FEM, the Lagrange Multiplier (LM) test to determine between the pooled model and REM, and the Hausman test to determine between REM and FEM. The results are shown in Table 3.
Table 3. Panel data regression model selection results
|
Panel Data Model Testing |
|||||
|
Chow likelihood test |
|||||
|
F test that all u_i=0: F(27,52) =2.47 |
Prob > F = 0.0009 |
||||
|
LM test |
|||||
|
Estimated results: |
|
|
|||
|
|
Var |
SD = sqrt(Var) |
|||
|
ced |
.0234839 |
.1532445 |
|||
|
e |
.0129476 |
.1137873 |
|||
|
u |
.0059902 |
.0773966 |
|||
|
Test: Var (u) = 0 |
|
||||
|
|
chibar2(01) = |
3.31 |
|||
|
|
Prob > chibar2 = |
0.0344 |
|||
|
Hausman test |
|||||
|
|
(b) fixed |
(B) random |
(b-B) difference |
Sqrt(diag(V_b-V_B)) Std.err. |
|
|
dsz |
.0160903 |
.0114517 |
.0046386 |
.037067 |
|
|
fmd |
.0528023 |
-.0525535 |
.1053558 |
.0689312 |
|
|
capex |
-.0407965 |
-.6292826 |
.5884861 |
.3142327 |
|
|
fslack |
-.3564505 |
-.1240286 |
-.2324219 |
.1415635 |
|
|
chi2 (4) = (b-B) ‘ [(V_b-V_B)^(-1)] (b-B) |
|||||
|
= 11.60 |
|||||
|
Prob > chi2 = 0.0206 |
|||||
The Chow likelihood test suggests that FEM is greater than the common/pool model because prob.= 0.000 < α (0.05). According to the findings of the LM test, REM is greater than the common/pool model because prob.= 0.034 < α (0.05). Meanwhile, the Hausman test determined that FEM is greater than REM because prob.= 0.0206 < α (0.05). FEM was selected as the statistically best model out of the three tests. Classical assumption tests were performed instead of directly interpreting FEM's output. FEM can be interpreted directly if all assumptions are met; otherwise, modifications must be made before interpretation.
4.2.2 Classical assumption test
In the classical assumption test, the Ordinary Least Squares (OLS) approach was used, including the normality, multicollinearity, heteroscedasticity, and autocorrelation tests. The output is in Table 4. The results of the normality test indicate that the data is normally distributed because prob.= 0.2708 > α (0.05). This result aligns with the large number theory and the Gaussian central limit theory, which states that if n >30, then the data may be assumed to be normally distributed. The autocorrelation test shows that the model is not free of autocorrelation because prob.= 0.000 < α (0.05). Therefore, FEM with Panel-Corrected Standard Error (PCSE) is robust to autocorrelation. According to the White test findings that the data prob. = 0.233, which is larger than α (0.05), it indicates that FEM is robust to heteroscedasticity. The multicollinearity test also shows that the Variance Inflation Factor (VIF) is less than 10, indicating that H0 is not rejected and the model is free of multicollinearity assumptions. In this case, there is only the autocorrelation violation. Therefore, the selected FEM was transformed using PCSE, as shown in Table 5.
Table 4. Classical assumption test results
|
Classical Assumption Test |
|||||||
|
Normality: Skewness and kurtosis tests |
|||||||
|
Var. |
Obs |
Pr(skewness) |
Pr(kurtosis) |
Adj chi2(2) |
Prob>chi2 |
||
|
resid |
84 |
0.1774 |
0.3987 |
2.61 |
0.2708 |
||
|
Autocorrelation: Wooldridge test |
|||||||
|
H0: No. first-order autocorrelation |
|||||||
|
F( 1, 27) = 67.876 |
|
||||||
|
Prob > F = 0.0000 |
|||||||
|
Heteroskedasticity: White test |
|||||||
|
Variable: fitted values of ced |
|||||||
|
H0: constant variance |
|||||||
|
chi(1) = 1.42 |
|||||||
|
Prob > chi2 = 0.2330 |
|||||||
|
Multicollinearity test |
|||||||
|
Variable |
VIF |
1/VIF |
|||||
|
tid |
1.46 |
0.687142 |
|||||
|
dsz |
1.38 |
0.723029 |
|||||
|
lcl |
1.38 |
0.725642 |
|||||
|
fmd |
1.36 |
0.732663 |
|||||
|
fslack |
1.29 |
0.772832 |
|||||
|
capex |
1.17 |
0.853672 |
|||||
|
Mean VIF |
1.34 |
|
|||||
Table 5. PCSE results
|
Variable |
Pooled |
Fixed |
Random |
PCSE |
|
dsz |
.00850955 |
.0160903 |
.01145166 |
.00850955* |
|
fmd |
-.05658765 |
.05280228 |
-.05255348 |
-.05658765*** |
|
capex |
-.94746983** |
-.04079655 |
-.62928264 |
-.94746983* |
|
fslack |
-.04509617 |
-.35645049 |
-.12402863 |
-.04509617 |
|
tid |
.09778788* |
(omitted) |
.10977199* |
.09778788*** |
|
lcl |
.04351402 |
(omitted) |
.04022965 |
.04351402*** |
|
_cons |
.6493409*** |
.64413513* |
.62173455*** |
.6493409*** |
|
N |
84 |
84 |
84 |
84 |
|
r2 |
.22505093 |
.08603261 |
|
.22505093 |
|
r2_a |
.16466529 |
-.45883256 |
|
|
|
r2_o |
|
.0026817 |
.20951739 |
|
|
F |
3.7268948 |
1.2237023 |
|
|
|
p |
|
.3121192 |
.07279555 |
2.33e-250 |
|
chi2 |
|
|
11.549956 |
1173.7179 |
|
Legend: * p<0.05; ** p<0.01; *** p<0.001 |
||||
4.2.3 Test of goodness fit
a) R-squared test
The R-squared test was used to assess whether the chosen regression model was appropriate for the study. The R-squared value is 0.2251. With an R-squared value of over 20%, the model can be considered good, indicating that all independent variables together can explain the variance and contribute to the dependent variable, which is 22.51% of the variation, with the remaining portion attributed to factors not included in the model. The chi2 statistic and the probability value are 0.000, which is less than 0.05. Therefore, H0 is rejected. It can be concluded that the model is suitable (fit) at a significance level of 5%. The results of the R-squared test are presented in Table 6.
b) Partial test (t test)
Partial hypothesis significance testing (t test) was performed and the results are presented in Table 7.
Table 6. T test results
|
Var. |
Coef |
Z |
P>|z| |
|
dsz |
0.0085096 |
2.45 |
0.014 |
|
fmd |
‐0.0565876 |
‐6.11 |
0.000 |
|
capex |
‐0.9474698 |
‐2.36 |
0.018 |
|
fslack |
‐0.0450962 |
‐0.64 |
0.522 |
|
tid |
0.0977879 |
5.99 |
0.000 |
|
lcl |
0.043514 |
4.17 |
0.000 |
|
_cons |
0.6493409 |
10.52 |
0.000 |
Table 7. R-squared results
|
Linear Regression, Correlated PCSE |
|||
|
Group variable: |
company |
Number of obs = |
84 |
|
Time variable: |
year |
Number of groups = |
28 |
|
Panels: |
correlated (balanced) |
Obs per group: |
|
|
Autocorrelation: |
no autocorrelation |
min = |
3 |
|
|
|
avg = |
3 |
|
|
|
max = |
3 |
|
Estimated covariances = |
406 |
R-squared = |
0.2251 |
|
Estimated autocorrelation = |
0 |
Wald chi2(6) = |
1173.72 |
|
Estimated coefficients = |
7 |
Prob > chi2 = |
0.0000 |
4.3 Discussion of research results
The regression coefficient of director size (β1) is 0.008 and the significance value is 0.014, which is less than 0.05, indicating that director size is a positive determinant of CED (Table 7). This result is consistent with the findings of some studies [10, 49] and accepts hypothesis H1. Companies with a larger director size find it easier to disclose carbon emissions. With a mean board of directors of eight people, the impact on how business activities affect the environment can be monitored, promoting CED. This is consistent with the stakeholder theory, which states that stakeholder-oriented companies tend to disclose environmental information transparently to satisfy social demands, comply with legal requirements, and maintain good relations with investors and the public.
The regression coefficient of female director (β2) is -0.065 with a significance value of 0.000, which is less than 0.05, indicating that female director is a negative determinant of CED (Table 7). This finding rejects hypothesis H2. Although females generally have a high level of concern for environmental issues and demonstrate caution in making strategic decisions, as they recognize that CED impacts the long-term sustainability of a business. However, their low level of representation in management structures can limit their influence on environmental disclosure policies. Additionally, female directors with a financial background tend to focus more on cost efficiency and financial risk management. Given that CED often requires additional budget allocation and may pose reputational risks for the company, they may choose not to disclose such information widely or only do so selectively to maintain the company's financial stability. This approach is considered rational as it can send a positive signal to the market, particularly regarding short-term financial performance. Furthermore, Wang et al. [34] utilized the upper echelon theory and demonstrated that female directors are politically connected to social responsibility. This suggests that in specific contexts, social issues such as employee welfare, gender equality, and local community concerns may be prioritized over environmental issues, including carbon emissions, in a company's strategic agenda. Furthermore, the relationship between external female directors and Corporate Social Responsibility (CSR) disclosure, including CED, exhibits an inverted U-shaped pattern. Their presence initially increases CSR reporting, which is in line with the monitoring hypothesis, but decreases after reaching a certain point, which is in line with the takeover hypothesis [50]. This pattern suggests that female directors' contributions to environmental disclosure are dynamic and highly contingent upon the company's context and the extent of their involvement in the governance structure.
The regression coefficient of capital expenditure (β3) is -0.947 with a significance value of 0.018, which is less than 0.05, suggesting that capital expenditure is a negative determinant of CED (Table 7). These findings reject hypothesis H3 because an average of 4.73% of the capital expenditure of LQ45 companies is allocated to the procurement of operational assets that have the potential to generate high carbon emissions, compared to investments in assets that support environmentally friendly practices, such as the purchase of solar panels and electric vehicles. In addition, capital expenditure reflects the company's focus on asset expansion and increased production capacity. These investments are prioritized because they are considered to have a direct impact on operational performance and long-term profit potential. However, in the context of sustainability reporting, large allocations of funds for capital expenditure can shift companies' attention and resources away from non-financial activities such as CED. The carbon emissions reporting process requires monitoring systems, experts, and environmental audits, all of which require additional costs and time. In situations where companies emphasize operational efficiency and return on investment, environmental disclosure may be viewed as a non-urgent burden. Furthermore, according to the theory of legitimacy and strategic management proposed by Cho et al. [51], environmental information disclosure is used as a means to shape positive perceptions among stakeholders. Therefore, if a company assesses that the capital expenditures undertaken are not sufficient to demonstrate environmental performance improvements, or that the information is not material and will not have a significant reputational impact, the company is likely to choose not to disclose it.
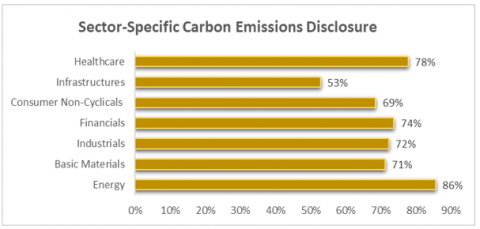
The financial slack regression coefficient (β4) is -0.045 with a significance value of 0.522, which is larger than 0.05, indicating that financial slack is not a determinant of CED (Table 7). These findings reject hypothesis H4. Companies do not use their surplus financial resources in making disclosures for the company's legitimacy. Instead, the surplus financial resources are used for something more profitable such as product research & development processes to maximize their profits. The regression coefficient of industry type (β5) is 0.0977 with a significance value of 0.000, which is less than 0.05, indicating that industry type is a positive determinant of CED (Table 7). This finding aligns with the results of the study by Saraswati et al. [19] and accepts hypothesis H5. These results align with the average carbon emissions per industrial sector presented in Figure 2.
Figure 2. Disclosure of carbon emissions by each business sector
Figure 2 shows that LQ45 companies in the energy sector, which are classified as carbon-intensive, have the highest average CED value at 85.56%. Companies in industries with high carbon emissions, such as energy, manufacturing, agriculture, and waste management, face greater pressure to disclose their carbon emissions information due to the environmental impact of their operations. This pressure is reinforced by regulations such as POJK No. 51/POJK.03/2017, which requires reporting and verification of emissions. To maintain their reputation and legitimacy, companies in this sector are encouraged to increase transparency by disclosing their carbon emissions, thereby maintaining stakeholder trust.
The LQ45 LCL regression coefficient (β6) is 0.0435 with a significance value of 0.000, which is less than 0.05, indicating that LQ45 LCL is a positive determinant of CED (Table 7). The companies' inclusion in the LQ45 LCL index on the Indonesia Stock Exchange demonstrates their commitment to controlling carbon emissions and implementing sustainability principles. Companies included in this index have reduced their carbon emissions by up to 50%, earning them the title of LCL. This indicates that these companies not only actively implement emission reduction policies but also demonstrate a high level of transparency in their carbon emissions reporting. Participation in the LCL index also encourages companies to meet stricter reporting standards as part of their legitimacy strategy and as a response to pressure from investors, authorities, and the public. With a strong sustainability reputation, these companies tend to provide more detailed information on carbon emissions as a demonstration of responsibility and efforts to maintain stakeholder trust. Therefore, inclusion in the LCL index positively contributes to the quality of CED by companies.
This study concludes that the mean of CED LQ45 companies is 71.49% and most of these companies do not disclose the part of future emission costs calculated in capital expenditure planning and the existence of external verification of carbon emission calculations. In addition, 53.57% of companies in LQ45 are also included in the LQ45 LCL companies and show that these companies are not only focused on high market capitalization but also have a high awareness of environmental disclosure by actively disclosing GHG emissions scope 1 (direct emissions from operations) and scope 2 (indirect emissions from purchased energy use). Furthermore, LQ45 companies allocate around 4.73% of their total assets to capital expenditure. This percentage is moderate or low, especially for companies belonging to the energy, mining, and manufacturing sectors. The exception is infrastructure sector companies which have a higher proportion of capital expenditure.
In addition, director size is a positive determinant of CED. A company’s director size helps it to monitor how its activities affect the environment and increase CED. In contrast, the presence of female directors is a negative determinant of CED, and the representation of females on the board of directors may have an impact on the company's environmental transparency policies. However, this effect may not reflect an increase in disclosure. Furthermore, capital expenditure is a negative determinant of CED caused by the companies' tendency to use capital expenditure for operational activities that have the potential to increase emissions, rather than investing in environmentally sustainable technology. Industry type is a positive determinant of CED, as companies operating in sectors with high environmental risks tend to disclose due to pressure from the public, government, and other stakeholders. LQ45 LCL companies are a positive determinant of CED. Participation in this index encourages companies to be more transparent and responsible in reporting their environmental performance, thereby preserving their reputation and satisfying the expectations of investors and regulators.
This study has certain limitations. The total number of samples is limited to 28 out of 45 LQ45 companies, totaling 84 observations, due to the companies' focus on sustainability issues, which has only developed since 2021. However, the sample represents around 62% of the total population of LQ45 companies. Therefore, it is still relevant for analysis. According to the study results, it is recommended that businesses prioritize disclosing their carbon emissions as part of their social and environmental responsibilities. Companies are also suggested to allocate capital to investments that support sustainability, such as environmentally friendly operational equipment and renewable energy resources. In addition, the company's surplus cash should be used to support transparent environmental disclosure and reporting activities.
[1] Manurung, D., Hardika, A., Hapsari, D., Sebayang, M. (2018). The role of corporate governance and environmental committees on greenhouse gas disclosure. Journal of Environmental Management and Tourism, 9(7): 1403-1413.
[2] Seo, S.N. (2017). Beyond the Paris agreement: Climate change policy negotiations and future directions. Regional Science Policy and Practice, 9(2): 121-141. https://doi.org/10.1111/rsp3.12090
[3] Manurung, D.T.H., Hardika, A., Hapsari, D.W., Christian, F. (2020). The affecting factors of greenhouse gases disclosure. Quality - Access to Success, 21(174): 121-127.
[4] Adi, A.C. (2024). Pemerintah sukses tekan emisi GRK dan intensitas energi primer. https://www.esdm.go.id/id/media-center/arsip-berita/pemerintah-sukses-tekan-emisi-grk-dan-intensitas-energi-primer.
[5] Mahmud, M.E., Kurniawan, P.A., Tasriah, E., Anggraini, W., Firdaus, Z.F. (2024). Neraca arus energi dan neraca emisi gas rumah kaca Indonesia 2018-2022. https://www.bps.go.id/id/publication/2024/06/21/87d30b44adc5c5eed7581f4b/neraca-arus-energi-dan-neraca-emisi-gas-rumah-kaca-indonesia-2018-2022.html.
[6] Alfathi, B.R. (2024). Perkembangan emisi gas rumah kaca Indonesia tahun 2013-2023. https://data.goodstats.id/statistic/perkembangan-emisi-gas-rumah-kaca-indonesia-tahun-2013-2023-aDUqo.
[7] Hasyim, I. (2024). Asap pabrik kimia racuni ratusan warga Cilegon, bukti pencemaran tunggu uji lab. Tempo. https://www.tempo.co/lingkungan/asap-pabrik-kimia-racuni-ratusan-warga-cilegon-bukti-pencemaran-tunggu-uji-lab-92157.
[8] Hasiana, D. (2024). Dituduh greenwashing gegara PLTU batu bara, begini respons ADRO. Bloomberg Technoz. https://www.bloombergtechnoz.com/detail-news/41058/dituduh-greenwashing-gegara-pltu-batu-bara-begini-respons-adro.
[9] Greenstone, M., Leuz, C., Breuer, P. (2023). What might disclosure rules reveal about corporate carbon damages? Energy Policy Institute at Chicago. https://epic.uchicago.edu/insights/what-might-disclosure-rules-reveal-about-corporate-carbon-damages/.
[10] Simamora, R.N.H., Safrida, & Elviani, S. (2022). Carbon emission disclosure in Indonesia: Viewed from the aspect of board of directors, managerial ownership, and audit committee. Journal of Contemporary Accounting, 4(1): 1-9. https://doi.org/10.20885/jca.vol4.iss1.art1
[11] Budiharta, P., Kacaribu, H.E.P.B. (2020). The influence of board of directors, managerial ownership, and audit committee on carbon emission disclosure: A study of non-financial companies listed on BEI. Review of Integrative Business and Economics Research, 9(3): 75-87.
[12] Saadah, K., Setiawan, D., Probohudono, A.N., Gantyowati, E. (2024). The role of women in top management in carbon emission disclosure - Evidence from banking entities in ASEAN. Journal of Open Innovation: Technology, Market, and Complexity, 10(3): 100330. https://doi.org/10.1016/j.joitmc.2024.100330
[13] Mardini, G.H., Elleuch Lahyani, F. (2023). The relevance of carbon performance and board characteristics on carbon disclosure. Studies in Economics and Finance, 41(3): 660-683. https://doi.org/10.1108/SEF-02-2023-0056
[14] Karim, A.E., Albitar, K., Elmarzouky, M. (2021). A novel measure of corporate carbon emission disclosure, the effect of capital expenditures and corporate governance. Journal of Environmental Management, 290: 112581. https://doi.org/10.1016/j.jenvman.2021.112581
[15] Widiyati, D. (2023). Contributing factors of carbon emission disclosure: Evidence from transportation companies in Indonesia. Atestasi: Jurnal Ilmiah Akuntansi, 6(1): 377-390. https://doi.org/10.57178/atestasi.v6i1.1
[16] Allam, G.A., Diyanty, V. (2020). Determinants of carbon emission disclosure. Journal of Economics, Business, and Accountancy Ventura, 22(3): 333-346. https://doi.org/10.14414/jebav.v22i3.1207
[17] Aini, K.N., Murtiningsih, R., Baroroh, N., Jati, K.W. (2022). The effect of financial slack, institutional ownership, media exposure on carbon emission disclosure with solvability ratio as a moderating variable. In Advances in Economics, Business and Management Research (Vol. 2). Atlantis Press. https://doi.org/10.2991/aebmr.k.220104.022
[18] Mahardika, R.P.P.P., Kawedar, W. (2019). Pengaruh faktor-faktor ekonomi greenhouse gas emission disclosure dan pengaruhnya terhadap reaksi saham. Diponegoro Journal of Accounting, 8(3): 1-11.
[19] Saraswati, E., Amalia, R.S., Herawati, T. (2021). Determinants of carbon emission disclosure in Indonesia manufacturing company. Asian Journal of Economics, Business and Accounting, 21(3): 1-9. https://doi.org/10.9734/ajeba/2021/v21i330356
[20] Meiryani, M., Huang, S.M., Warganegara, D.L., Ariefianto, M.D., Teresa, V., Oktavianie, H. (2023). The effect of industrial type, environmental performance and leverage on carbon emission disclosure: Evidence from Indonesian LQ45 companies. International Journal of Energy Economics and Policy, 13(4): 622-633. https://doi.org/10.32479/ijeep.14466
[21] (2022). The influence of proper rating, industrial type, gender diversity on carbon emission disclosure (Case study at LQ45 companies listed on the Indonesia stock exchange 2019-2021 period). In Proceedings of the International Conference on Industrial Engineering and Operations Management, pp. 4060-4069. https://doi.org/10.46254/AP03.20220654
[22] Ding, D., Liu, B., Chang, M. (2022). Carbon emissions and TCFD aligned climate-related information disclosures. Journal of Business Ethics, 182(4): 967-1001. https://doi.org/10.1007/s10551-022-05292-x
[23] Kurnia, P., Darlis, E., Putr, A.A. (2020). Carbon emission disclosure, good corporate governance, financial performance, and firm value. The Journal of Asian Finance, Economics and Business, 7(12): 223-231. https://doi.org/10.13106/JAFEB.2020.VOL7.NO12.223
[24] Majidah, M., Galih Pangestu, F.I. (2022). Determinant factors of corporate social responsibility disclosure. In Proceedings of the International Conference on Industrial Engineering and Operations Management, pp. 2868-2878. https://doi.org/10.46254/EU05.20220560
[25] Olateju, D.J., Olateju, O.A., Adeoye, S.V., Ilyas, I.S. (2021). A critical review of the application of the legitimacy theory to corporate social responsibility. International Journal of Managerial Studies and Research, 9(3): 1-6. https://doi.org/10.20431/2349-0349.0903001
[26] Wilmshurst, T.D., Frost, G.R. (2000). Corporate environmental reporting. Accounting, Auditing and Accountability Journal, 13(1): 10-26. https://doi.org/10.1108/09513570010316126
[27] Chithambo, L., Tauringana, V. (2014). Company specific determinants of greenhouse gases disclosures. Journal of Applied Accounting Research, 15(3): 323-338. https://doi.org/10.1108/JAAR-11-2013-0087
[28] Krisnawati, A., Yudoko, G., Bangun, Y.R. (2014). Development path of corporate social responsibility theories. World Applied Sciences Journal, 30: 110-120. http://doi.org/10.5829/idosi.wasj.2014.30.icmrp.17
[29] Dorobantu, S., Odziemkowska, K. (2017). Valuing stakeholder governance: Property rights, community mobilization, and firm value. Strategic Management Journal, 38(13): 2682-2703. https://doi.org/10.1002/smj.2675
[30] Rafsanjani, R., Mappanyukki, R. (2024). The effect of capital expenditure, debt maturity, financial slack on carbon emission disclosure. Zenodo. https://doi.org/10.5281/ZENODO.10548566
[31] Yocam, E., Choi, A. (2010). Corporate Governance: A Board Director's Pocket Guide (2nd ed.). iUniverse.
[32] Datt, R.R., Luo, L., Tang, Q. (2019). The impact of legitimacy threat on the choice of external carbon assurance. Accounting Research Journal, 32(2): 181-202. https://doi.org/10.1108/ARJ-03-2017-0050
[33] Buertey, S., Sun, E.J., Lee, J.S., Hwang, J. (2019). Corporate social responsibility and earnings management: The moderating effect of corporate governance mechanisms. Corporate Social Responsibility and Environmental Management, 27(1): 256-271. https://doi.org/10.1002/csr.1803
[34] Wang, Y., Ma, J., Wang, T. (2021). Do all female directors have the same impact on corporate social responsibility? The role of their political connection. Asia Pacific Journal of Management, 40(3): 1047-1074. https://doi.org/10.1007/s10490-021-09754-0
[35] Majidah, M., Muslih, M. (2019). Sustainability report: Women directors, competencies of commissioners and corporate characteristics. In Proceedings of the 1st International Conference on Economics, Business, Entrepreneurship, and Finance (ICEBEF 2018). https://doi.org/10.2991/icebef-18.2019.131
[36] Haque, F. (2017). The effects of board characteristics and sustainable compensation policy on carbon performance of UK firms. The British Accounting Review, 49(3): 347-364. https://doi.org/10.1016/j.bar.2017.01.001
[37] Gonenc, H., Krasnikova, A.V. (2022). Board gender diversity and voluntary carbon emission disclosure. Sustainability, 14(21): 14418. https://doi.org/10.3390/su142114418
[38] Sawyer, T.Y. (2014). Operating and capital expenditures models: Manage your budget. In Financial Modeling for Business Owners and Entrepreneurs. Apress, pp. 185-211. https://doi.org/10.1007/978-1-4842-0370-5_9
[39] Siddiqua, G.A., ur Rehman, A., Hussain, S. (2018). Asymmetric targeting of corporate cash holdings and financial constraints in Pakistani firms. Journal of Asian Business and Economic Studies, 26(1): 76-97. https://doi.org/10.1108/JABES-07-2018-0056
[40] Ratmono, D., Darsono, D., Selviana, S. (2020). Effect of carbon performance, company characteristics and environmental performance on carbon emission disclosure: Evidence from Indonesia. International Journal of Energy Economics and Policy, 11(1): 101-109. https://doi.org/10.32479/ijeep.10456
[41] Riantoni, I.A. (2023). The effect of corporate governance on R&D investment with financial slack as a mediating variable. I-Finance: A Research Journal on Islamic Finance, 9(2): 234-251. https://doi.org/10.19109/ifinance.v9i2.20465
[42] Grünig, R., Kühn, R., Morschett, D. (2022). Industry analysis. In The Strategy Planning Process. Springer International Publishing, pp. 161-172. https://doi.org/10.1007/978-3-030-93918-2_18
[43] Camilleri, M.A. (2017). Corporate Sustainability, Social Responsibility and Environmental Management. Springer International Publishing. https://doi.org/10.1007/978-3-319-46849-5
[44] Hery, S.E. (2023). Controllership Knowledge and Management Approach. PT Grasindo.
[45] Panduan indeks IDX LQ45 low carbon leaders. (2022). Indonesia Stock Exchange. https://idx.co.id/media/20221380/lampiran-2-panduan-indeks-idxlq45lcl.pdf.
[46] Bae Choi, B., Lee, D., Psaros, J. (2013). An analysis of Australian company carbon emission disclosures. Pacific Accounting Review, 25(1): 58-79. https://doi.org/10.1108/01140581311318968
[47] Ezekiel, O., Olugbenro, S., Omojola, S., Wright, O., Aregbesola, O. (2024). Influence of board characteristics on carbon emission disclosure: Evidence from the Nigerian oil and gas sector. International Journal of Energy Economics and Policy, 14(5): 582-592. https://doi.org/10.32479/ijeep.16666
[48] He, R., Zhou, M., Liu, J., Yang, Q. (2021). Female directors and carbon information disclosure: Evidence from China. Discrete Dynamics in Nature and Society, 2021: 1-16. https://doi.org/10.1155/2021/7772601
[49] Alfi, C.F., Mohamad, M., Hussainey, K. (2024). Unveiling the hidden symphony: Board dynamics and carbon emission disclosure - A meta-analysis study in the realm of developed markets. Journal of Accounting Literature, 47(2): 404-432. https://doi.org/10.1108/JAL-07-2023-0126
[50] Pucheta-Martínez, M.C., Bel-Oms, I., Olcina-Sempere, G. (2018). The association between board gender diversity and financial reporting quality, corporate performance and corporate social responsibility disclosure. Academia Revista Latinoamericana de Administración, 31(1): 177-194. https://doi.org/10.1108/ARLA-04-2017-0110
[51] Cho, C.H., Freedman, M., Patten, D.M. (2012). Corporate disclosure of environmental capital expenditures. Accounting, Auditing and Accountability Journal, 25(3): 486-507. https://doi.org/10.1108/09513571211209617