Dhuha Algburi![]() | Baydaa Abdul Hussein Bedewy*
| Baydaa Abdul Hussein Bedewy*![]() | Abdul Sahib Naji Al-Baghdadi
| Abdul Sahib Naji Al-Baghdadi![]()
© 2025 The authors. This article is published by IIETA and is licensed under the CC BY 4.0 license (http://creativecommons.org/licenses/by/4.0/).
OPEN ACCESS
This study investigated the impact of residential land redistribution on urban growth. It also examined population density management in Najaf by comparing Al-Furat, Al-Amir, and Al-Shurta areas. The study lasted from 2000 to 2023. Resubdivision methods were examined to determine how they addressed population growth demands and enhanced residential land use distribution. It also explored the planning, social, and economic issues that changed these areas' urban landscapes. Based on the geographical analysis of maps from the investigated years, re-subdivision improved land usage and public services, notably in the Al-Furat and Amir areas. Significant resubdivision rates were 29.63% and 31.58%. Meanwhile, Al-Shurta had little change. Its unique location and residential purpose raised it to 2.75%. The data also showed a definite urban tendency to convert open areas into residential and commercial units, and to alter land use patterns to meet population demands. Spatial analysis was performed using Geographic Information Systems (GIS) and the statistical software SPSS 29. After conducting T-test and ANOVA analysis, significant differences were found for most uses, including residential, which is the focus of our research. The analysis revealed the percentage of urban distortion resulting from residential redevelopment, pressure on services, and the housing ratio. These percentages were achieved at levels less than 0.05, reaching 0.001 and 0.009. They were graded from 2000 to 2023, the periods used for comparison and analysis. This highlights the importance of re-subdividing in urban management and enhancing quality of life. The research concluded that re-subdivision can improve urban fabric if accompanied by a balanced planning framework that considers environmental conservation and provides adequate infrastructure to meet future population growth.
urban distortion, subdivision, land management, residential land, re-subdivision
Obtaining residential land is one of the most crucial requirements for people in today's time, as it represents stability, security, and an enhanced standard of living. Consequently, securing residential land for every family is an aspiration pursued by planners through various ongoing activities. Residential subdivision is one of the most important processes affecting the development of a residential area. However, once this process occurs, it requires new infrastructure services for the communities it creates. Therefore, it is important to ensure that subdivisions comply with the laws and obtain a subdivision license. Subdivision instructions should enable local authorities to regulate major developments in residential areas. The most important of these are spaces designated for housing, such as low-rise single-family housing units. On the other hand, these residential plots are undergoing a process of re-subdivision, which was previously permitted under certain municipal legislation [1].
Urban morphology and land use theory, which incorporate the ideas of sustainable urban development and land redevelopment, form the basis of the theoretical framework. Conceptually, redevelopment is linked to the concept of urban restructuring, which posits that the built environment undergoes phases of fragmentation, densification, and redevelopment in response to changing economic and demographic needs [2]. According to land management, redevelopment impacts environmental sustainability, accessibility to services, and efficient spatial planning, whether through legal means or automated processes.
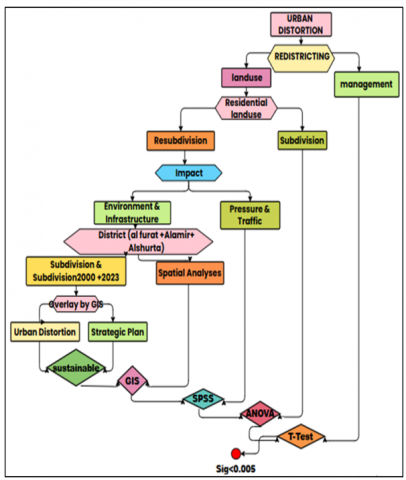
Therefore, the study fills a significant gap in the previous literature by focusing on the effects of uncontrolled redevelopment on the efficiency of urban sustainability and land use. Urban indicators, redevelopment rates, spatial analysis using GIS technology, and statistical analysis in the SPSS program were employed to identify urban distortions over a 23-year period from 2000 to 2023, focusing on three distinct areas in the city of Najaf (Figure 1).
Figure 1. Methodology framework
People would use residential land for their dwellings because it is designated as such. Residential land may accommodate both single-family and multi-family dwellings. Apartments and condos fall under this category. Properties classified for commercial, industrial, or agricultural use are quite different from residential properties, which are a type of subdivision [3].
Organization and planning will guarantee successful operation of this complicated undertaking. It covers a vast range of topics from public services to city planning. This manual will discuss residential land management basic theory while emphasizing the most useful tools of the trade [4]. The matters that must be seriously considered in residential land management:
Wide segments of Iraqis live in the most appalling housing conditions. This applies to all regions of Iraq. According to international laws and legislation, adequate housing is considered a human right. Although the right to adequate housing occupies a pivotal position in human rights, affirmed by the International Covenant on Civil and Political Rights (ICCPR) of 1948 and the First and Second International Covenants of 1966, ratified and acceded to by the Government of the Republic of Iraq, we continue to witness gross violations of this right, with a clear ambiguity surrounding it. The housing deficit in Iraq has reached approximately 2 million housing units, while only 10,000 housing units have been completed. This is according to data from the Iraqi Ministry of Planning's National Development Plan 2018-2022 [9]. However, all indicators indicate that the housing deficit is even greater due to high population growth rates. There is also the waste or loss of a significant proportion of urban land allocated for housing, which could be exploited to provide more residential land and reduce the imbalance between supply and demand. This leads to a widening gap between housing needs and housing stock (housing deficit). The resulting negative consequences are related to the high population density [10]. Among the means that can be used to save land and control population density are:
4.1 Subdivision
The term "land subdivision" lacks a legal definition, nor is it a technical term. Subdivision refers to the handling of land. The normal meaning of the term "land parcel subdivision" is that there is either a physical demarcation of the parcels on the land or at least a land plan showing the parcels as subdivided. Their area is determined by specifying a smaller area of land for construction [11]. The Scientific Encyclopedia defines residential subdivision linguistically as the division of a parcel of land into two or more sections for sale, development, or lease [12].
4.2 Re-subdivision
It is a legal and administrative process that involves dividing a single residential parcel into smaller parcels to allocate and distribute them to several individuals or entities. This process is typically carried out by the urban planning and building laws in effect in the area [13].
Sustainable planning aims to strike a balance between environmental conservation and economic growth. This can be achieved through the proper implementation of rezoning. However, this process has its drawbacks, including pressure on infrastructure if it is not modernized, and the loss of urban landscape and cultural identity in some neighbourhoods. It also supports social justice by offering diverse housing options for various segments of society. It supports sustainable mobility by facilitating access to destinations. It also enables the reorganization of built-up areas to halt uncontrolled urban growth [20].
8.1 Subdivision within residential areas (single dwellings)
One aspect of urban planning is the consideration of subdivision factors within residential areas, specifically single-family homes, to promote sustainable growth and enhance the quality of life for residents. Considerations such as these are among the many that may be made [21, 22]:
8.2 Division of properties covered by commercial use
Typically, these requirements include the following [23, 24]:
At the city level, urban distortion is manifested by the emergence of many deformities in the city's landscape. As a result of the rapid and almost cancerous change in their urban structures, cities have lost their traditional urban character. One of the most significant manifestations of urban disorder is the emergence of slums in the city centre, where various activities overlap without a governing system, resulting in the loss of the city's architectural and urban character. The phenomenon of urban deformities is not alien to our society. It has recently taken a dangerous turn, represented in several forms, including those changes caused by human hands, whether inside or outside the home. This phenomenon is no longer limited to old neighbourhoods alone, but has also extended to new neighbourhoods and residential complexes [25]. Roads and Buildings Law No. (44) of 1935 classified urban areas into six categories (first, second, third, fourth, excellent, and special). The area of a residential plot for these categories was determined, respectively, as follows: (100, 200, 300, 600, 800, 2000). These areas were established to prevent encroachment on residential plots and to maintain the integrity of the areas allocated to each category [10].
$Re-subdivision\text { rate }=\left(\frac{\text { Area before secretion }- \text { Area after secretion }}{\text { Area before secretion }}\right) \times 100$ (1)
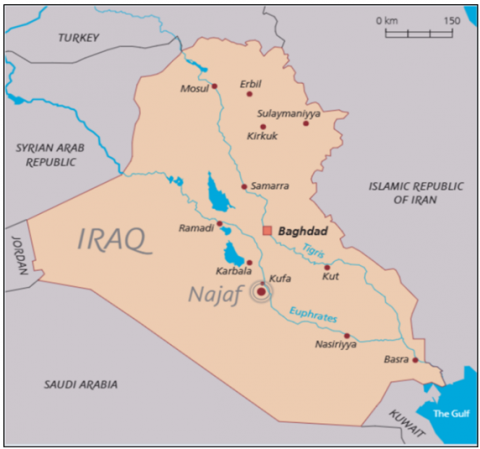
Figure 2. Location of the city of Najaf in relation to Iraq
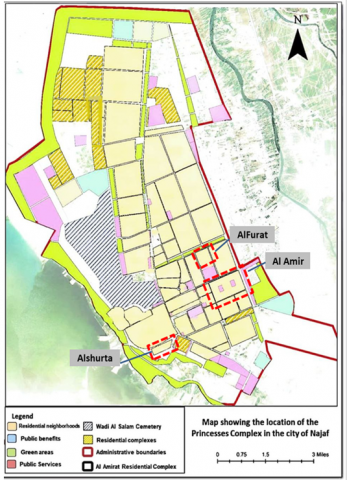
Figure 3. Location of the selected neighbourhoods in the city of Najaf
A. Al-Furat District
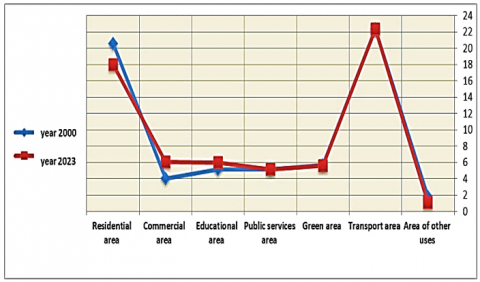
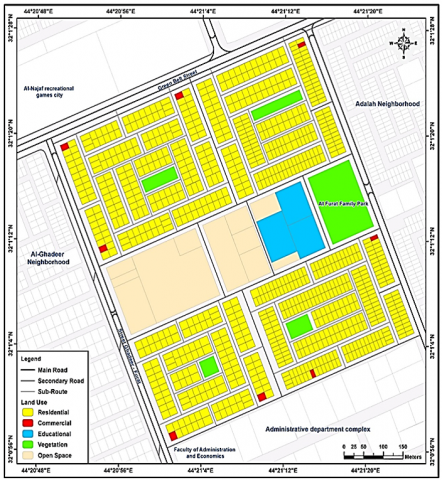
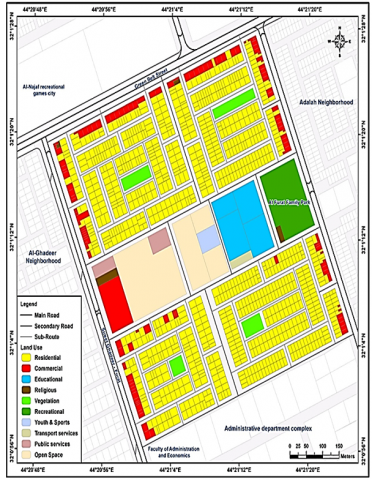
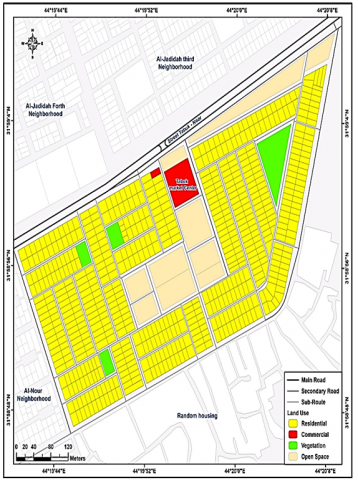
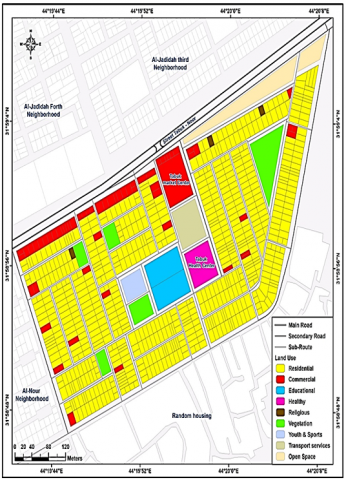
It is one of Najaf's more contemporary neighbourhoods. Incredible urbanization has occurred there over the last several decades (Figures 2 and 3). The district stands out due to its advantageous location, which is close to several key regions and important government and service organizations. The district is well thought-out, having a landscape with a variety of residential blocks, commercial areas, educational institutions, parks, and public amenities. This particular locality embodies the modern growth of Najaf. Najaf is a well-established city with transportation, health, education, and entertainment infrastructure that can sustain the demands of its citizens [26]. This particular sector, combining residential and service aspects, has seen much development lately after being the subject of many investment projects and commercial developments. Educational institutions here include the College of Administration and Economics, as well as entertainment areas such as Al-Furat Family Park. This comes together as a unified environment capable of meeting all community needs. Thanks to its well-planned neighbourhoods, modern infrastructure, and proximity to Najaf's main hubs, Al-Furat District has quickly developed into a prime attraction for buy-to-let owners. Comparing the 2000 map with the 2023 map and Table 1, therefore, indicates that business use has increased, especially along major roads. The area witnessed the development of more amenities in 2023, along with transit facilities for the events of a public or religious character. A change has also occurred in the apartment building re-sorting method. Figure 4 displays the sharply increased growth of green spaces and recreation places. Thus, it is estimated that the re-sorting rate in this area stood at about 29.63% for the period of 2000-2023, as shown in Figures 5 and 6.
Table 1. Land subdivision and re-subdivision in the years 2000 and 2023 for Al-Furat neighbourhood
|
District Name |
Variable |
Year 2000 |
Year 2023 |
|
Al-Furat |
Residential units |
620 |
1000 |
|
Total area |
64.85 |
64.85 |
|
|
Population (people) |
2940 |
5130 |
|
|
Residential area (h.) |
20.59 |
17.97 |
|
|
Commercial area (h.) |
3.99 |
6.08 |
|
|
Educational area |
5.16 |
6.02 |
|
|
Public services area |
5.17 |
5.17 |
|
|
Green area |
5.69 |
5.61 |
|
|
Transport area |
22.4 |
22.4 |
|
|
Area of other uses |
1.85 |
1.05 |
Figure 4. Between 2000 and 2023, Al-Furat neighbourhood subdivision and re-subdivision differed
Figure 5. Al-Furat neighbourhood plan in 2000
Figure 6. Al-Furat neighbourhood plan in 2023
B. Al-Amir District
It is commonly considered among the foremost neighbourhoods in Najaf. Due to its prime location and well-established urban infrastructure, it holds a place among the most important neighbourhoods in the city. The district is blessed with wide avenues and plenty of community facilities, a testimony to its meticulous urban design. In addition to a large number of shops selling every conceivable commodity or service, it is also home to many model educational and service institutions. Being centrally located, it draws citizens as much as it draws traders. Tremendous growth has taken place in this area in recent years. This modern community represents a marriage between all necessities of life and a serene residential environment. It also provides a healthy and nurturing atmosphere, together with numerous parks and open places that will give the residents room to unwind and enjoy life. This development has transformed the Al-Amir District into one of the city's most organized and prosperous neighbourhood's. It offers the perfect combination of comfort, integrated services, and proximity to the city's essential facilities, making it an ideal choice for anyone looking to live in the area.
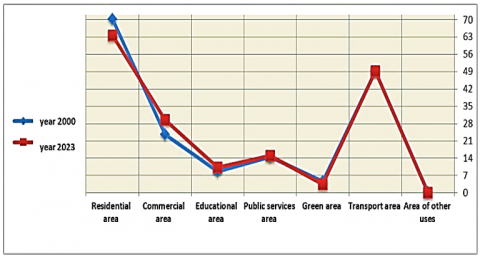
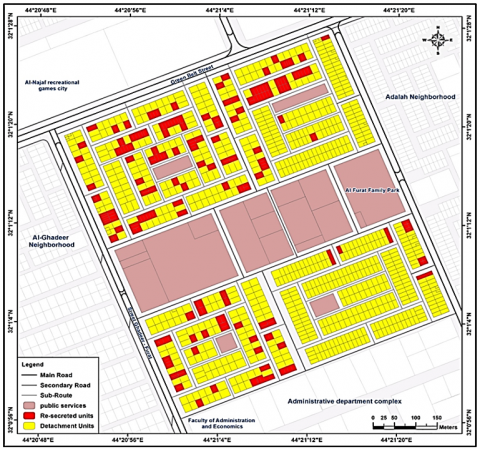
Commercial buildings on key highways have increased in quantity when comparing the designs from 2000 and 2023, as seen in Figure 7 and the accompanying Table 2. Additional service and educational facilities will also be included in the new concept. However, as the number of cities continues to rise, fewer open and green areas will remain. There has been a noticeable increase in residential construction and population density, possibly driven by growing demand for homes in the area. Accordingly, the re-subdivision rate in the area hit around 31.58% (Figures 8 and 9).
Table 2. Al-Amir neighbourhood land subdivision and re-subdivision between 2000 and 2023
|
District Name |
Variable |
Year 2000 |
Year 2023 |
|
Al-Amir |
Residential units |
2362 |
2580 |
|
Total area |
171.52 |
171.52 |
|
|
Population (people) |
16403 |
12550 |
|
|
Residential area (h.) |
70.28 |
63.7 |
|
|
Commercial area (h.) |
23.65 |
29.6 |
|
|
Educational area |
8.78 |
10.3 |
|
|
Public services area |
14.58 |
15.00 |
|
|
Green area |
4.66 |
3.5 |
|
|
Transport area |
49.27 |
49.3 |
|
|
Area of other uses |
0.30 |
0.12 |
Figure 7. Difference in subdivision and re-subdivision in Al-Amir neighborhood in 2000 and 2023
Figure 8. Al-Amir neighbourhood plan in 2000
Figure 9. Al-Amir neighbourhood plan in 2023
C. Al-Shurta District
One of Najaf's oldest neighbourhoods. Popularity and closeness to service hubs and the historic city define it. The district features several government and security institutions, as well as residential and commercial establishments, fostering an integrated environment for its citizens. The district has schools, health clinics, and marketplaces, making it a residential-service community. Roads, streets, and public facilities have been developed to meet the needs of residents. The district continues to grow and develop, becoming one of the modern neighbourhood's that reflect the city of Najaf's urban development.
Table 3. Land subdivision and resubdivision in Al-Shurta District in 2000 and 2023
|
District Name |
Variable |
Year 2000 |
Year 2023 |
|
Al-Shurta |
Residential units |
737 |
937 |
|
Total area |
41.97 |
41.97 |
|
|
Population (people) |
13143 |
10330 |
|
|
Residential area (h.) |
19.54 |
17.27 |
|
|
Commercial area (h.) |
2.52 |
3.97 |
|
|
Educational area |
0.74 |
0.9 |
|
|
Public services area |
1.2 |
1.4 |
|
|
Green area |
1.9 |
2.3 |
|
|
Transport area |
15.74 |
15.74 |
|
|
Area of other uses |
0.33 |
0.39 |
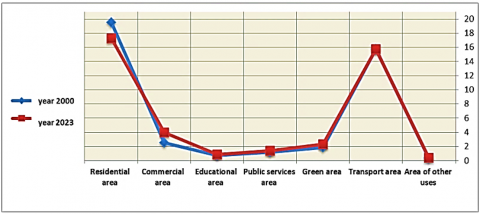
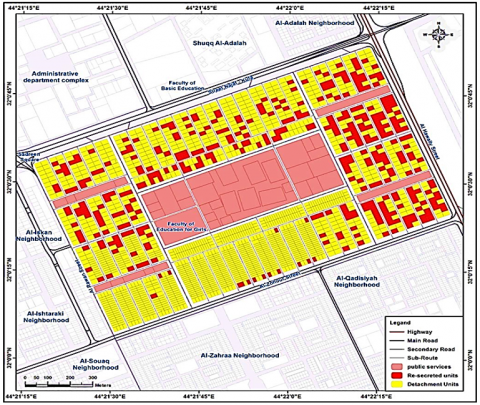
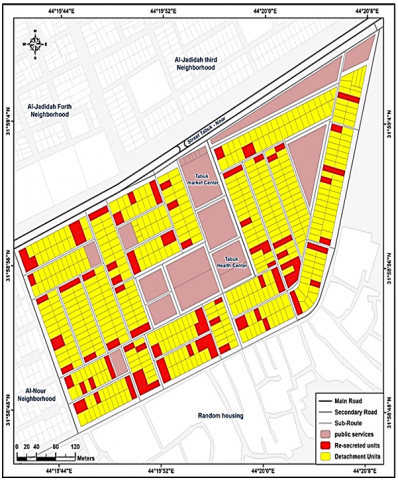
When comparing land re-subdivision between 2000 and 2023 in the Al-Shurta District, as shown in Table 3 and the two maps below, residential areas have witnessed a significant increase in density, indicating clear population growth. The number of spaces allocated for commercial activities has also increased, especially on the main road. Some small commercial areas have been developed into larger, more integrated commercial centers. New service facilities have been established, including health centers, schools, and government institutions. There has also been the emergence of areas designated for youth, sports, and entertainment services. Open spaces have been more systematically distributed than in the past, which has contributed to improved air quality and a local climate. Some older areas have undergone rehabilitation to enhance planning and create a more desirable residential environment. Therefore, the re-subdivision rate in Al-Shurta District is approximately 2.75% (Figures 10-12).
Figure 10. Difference in the subdivision and re-subdivision in Al-Shurta District between 2000 and 2023
Figure 11. Al-Shurta District Plan in 2000
Figure 12. Al-Shurta District Plan in 2023
After identifying the changes that occurred in the plans for the three residential neighbourhoods, including additions during the period (2000-2023), re-subdivision maps will be created for each neighbourhood. As shown, we will conduct a comparison based on these maps to identify similarities and differences between them, as shown in Table 4 and Figures 13-15.
Table 4. Comparison of land re-subdivision between the Euphrates, Amir, and Al-Shurta neighbourhoods
|
District Name |
Total Re-Subdivision Rate % |
Residential Re-Subdivision Rate % |
Analyzing Subdivision |
Similarities |
Differences |
|
Al-Furat |
29.63% |
12.72% |
Part of the residential spaces have been converted into public and commercial services, with an increase in the number of new subdivided plots. |
The three neighbourhoods experienced an increase in the redistribution of housing units. More services have been added, including commercial, educational, and health. |
Focus on diversifying land uses and including additional green and recreational areas. |
|
Al-Amir |
31.58% |
9.37% |
A decrease in residential space due to redevelopment and conversion to various services, while housing density and the number of units increase. |
|
There was an increase in population and residential density as a result of the resection. |
|
Al-Shurta |
2.75% |
11.61% |
Little change in residential areas, limited redevelopment focused on condensation and service improvements only. |
|
It is characterized by a stable secretion pattern and little change compared to other organisms. |
Figure13. Re-subdivision of Al-Furat neighbourhood
Figure 14. Re-subdivision of the Amir neighbourhood
Figure 15. Re-subdivision of the Al-Shurta neighbourhood
There is a significant difference between the neighbourhoods in most uses in Tables 6-8, especially: residential, commercial, educational, transportation areas and the number of housing units. This is clear evidence of the urban distortion that occurred through the re-division of the three neighbourhoods, which were based on different densities, and that the distortion affected all types of densities. This highlights the need for expansion and meeting housing demand, particularly by providing public sector-supported housing complexes at prices that all segments of society can afford, as shown in Figures 16-18.
Figure 16. T-test results in years 2000 and 2023
Figure 17. ANOVA test results in the year 2000
Table 5. Differences and the ratio of change results in years 2000 and 2023
|
District Name |
Variable |
2000 |
2023 |
Different |
Ratio of Change |
|
Al-Furat |
Residential units |
620 |
1000 |
+380 |
+61.3 |
|
Residential area (h.) |
20.59 |
17.97 |
-2.62 |
-12.7 |
|
|
Commercial area (h.) |
3.99 |
6.08 |
+2.09 |
+52.4 |
|
|
Educational area |
5.16 |
6.02 |
+0.86 |
+16.7 |
|
|
Public services area |
5.17 |
5.17 |
0 |
0 |
|
|
Green area |
5.69 |
5.61 |
-0.08 |
-1.4 |
|
|
Transport area |
22.40 |
22.40 |
0 |
0 |
|
|
Area of other uses |
1.85 |
1.05 |
-0.8 |
-43.2 |
|
|
Al-Amir |
Residential units |
2362 |
2580 |
+218 |
+9.2 |
|
Residential area (h.) |
70.28 |
63.7 |
-6.58 |
-9.4 |
|
|
Commercial area (h.) |
23.65 |
29.6 |
+5.95 |
+25.2 |
|
|
Educational area |
8.78 |
10.3 |
+1.52 |
+17.3 |
|
|
Public services area |
14.58 |
15.00 |
+0.42 |
+2.9 |
|
|
Green area |
4.66 |
3.5 |
-1.16 |
-24.9 |
|
|
Transport area |
49.27 |
49.3 |
+0.03 |
+0.06 |
|
|
Area of other uses |
0.30 |
0.12 |
-0.18 |
-60 |
|
|
Al-Shurta |
Residential units |
737 |
937 |
+200 |
+27.1 |
|
Residential area (h.) |
19.54 |
17.27 |
-2.27 |
-11.6 |
|
|
Commercial area (h.) |
2.52 |
3.97 |
+1.45 |
+57.5 |
|
|
Educational area |
0.74 |
0.9 |
+0.16 |
+21.6 |
|
|
Public services area |
1.2 |
1.4 |
+0.2 |
+16.7 |
|
|
Green area |
1.9 |
2.3 |
+0.4 |
+21.1 |
|
|
Transport area |
15.74 |
15.74 |
0 |
0 |
|
|
Area of other uses |
0.33 |
0.39 |
+0.06 |
+18.2 |
Table 6. T-test results in years 2000 and 2023
|
Variables |
Average 2000 |
Average 2023 |
T |
Sig(2-tailed) |
Description |
|
Residential units |
1239.7 |
1505.7 |
-14.66 |
0.005 |
yes |
|
Residential area (h.) |
36.8 |
32.98 |
8.280 |
0.014 |
yes |
|
Commercial area (h.) |
10.05 |
13.22 |
-9.201 |
0.012 |
yes |
|
Educational area |
4.89 |
5.74 |
-777.261 |
0.018 |
yes |
|
Public services area |
6.98 |
7.19 |
-3.674 |
0.067 |
no |
|
Green area |
4.08 |
3.80 |
0.306 |
0.781 |
no |
|
Transport area |
29.14 |
29.15 |
-0.017 |
0.987 |
no |
|
Area of other uses |
0.83 |
0.52 |
2.563 |
0.123 |
no |
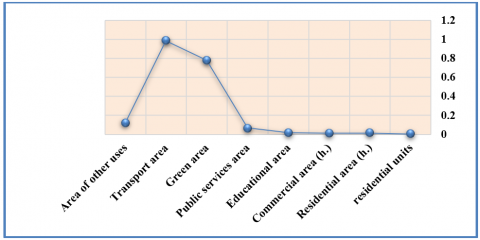
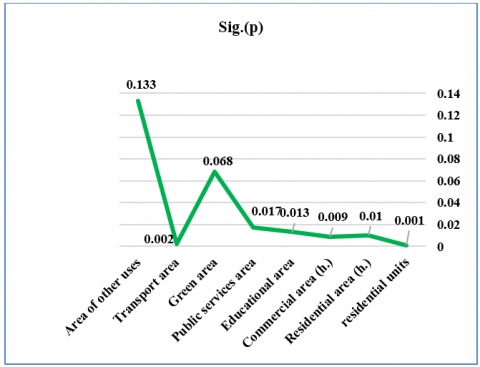
Table 7. ANOVA test results in year 2000
|
Variable |
F -Value |
Sig.(p) |
Description |
|
Residential units |
1702.3 |
0.001 |
Yes |
|
Residential area (h.) |
105.9 |
0.009 |
Yes |
|
Commercial area (h.) |
112.4 |
0.008 |
Yes |
|
Educational area |
84.2 |
0.012 |
Yes |
|
Public services area |
63.3 |
0.016 |
yes |
|
Green area |
17.0 |
0.056 |
No |
|
Transport area |
577.6 |
0.002 |
Yes |
|
Area of other uses |
8.6 |
0.104 |
no |
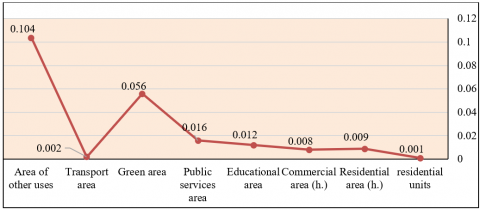
Table 8. ANOVA test results for the year 2023
|
Variable |
F -Value |
Sig.(p) |
Description |
|
Residential units |
1573 |
0.001 |
Yes |
|
Residential area (h.) |
98.6 |
0.010 |
Yes |
|
Commercial area (h.) |
107.2 |
0.009 |
Yes |
|
Educational area |
75.3 |
0.013 |
Yes |
|
Public services area |
59.8 |
0.017 |
yes |
|
Green area |
13.4 |
0.068 |
No |
|
Transport area |
574.2 |
0.002 |
Yes |
|
Area of other uses |
5.3 |
0.133 |
no |
Figure 18. ANOVA test results in the year 2023
12.1 Short-term strategies (one to three years)
The two objectives are to halt the impending urban decline of cities and to improve the management of rezoning in existing areas.
12.2 Medium-term strategies (four to seven years)
Objective: Developing the concept of organized residential complexes.
• Optimal utilization of space.
• Providing a residential environment with integrated services at the neighbourhood level.
• Reducing visual distortions resulting from random re-subdivision.
• Developing urban programs to restore public spaces, buildings, and streets affected by random re-subdivision.
• Implementing urban design standards that ensure the visual cohesion of the urban fabric and take into account the architectural character of the area.
• Subjecting each re-subdivision process to local development plans and urban density requirements.
• Linking permits to expansion rates, the availability of infrastructure, and vital facilities.
12.3 Long-term plans (eight to fifteen years)
The goal is to ensure sustainable urban expansion while striking a balance between environmental protection and development.
This research presents a comparative model that combines an analysis of urban indicators for rezoning, land use change, and demographic and spatial transformations for specific years, utilizing GIS maps and statistical analysis. The results of this study provide a measurable tool for urban planners to assess the impact of unplanned redevelopment in rapidly developing areas, particularly since such studies are limited in the Middle East.
[1] Al-Sa'ady, J.B., Abbas, S.S., Abd-Al-Razak, H.A. (2009). The policy of residential plots secretion and its results Dr. Jamal Baker Al-Sa'ady case study (Baghdad City). Iraqi Journal of Architecture and Planning, 2(3): 87-143. https://doi.org/10.36041/iqjap.v2i3.391
[2] Land Century. (2018). Residential land - what is it and how to use it. https://www.landcentury.com/articles-news/residential-land-what-is-it-and-how-to-use-it.
[3] Bedewy, B.A.H., Alwan K.H., Fleeh M.K. (2021). Dynamic urban modelling for urban growth varieties and transport: Building a complex dynamic model. IOP Conference Series: Earth and Environmental Science, 754(1): 012007. https://doi.org/10.1088/1755-1315/754/1/012007
[4] Berke, P.R., Godschalk, D.R., Kaiser, E.J., Rodríguez, D.A. (2006). Urban Land Use Planning 2006. University of Illinois Press.
[5] Cartone, A., Díaz-Dapena, A., Langarita, R., Rubiera-Morollón, F. (2021). Where the city lights shine? Measuring the effect of sprawl on electricity consumption in Spain. Land Use Policy, 105: 105425. https://doi.org/10.1016/j.landusepol.2021.105425
[6] Algburi, D., Albaghdadi, A.S., Basrawi, M., Al-Salim, K. (2023). Healthy cities and the planning treatments used to confront epidemics/international experiences. AIP Conference Proceedings, 2776: 070006. https://doi.org/10.1063/5.0136013
[7] The Republic of Iraq. (2022). The Ministry of Planning, National Development Plan 2018-2022. Central Statistical Agency Printing Press. https://www.iraq-jccme.jp/pdf/archives/nationaldevelopmentplan2018_2022.pdf.
[8] Abdulhadi, M.A., Sadeq, M.A., Turki, A.Q. (2025). Cost-effective configuration of hybrid solar-wind energy systems using grey wolf optimization for specified power requirements. Journal Européen des Systèmes Automatisés, 58(3): 623-631. https://doi.org/10.18280/jesa.580318
[9] Shang, S., Du, S., Du, S., Zhu, S. (2021). Estimating building-scale population using multi-source spatial data. Cities, 111: 103002. https://doi.org/10.1016/j.cities.2020.103002
[10] Bedewy, B.A.H., Alwan K.H., Fleeh M.K. (2019). Urban transport and growth: Dynamic indicators in Diwaniyah city. IOP Conference Series: Materials Science and Engineering, 518(2): 022087. https://doi.org/10.1088/1757-899X/518/2/022087
[11] Chen, T., Luh, D., Hu, L., Shan, Q. (2023). Exploring factors affecting residential satisfaction in old neighborhoods and sustainable design strategies based on post-occupancy evaluation. Sustainability, 15(21): 15213. https://doi.org/10.3390/su152115213
[12] Kresse, K., Krabben, E.V.D. (2021). Housing supply limitations, land readjustment and the ecological performance of the urban landscape. Sustainability, 13(17): 9774. https://doi.org/10.3390/su13179774
[13] Abbas, S.S., Mohammed, F.G. (2018). The effect of residential re-subdivision analytic study for Palestine street from 2006-2010. Iraqi Journal of Architecture & Planning, 10(22-23-24): 11-26.
[14] Vargas-Hernández, J.G. (2020). Urban planning, policymaking and scenarios of land uses' design. Labor e Engenho, 14: e020002. https://doi.org/10.20396/labore.v14i0.8659271
[15] Bedewy, B.A.H., Algburi, D., Abdulameer, M.H., Al-Baghdadi, A.S.N. (2024). Safe path: Energy harvesting from pedestrian movement in Karbala- spatial suitability and crowd dynamics towards sustainability. International Journal of Safety and Security Engineering, 14(3): 985-997. https://doi.org/10.18280/ijsse.140328
[16] Habiyaremye, J.P. (2023). Land reallocation for an upgraded urban development plan in Rwanda: A case study of planning for upgrading Kabuye phase II site/Gasabo district, Kigali city. COGNITIONIS Scientific Journal, 6(2): 400-414. https://doi.org/10.38087/2595.8801.203
[17] He, Q. (2023). Urban planning and sustainable land use. Sustainability, 15(12): 9524. https://doi.org/10.3390/su15129524
[18] Home, R. (2007). Land readjustment as a method of development land assembly: A comparative overview. Town Planning Review, 78(4): 459-483. https://doi.org/10.3828/tpr.78.4.4
[19] Bedewy, B.A.H., Abdulameer, M.H. (2023). Evaluating and improving the spatial distribution using GIS to avoid environmental risks and achieve safety for petrol stations in the Nile District Center in Mahaweel / Iraq. International Journal of Safety and Security Engineering, 13(3): 433-444. https://doi.org/10.18280/ijsse.130306
[20] Waas, T., Hugé, J., Block, T., Wright, T., Benitez-Capistros, F., Verbruggen, A. (2014). Sustainability assessment and indicators: Tools in a decision-making strategy for sustainable development. Sustainability, 6(9): 5512-5534. https://doi.org/10.3390/su6095512
[21] Gao, H., Bakar, S.A., Maulan, S., Yusof, M.J.M., Mundher, R., Guo, Y., Chen, B. (2024). A systematic literature review and analysis of visual pollution. Land, 13(7): 994. https://doi.org/10.3390/land13070994
[22] Hadi, D.W., Alwan, K.H. (2021). The percentage of humanization in the main walkway of the old city of Najaf, using GIS technique. IOP Conference Series: Materials Science and Engineering, 1105(1): 012093. https://doi.org/10.1088/1757-899x/1105/1/012093
[23] Tabbaa, Y., Mervi, S., Bonnier, E. (2014). Najaf, the Gate of Wisdom. History, Heritage and Significance of the Holy City of the Shi‘a. https://shs.hal.science/halshs-01865738.
[24] Al-Timimy, S.R.A., Bedewy, B.A.H. (2023). Enhancing urban sustainability by integrating MCDM and model of GIS spatial analysis in Al-Nasiriyah Heritage Center Development. International Journal of Sustainable Development and Planning, 18(11): 3429-3438. https://doi.org/10.18280/ijsdp.181108
[25] Hassan Alwan, K., Waheed Hadi, D. (2021). Measuring pedestrian quality standards: A case study of Al-Khourng walkway and Al-Rawan Street. IOP Conference Series: Earth and Environmental Science, 754(1): 012024. https://doi.org/10.1088/1755-1315/754/1/012024
[26] Bedewy, B.A., Abdul-Ameer, H.N., Al-Timimy, S.R., Abdulameer, M.H. (2023). Processing traffic jam in Al-Sadrain intersection in the holy city of Najaf. In E3S Web of Conferences, 427: 03021. https://doi.org/10.1051/e3sconf/202342703021