Mustafa E. Al-Fatlawi*![]() | Sara M. Al-Jawari
| Sara M. Al-Jawari![]()
© 2025 The authors. This article is published by IIETA and is licensed under the CC BY 4.0 license (http://creativecommons.org/licenses/by/4.0/).
OPEN ACCESS
Happy Cities aims to enhance sustainable well-being by creating a sustainable, balanced urban setting. This research seeks to examine the influence of sustainable environmental indicators on the happiness of locals. The Al-Amir neighborhood of the city of Najaf was chosen as a case study due to its high population density, rapid urban expansion, and status as one of Najaf's most significant urban communities. Additionally, there are obvious environmental imbalances that affect people's comfort, pleasure, and satisfaction both directly and indirectly. The research demonstrates its importance through an in-depth analysis of the role of five key sustainable environmental indicators—air quality, green spaces, noise, thermal comfort, and waste management—on residents' happiness. Based on a field analytical technique, the study evaluated the relationship between sustainable environmental indicators and population satisfaction utilizing a population survey, field measurement devices, and Pearson correlation coefficient analysis (P). According to the findings, noise and air quality are the next most important sustainable environmental factors that affect population satisfaction, followed by green spaces and thermal comfort levels, while the impact of waste management was comparatively small. Copenhagen was examined as a cutting-edge worldwide model that has successfully incorporated sustainable environmental indicators into urban design, hence enhancing quality of life, to demonstrate the effect of environmental planning on raising population happiness. The research recommends adopting the Copenhagen experience to develop and improve the environment in Al-Amir neighborhood, particularly by increasing green spaces, improving thermal comfort and ventilation, reducing noise sources, and developing waste management, which contributes to achieving a comfortable, sustainable, and happier urban environment.
urban happiness, sustainability, environmental indicators, air quality, noise, green spaces, thermal comfort, waste management, Al-Ameer neighborhood
According to Montgomery [1], "happy cities" aim to improve the well-being of their citizens by creating a sustainable, pleasurable, safe, and healthy urban environment that can promote social interaction and increase their resilience to environmental and economic challenges. The research raises the question:
Do sustainable environmental indicators (air quality, noise, thermal comfort, green spaces, waste management) play a role in population happiness?
Happy cities, according to Montgomery [1], are not just places to live; rather, they are an urban project that aims to distribute resources fairly, maximize feelings of joy and decrease suffering, and fortify social ties, all of which give urban life more depth and significance [1]. Therefore, the research assumes that the impact of air quality, noise, thermal comfort, green spaces, and waste management plays an important role in the happiness of residents. Pearson's coefficient is supposed to analyze the type of relationship between the environmental index and urban happiness. Improving the urban environment through the provision of a healthy atmosphere, fair opportunity distribution, and extremely effective urban administration is essential to achieving urban happiness.
Furthermore, enhancing social interaction among residents, happy cities have a set of elements, such as well-being, health, social justice, and the availability of public spaces, all of which can contribute to achieving satisfaction and happiness for residents [2]. Along with lowering social and economic divides, this idea guarantees the development of an integrated living environment that can offer first-rate healthcare and educational services, as well as green areas and recreational amenities. This helps to improve inhabitants' general well-being and degree of enjoyment [3]. Smart and sustainable urban design that prioritizes social infrastructure, especially in the areas of healthcare and education, and psychological well-being, as well as a sense of security, are also essential components of happy cities. Building a more secure and cohesive metropolitan society requires positive social ties [4]. A happy city is characterized by the integration of its elements in terms of planning and transportation, the availability of green spaces, energy, and sanitation infrastructure, as well as lighting and traffic management systems, with an emphasis on environmental, economic, and social sustainability [5].
Environmental indicators are straightforward quantitative instruments designed to track changes in the environment over time in order to offer precise and trustworthy information about the condition of the environment or human health. They are crucial for combining various data into a quantifiable approach, which makes it easier to analyze and comprehend environmental phenomena in various settings [6]. The importance of these indicators arises from their being systematic metrics used to assess environmental quality and establish environmental policies in line with accomplishing strategic objectives. They serve as a useful scientific resource for decision-makers assessing the environmental effectiveness of policies and programs since they are also used to monitor and track significant environmental factors like biodiversity, soil degradation, and air quality [7, 8]. One of the most important characteristics of environmental indicators are based on clear quantitative rules and foundations. They are also classified into well-established analytical models, the most prominent of which is the "Driver-Pressure-State-Impact-Response" (DPSIR) model, which can contribute to understanding the causal relationships between human activities and environmental changes and promote the development of coherent indicators with clear meanings. Environmental indicators are a key tool for evaluating environmental sustainability within an integrated scientific framework because they help answer basic questions about the quality of the ecosystem and the timescale required to maintain or improve it. Effective environmental indicators are those that have clear value and content, the capacity to influence others, a close relationship to policies, and appropriateness and feasibility in terms of time and space. The relationship between environmental indicators and human health is embodied in their ability to measure environmental factors that affect public health, such as noise, air quality, and the availability of green spaces. These factors proved to be closely linked to levels of psychological and physical well-being. These indicators are also used to identify health risks and support environmental planning aimed at providing a healthier and safer living environment [9, 10].
2.1 The impact of sustainable environmental indicators on urban happiness
One of the main factors influencing the happiness of urban residents is sustainable environmental indicators. Research indicates that environmental factors including noise levels, green areas, air quality, and thermal comfort affect people's mental and physical health as well as their degree of life satisfaction both directly and indirectly. In addition to being aesthetically beautiful, green areas like parks and trees also improve mental health by lowering tension and anxiety levels, which promotes happiness, overall well-being, and sustainability [11]. Contrarily, noise is a detrimental element that raises tension and anxiety levels and lowers happiness [12]. However, human beings are significantly impacted by environmental contamination and air quality. Pollutants from traffic and industry endanger human health and safety, raise anxiety and depressive symptoms, and lower general life satisfaction. Thermal comfort brought on by mild weather, particularly in the presence of nature, promotes emotions of peace and happiness and creates supportive and pleasurable outdoor environments [13]. These results are in line with earlier research that demonstrated that well-thought-out urban planning, which is defined by a moderate population density, a variety of land uses, and convenient access to services, helps to encourage physical activity and lessen reliance on automobiles, both of which improve public health. Furthermore, the availability of nearby natural areas and emotional belonging to the environment lead to reduced rates of depression and improved relaxation, creativity, and health outcomes, especially among women [14, 15].
2.2 The most important sustainable environmental indicators
Sustainable environmental indicators have a direct impact on residents' happiness and life satisfaction, making their analysis essential for developing policies that improve quality of life and general happiness. Here are a few environmental indicators that show how the environment affects the happiness of the locals.
AIR QUALITY: People's mental and physical health are impacted by air pollution levels, which obviously affects their degree of life satisfaction [16]. Using a Hi-Volume Air Sampler, suspended particulate matter (PM2.5–PM10) and carbon monoxide (CO) concentrations were used to measure the quality of the air. The concentration was then converted to the Air Quality Index (AQI) using an equation:
low $\mathrm{I}+($ low $\mathrm{C}-\mathrm{C}) \times \frac{(\text { low } \mathrm{I} \text { high }-\mathrm{I})}{(\text { low } \mathrm{C} \text { high }-\mathrm{C})}=\mathrm{I}$ (1)
where, C stands for the pollutant concentration, lowC is high for the concentration limits that C falls within, and I is low and I high for the corresponding values on the AQI scale.
GREEN SPACES: In addition to their environmental advantages, areas with gardens and parks are essential parts of urban design because they enhance the quality of life and promote both physical and mental health. In addition to improving social relationships and a feeling of inclusion in the community, they also help to make cities more aesthetically pleasing [17]. Measured with a GIS application.
NOISE: Unacceptable noise, particularly that produced by human activities like traffic or airplanes, is a form of environmental pollution. People's health can be negatively impacted by loud noises, which can exacerbate a number of health issues by raising stress levels, disrupting sleep, and raising blood pressure [18]. Measured using a sound intensity meter in decibels.
WASTE: Materials that are often created by human activities like manufacturing and consumption but have no value or purpose. Waste may take many different forms, including liquid waste like sewage, solid garbage like domestic trash and plastic containers, and hazardous waste with poisonous materials. Pollution reduction and environmental protection are two of waste management's most significant advantages. Reducing the environmental effect of garbage is the goal of policies like waste recycling and waste-to-energy conversion [19]. Measurements were taken in the field.
THERMAL COMFORT: The state of a person's comfort, free from excessive heat and cold. This condition depends on several physical parameters such as humidity, temperature, air speed, and air pressure. These parameters define the so-called thermal neutral zone, the area in which the human body can maintain a stable internal temperature without losing or gaining heat [20]. Measured using ENVI-met simulations.
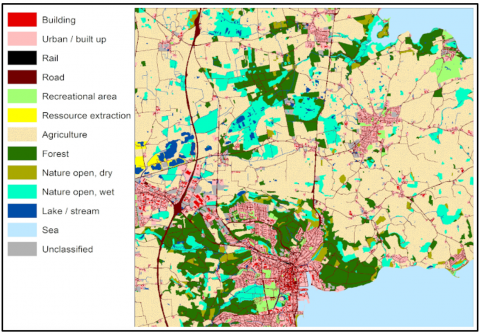
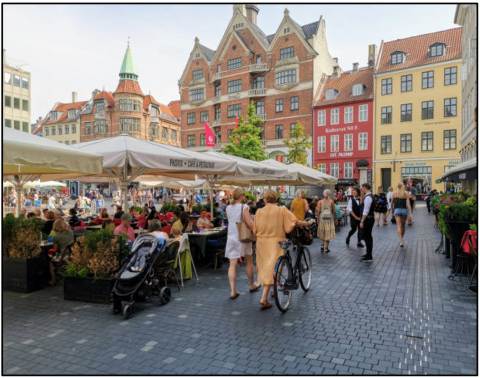
The Copenhagen experience is an advanced example of the use of environmental indicators in achieving the happiness of the population, where the quality of clean air is reflected by the high dependence on sustainable transport, such as bicycles, which account for about 49% of daily trips, also contributes in reducing harmful emissions and enhancing public health [21]. It also seeks justice in accessing green spaces up to a maximum of 300 meters from each house and improving psychological and social well-being, as confirmed by studies that there is a close relationship between proximity to green areas and achieving mental health and environmental justice [22]. In order to lessen the influence on the environment and enhance the circular economy, waste management is managed using smart technologies built on subterranean pipeline networks and information processing methods that evaluate environmental data. Reducing reliance on private vehicles, increasing electrified public transportation, and encouraging bicycle usage have all helped to improve air quality and lessen the impact of noise pollution. Regarding thermal comfort, the Skt project and other creative natural solutions were used. Kjelds Plads, who improved quality of life and adapted to climate change by using vegetation technology and urban cooling [23]. The interdependence of the components of the urban environment in the city of Copenhagen has a direct impact on the physical and psychological health of residents and makes it an effective model for cities that seek to promote happiness for their residents by improving the urban environment. As shown in Figure 1, despite the clear difference in practical and technical capabilities between the city of Copenhagen and the study area, they share the goal that interest in the concepts of sustainable environmental indicators as determinants of improving life and human well-being, and this provides a starting point for adopting long-term sustainable environmental planning [24].
(a) Urban land use map of Copenhagen City
(b) Social practices in the urban environment of Copenhagen City
Figure 1. Urban environment of Copenhagen City
The environmental dimension is one of the basic pillars of building urban happiness in Copenhagen, as environmental policies focus on achieving a healthy and balanced environment that supports the happiness and well-being of residents.
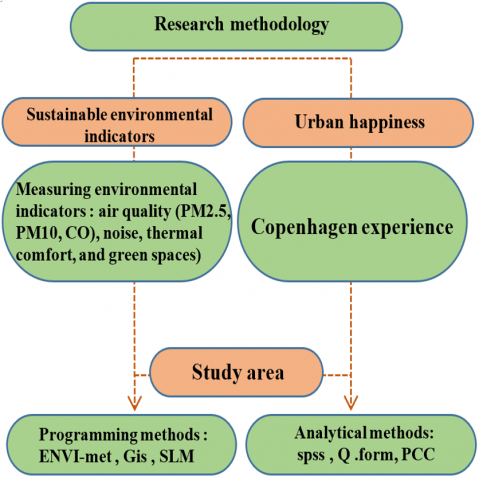
Figure 2. Research methodology (researcher)
As illustrated in the methodology diagram (Figure 2), the study integrates quantitative environmental simulation tools (ENVI-met, GIS) with survey-based assessments (SPSS, Q-form). The sampling technique employed was stratified random sampling, ensuring representation across various morphological and land-use typologies in the Al-Amir neighborhood. The questionnaire design was informed by internationally validated instruments for measuring environmental satisfaction and subjective well-being, particularly drawing from the World Happiness Report (2023). Measurement locations were carefully selected based on urban form variations—such as compact built-up zones, open plots, and shaded or vegetated areas—to capture a range of environmental conditions influencing human thermal perception and comfort.
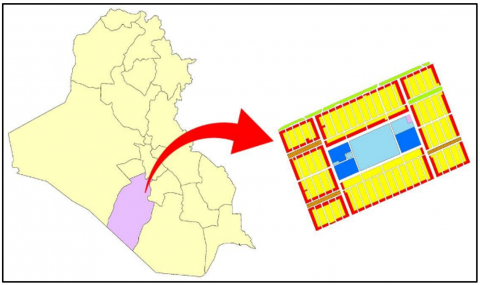
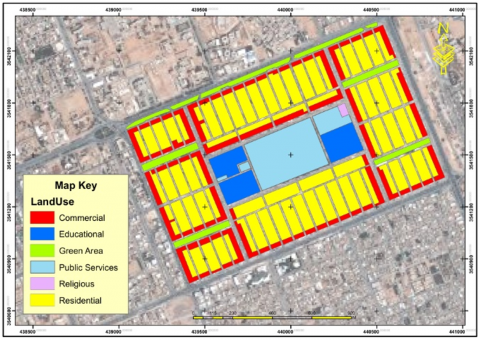
The study area is located in the Amir neighborhood, which is located in the province of Najaf in southwestern Iraq. As shown in Figure 3. It is one of the prominent neighborhoods in the city of Najaf and extends over an area of 153,118 hectares. It has 2,036 residential units and a population of 18,461 people, see Figures 4 and 5. Despite the increasing urban development in the neighborhood, it faces a set of environmental challenges that can affect the comfort of the population, including high noise levels, declining air quality, lack of green spaces, poor waste management and poor thermal adaptation.
Figure 3. Location of Al-Amir neighborhood on Iraq map
Figure 4. Al Ameer neighborhood land use map by the researcher according to Najaf municipality
Figure 5. Existing land use map of Al Ameer Neighborhood by the researcher using ARC GIS
5.1 Analysis of sustainable environmental indicators in Al-Amir neighborhood
A. Air quality:
Air pollution is one of the most prominent environmental problems that affects human health and urban life. The table shows the measurement of pollutants in Al-Amir neighborhood with results ranging from good to medium and bad based on the Air Quality Index (AQI). Advanced measuring devices were relied upon to measure the concentrations of suspended particles (PM10, PM2.5) and carbon monoxide (CO) concentration and compare the results with the determinants issued by the World Health Organization (WHO) [25]. The following Table 1 presents the results for measuring air pollutants in Al-Amir neighborhood:
On 14/2/2025, the recorded data for air quality in the region showed an increase in the concentration of PM2.5 and exceeding the international standard, which led to raising the air quality level 77 = (AQI) and concentrations of PM10, CO They remained below international standards, indicating that (PM2.5) is the main reason for the deterioration of the air quality index. These data indicate the need for the Amir neighborhood to monitor continuously and develop an effective strategy to manage emission sources, especially those resulting from traffic.
Table 1. Measuring air pollutants and air quality in Al-Amir neighborhood in Najaf Al-Ashraf
|
Contaminant |
Concentration |
AQI |
Description |
Universal Selector (WHO) |
Device Used |
|
(PM2.5) Fine Particles |
24 µg/m³ |
77 |
Moderate – Bad |
(15 µg/m³) 24 hours |
Hi-Volume Air Sampler |
|
(PM10) Larger Particles |
68 µg/m³ |
65 |
Good |
(45 µg/m³) 24 hours |
Hi-Volume Air Sampler |
|
(CO) carbon monoxide |
1.4 mg/m³ (1400 µg/m³) |
35 |
Good |
(10 mg/m³) 8 hours |
NDIR Infrared Analyzer |
Resource: The author's
B. Noise:
The al-Amir neighborhood is one of the densely populated residential areas in the city of Al-Najaf Al-Ashraf and has a clear traffic activity as a result of its presence on major road axes and service centers. Numerous sources of noise pollution have appeared in the area, such as:
•As a result of the neighborhood's location near Najaf Airport, residents in the neighborhood are exposed to noise from the movement of aircraft during takeoff and landing.
•Traffic for cars, large vehicles, and private cars at peak time.
•There are a number of shops and craft workshops in the residential units.
•Scarcity of vegetation and acoustic insulators which have a role in reducing noise transmission [26].
Noise levels were measured by the sound intensity device (dB) at multiple points in the neighborhood and at different periods (morning, noon, evening) and the results appeared according to Table 2.
Table 2. Measuring noise levels in different places in the Amir neighborhood during different periods
|
Location |
Morning Period H |
Afternoon |
Evening Period |
|
Inside the residential area |
63 dB |
68 dB |
66 dB |
|
Near Commercial Street |
75 dB |
81 dB |
77 dB |
|
Public parks |
67 dB |
69 dB |
64 dB |
|
In proximity to mechanic workshops |
79 dB |
83 dB |
78 dB |
|
During the passage of aircraft (near the flight path) |
95 dB |
97 dB |
92 dB |
Resource: The author's
These results show that some places within the neighborhood, especially those close to commercial and industrial activities, are above the globally recommended level of noise within residential areas, which ranges between 55-65 dB according to the limits of the World Health Organization (WHO), which may negatively affect the psychological well-being of the population.
C. Green spaces:
Green areas are considered one of the environmental indicators that contribute to enhancing the standard of living within cities and their role in raising air quality and providing a space for the comfort of residents [27]. Table 3 shows the impact of green spaces in Al-Amir neighborhood [28].
Table 3. The reality of the green spaces of Al-Amir neighborhood in the city of Najaf
|
Elements |
Value (Qatari Riyal) |
|
Population |
18,461 inhabitants |
|
The total area of the neighborhood |
1,707,933 m² |
|
Green spaces |
171,585 m² |
|
Green spaces |
30,380 m² |
|
Unimplemented areas of the plan |
141,205 m² |
|
Execution Percentage of the Plan |
17.7% |
|
The required area according to the standard of 9 m²/person |
166,149 m² |
|
Global Standard Verification Percentage |
18.3% |
|
Actual Green Space Per Capita |
1.6 m²/person |
Resource: The author's
Based on past data, there is a large gap between the planner vs implementer in green area where only 17.7% of the planned area is completed and the implemented per capita (1.6 m²) is low compared to the World Health Organization (WHO) global standard of 9 m² for the individual; This shortcoming should be an emergency planning tool to invest in areas that have not been implemented and for environmental balance in the Amir neighborhood.
D. Thermal comfort:
Thermal comfort is one of the most important sustainable environmental indicators that indicate the extent of comfort in the urban environment and is affected by many elements, including wind speed, temperature, relative humidity and the nature of surface coverage [29]. The outputs of the simulation of the ENVI-met program and it was shown that the prince’s neighborhood suffers from a clear variation in the degrees of thermal comfort.
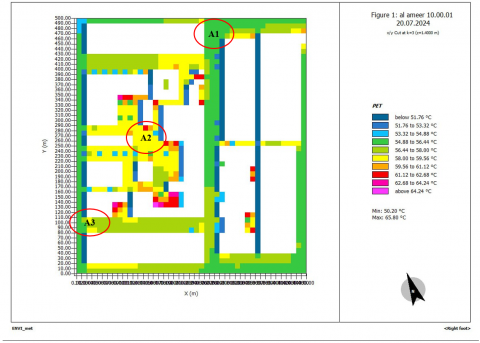
According to the PET index map, large areas of the Amir neighborhood fall within PET levels ranging from 51.56℃ to 54.8℃, which are within the thermally uncomfortable temperatures, as shown in Figure 6. According to ASHRAE standards, the comfortable range is between (26℃–32℃) [30].
Figure 6. PET index distribution map in urban environment (researcher)
Three different points were selected to illustrate the variation in the thermal comfort index (PET) in the Al Ameer district. Point A1 indicates a temperature range of 51.44℃ – 52.00℃, which represents heat stress, and is associated with the absence of partial shade, which may contribute to reducing the intensity of the heat. Point A2 falls within the range of (52.00℃ –53.68℃). This indicates high levels of heat stress, resulting from the lack of green cover and high surface heat absorption. Meanwhile, Point A3 falls within the range of (53.88℃ - 54.44℃), which is a high level of heat stress.
The elevated values of the Physiological Equivalent Temperature (PET) index significantly undermine residents’ happiness by indicating a notable decline in thermal comfort within the urban environment. Prolonged exposure to heat stress impairs outdoor mobility, limits opportunities for social interaction, and increases physiological and psychological burdens. Such thermal discomfort leads to reduced use of public open spaces and negatively influences perceived environmental quality, ultimately diminishing subjective well-being and urban happiness.
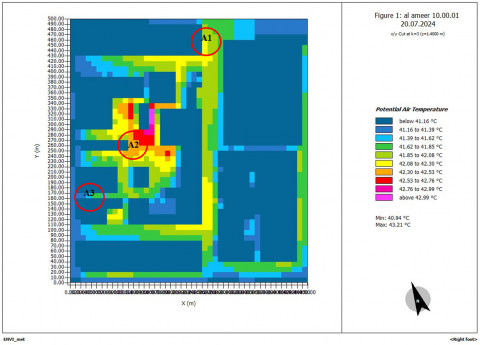
The Air Temperature: As shown in Figure 7, Air temperature indicates a clear escalation of heat in the central and southern parts of the Al-Amir neighborhood, where temperatures reached up to 43℃. This level significantly exceeds the internationally recognized thermal comfort range, which typically falls between 20℃ and 27℃ for outdoor environments [30], thereby contributing to substantial thermal stress and a marked decline in residents’ comfort levels.
Figure 7. Air temperature distribution map in an urban environment (researcher)
Three different points were taken to illustrate the map based on the surface air temperature distribution index in the Al-Amir neighborhood. It appears that temperatures in area A1 range between (41.85℃ - 42.08℃), which are all within high heat stress levels, while point A2 ranges between (42.30℃ - 42.76℃). They are all within levels of medium to exhausting heat stress. These areas constitute heat centers that suffer from a lack of ventilation and lack of shading. This is attributed to the privation of vegetation cover and the misuse of building materials, while area A3 was less than (41.16℃). All of these areas are located within high temperature levels, due to the lack of vegetation, ventilation, or shade from urban areas or those facing the wrong direction, which are exposed to direct sunlight and thus have greater radiation reflected to the ground.
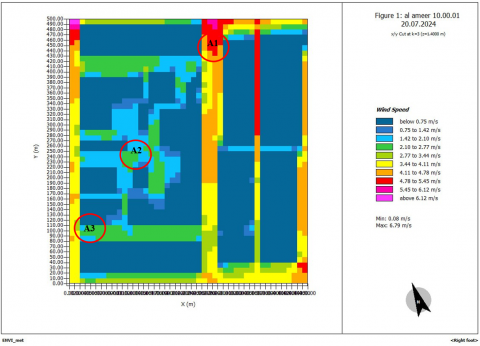
The Wind Speed: Based on the wind speed distribution map shown in Figure 8, three different areas were selected to illustrate the variation in ventilation within the Al-Amir neighborhood. The results indicate that most parts of the neighborhood fall within a wind speed range of (2–5 m/s), which is considered above the comfortable range in hot urban climates, particularly in dry regions, where such speeds may cause dust storms. According to ASHRAE standards, the typical and comfortable range is between (1–2 m/s) [30].
Figure 8. Spatial distribution map of wind speed (researcher)
In point A1, the speed ranged between (4.11 and 5.45 m/s), indicating strong airflow and very good ventilation, mostly attributed to the proximity of wide streets or undeveloped urban spaces. In point A2, the speed ranged between (1.42–2.10 m/s), which lies at the upper limit of the comfortable range but may still be insufficient to mitigate heat stress in densely built-up zones. In point A3, wind speed ranged from (2.77–3.44 m/s), classified as moderate ventilation, yet it remains above the optimal level for dry environments and may contribute to discomfort due to increased dust dispersion.
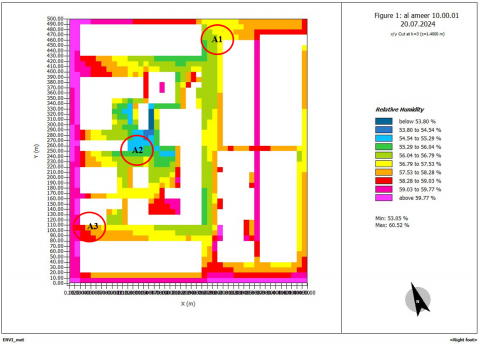
The Relative Humidity: Based on the relative humidity distribution map shown in Figure 9, three different areas were selected to illustrate the spatial variation in humidity levels across the Al-Amir neighborhood. The analysis reveals that the neighborhood experiences moderate relative humidity, ranging from 53% to over 60%, which contributes to a general sense of discomfort when combined with elevated air temperatures. According to ASHRAE standards, the comfortable range is between 50 and 60% [30].
Figure 9. Spatial distribution map of relative humidity in urban environments (researcher)
In point A1, relative humidity ranges between 55.29% and 56.04%, indicating moderate moisture levels. Point A2 falls within the same range (55.29%–56.04%), marking the beginning of moderate humidity, and is associated with relatively more comfortable conditions and better airflow. In contrast, point A3 records humidity levels between 58.28% and 59.03%, which represent very high humidity, contributing to thermal discomfort, especially when coupled with high temperatures and inadequate ventilation.
The combined analysis of thermal comfort indicators—including air temperature, wind speed, and relative humidity—confirms that the Al-Amir neighborhood suffers from uncomfortable microclimatic conditions. These challenges are particularly evident in interior points characterized by dense urban structures, limited vegetation, and poor ventilation. Climate maps strongly suggest that urban interventions, such as expanding green infrastructure and implementing ventilation corridors, are vital for enhancing thermal comfort and improving residents’ happiness.
E. Waste management:
One of the fundamental environmental factors that influences urban life and public health, which in turn influences the contentment of the people living in the Al-Amir district of Najaf, is waste management. According to the field research, there are challenges in this area, chief among them being the daily production of more than 19.7 tons of garbage and the daily lifting rate of 13 tons, which leads to the accumulation of waste in various locations. In addition to the proliferation of haphazard dump locations, which resulted in unsightly pollution and disagreeable smells, the neighborhood lacks a sorting or recycling system and has a shortfall of containers (one container for every 20 households) [30].
Questionnaire Form on the Environmental Reality in Al-Amir Neighborhood – Najaf:
Sustainable environmental indicators are essential elements in assessing the level of urban life. The table below shows the results of the field survey of the residents of Al-Amir neighborhood regarding a set of sustainable environmental indicators according to the satisfaction measurement (good/acceptable/bad). These results reflect the current environmental situation and reveal the deficiencies in the levels of advanced services, as shown in the following Table 4.
Table 4. Results of the field survey in Al-Amir neighborhood in the city of Najaf
|
Indicator |
Good (%) |
Acceptable (%) |
Bad (%) |
|
Air Quality |
26.3 |
33.3 |
40.4 |
|
Access to green spaces |
19.9 |
25.3 |
54.8 |
|
Noise Level |
29.5 |
36.0 |
34.5 |
|
Garbage collection |
32.2 |
33.6 |
34.2 |
|
THERMAL COMFORT |
22.9 |
26.3 |
50.8 |
Resource: The author's
The previous results show an increase in the ratios of bad evaluation in most indicators, which indicates a clear environmental deterioration in Al-Amir neighborhood, especially in the indicator of access to green spaces and air quality. Low ratings of good were recorded, which shows a decrease in the levels of satisfaction in the population.
5.2 Analysis of the relationship between sustainable environmental indicators and population happiness
The analysis of the relationship between the happiness of the population and sustainable environmental indicators in the Amir neighborhood was conducted using Pearson Index. Table 5 below shows the impact of each environmental indicator on the satisfaction of the population based on the measured values and the questionnaire data.
Table 5. Analyzing the relationship between sustainable environmental indicators and the population's happiness level using Pearson's coefficient
|
Environmental Indicator |
Average Rating of Population (%) |
Value Measured |
Correlation Coefficient R |
p Value |
Overall Impact on Happiness |
|
Air Quality |
59.6 (= 26.3+33.3) |
77 |
-0.45 |
0.02 |
Negative Moderate |
|
Entry |
65.5 (= 29.5+36.0) |
65-68 |
-0.50 |
.015 |
Negative Moderate |
|
Green spaces |
45.2 (= 19.9+25.3) |
1.6 m²/person |
0.60 |
0.01 |
Strong Positive |
|
THERMAL COMFORT |
49.2 (= 22.9+26.3) |
59.56–65.8℃ |
-0.55 |
0.01 |
strong negative |
|
Waste Management |
65.8 (= 32.2+33.6) |
13/19.7 tons lifted per day |
-0.30 |
0.04 |
Weak negative |
Resource: The author's
The data indicates that green spaces represent the most positive factor in the happiness of the neighborhood residents (r = +0.60). This highlights the importance of green spaces in enhancing psychological comfort, while indicators of noise, thermal comfort and air quality showed a moderate to strong negative correlation (r between -0.45 and-0.55). This shows the clear impact in reducing satisfaction levels, especially in light of high temperatures and noise level. The waste management indicator showed its impact by (r = -0.30) on the happiness of the population, see Table 6.
Table 6. Summary of the relationship between sustainable environmental indicators and the happiness of residents in the region
|
Environmental Indicator |
Value Measured |
Population Opinion |
Laden with Happiness |
|
Air Quality |
77 |
40.4%see it as bad |
Medium |
|
Entry |
.DB |
34.5% Dissatisfied |
Negative Moderate |
|
Green spaces |
Per capita = 1.6 m² |
54.8% see it as bad |
Strong Positive |
|
THERMAL COMFORT |
Pet = 59℃ |
50.8% uncomfortable |
strong negative |
|
Waste Management |
Only 13 of 19.7 tons per day are lifted |
34.2% say it is bad |
Weak negative |
Resource: The author's
5.3 Comparison of environmental indicator results in Copenhagen and the study area, Al-Amir neighborhood
In terms of air quality, the average concentration of fine particulate matter (PM2.5) is about 9.2 micrograms/m³, while carbon dioxide emissions have decreased by 74% thanks to the shift to clean energy and the promotion of sustainable transportation. In terms of green spaces, more than 90% of the population lives less than 500 meters from a green area, which enhances environmental justice and provides a comfortable daily environment. As for noise levels, noise pollution levels have been reduced to 80% of residential areas within the permissible limits. In the field of waste management, the city has achieved a 100% sorting and recycling rate through smart and effective systems.
In terms of air quality, the average concentration of fine particulate matter (PM2.5) is about 24 micrograms/m³. With regard to green spaces, more than 30% of the population lives less than 500 meters from a green area, which reduces the ease of access to these areas. As for the noise level, it is characterized by high noise levels and there are no treatments to reduce noise levels due to the inability of treatments, lack of afforestation, and the lack of use of insulating materials, in addition to traffic congestion. Noise pollution levels reach (70-80%) of residential areas, which is outside the permissible limits, In the field of waste management, the daily waste collection rate is only 66% of the total waste collected daily, and the recycling rate = is 0% (due to the absence of a sorting or recycling system or smart and effective systems).
The results of the statistical analysis showed a significant correlation between the indicators of sustainable environment and the level of urban happiness and well-being of the population, as the Pearson coefficient showed that these indicators contribute directly to shaping the urban experience of the population:
[1] Montgomery, C. (2013). Happy City: Transforming Our Lives Through Urban Design. Penguin UK.
[2] Mirzaei, S., Zangiabadi, A. (2021). Studying and complying dimensions, indicators and variables related to a happy city. International Review for Spatial Planning and Sustainable Development, 9(2): 94-111. https://doi.org/0.14246/irspsda.9.2_94
[3] Ballas, D. (2013). What makes a ‘happy city’? Cities, 32: S39-S50. https://doi.org/10.1016/j.cities.2013.04.009
[4] Global Council for Happiness and Wellbeing. (2019). Global happiness and wellbeing policy report. https://www.happinesscouncil.org/report/2019/global-happiness-and-well-being-policy-report.
[5] Jonek-Kowalska, I., Wolniak, R. (2022). Smart Cities in Poland. Towards Sustainability and a Better Quality of Life? Routledge. https://library.oapen.org/bitstream/handle/20.500.12657/96904/9781000935349.pdf?sequence=1&isAllowed=y.
[6] Balasubramanian, A. (2019). Environmental indicators. In World Water Day Presentation. http://doi.org/10.13140/RG.2.2.28305.79200
[7] Roy, A., Garai, N., Biswas, J.K. (2023). Exploration of urban sustainability in India through the lens of sustainable development goals. Discover Sustainability, 4(1): 41. https://doi.org/10.1007/s43621-023-00158-2
[8] Streimikiene, D. (2015). Quality of life and housing. International Journal of Information and Education Technology, 5(2): 140-145. https://doi.org/10.7763/IJIET.2015.V5.491
[9] Dong, Y., Hauschild, M.Z. (2017). Indicators for environmental sustainability. Procedia CIRP, 61: 697-702. https://doi.org/10.1016/j.procir.2016.11.173
[10] Alwan, K. H., Al‑Jawari, S.M., Al-Rikabi, N.K. (2024). Evaluation of the sustainability of urban settlement of the purified water supply service. IOP Conference Series: Materials Science and Engineering, 3249: 070001. https://doi.org/10.1063/5.0236266
[11] Zumaya, J.Q., Motlak, J.B. (2019). The role of environmental indicators in improving the quality of urban life in the city of Baghdad–A comparative study. IOP Conference Series: Materials Science and Engineering, 518(2): 022085. https://doi.org/10.1088/1757-899X/518/2/022085
[12] Andalib, E., Temeljotov‑Salaj, A., Steinert, M., Johansen, A., Aalto, P., Lohne, J. (2024). The interplay between the built environment, health, and well‑being—A scoping review. Urban Science, 8(4): 184. https://doi.org/10.3390/urbansci8040184
[13] Brereton, F., Clinch, J.P., Ferreira, S. (2008). Happiness, geography and the environment. Ecological Economics, 65(2): 386-396. https://doi.org/10.1016/j.ecolecon.2007.07.008
[14] Mouratidis, K. (2021) Urban planning and quality of life: a review of pathways linking the built environment to subjective well-being. Cities, 115: 103229. https://doi.org/10.1016/j.cities.2021.103229
[15] Jedi, Z.A.J., Al-Jawari, S.M. (2023). Prediction of formal transformations in city structure (Kufa as a model) based on the cellular automation model and Markov chains. International Journal of Sustainable Development and Planning, 18(5): 1417-1424. https://doi.org/10.18280/ijsdp.180512
[16] Wesz, J.G.B., Miron, L.I.G., Delsante, I., Tzortzopoulos, P. (2023). Urban quality of life: A systematic literature review. Urban Science, 7(2): 56. https://doi.org/10.3390/urbansci7020056
[17] Larson, L.R., Jennings, V., Cloutier, S.A. (2016). Public parks and wellbeing in urban areas of the United States. PLoS ONE, 11(4): e0153211. https://doi.org/10.1371/journal.pone.0153211
[18] Kitole, F.A., Ojo, T.O., Emenike, C.U., Khumalo, N.Z., Elhindi, K.M., Kassem, H.S. (2024). The impact of poor waste management on public health initiatives in shanty towns in Tanzania. Sustainability, 16(24): 10873. https://doi.org/10.3390/su162410873
[19] Mandić, L., Đjukić, A., Marić, J., Mitrović, B. (2024). A systematic review of outdoor thermal comfort studies for the urban (re)design of city squares. Sustainability, 16(12): 4920. https://doi.org/10.3390/su16124920
[20] City of Copenhagen. (2021). Green Economy Leader Report – Copenhagen. Copenhagen: City of Copenhagen. Retrieved from https://international.kk.dk/sites/default/files/2021-09/Green%20Economy%20Leader%20Report%20-%20Copenhagen.pdf.
[21] Engemann, K., Pedersen, C.B., Arge, L., Tsirogiannis, C., Mortensen, P.B., Svenning, J. (2019). Residential green space in childhood is associated with lower risk of psychiatric disorders from adolescence into adulthood. Proceedings of the National Academy of Sciences of the United States of America, 116(11): 5188-5193. https://doi.org/10.1073/pnas.1807504116
[22] Giannakis, E., Bruggeman, A. (2017). Determinants of regional resilience to economic crisis: A European perspective. European Planning Studies, 25(8): 1394-1415. https://doi.org/10.1080/09654313.2017.1319464
[23] City of Copenhagen. (2011). Copenhagen climate adaptation plan. Copenhagen: Technical and Environmental Administration. https://international.kk.dk/sites/default/files/2021-09/Copenhagen%20Climate%20Adaptation%20Plan%20-%202011.pdf.
[24] Bhawre, P. (2020). Study of air quality index over Indian region during lockdown period, COVID‑19. Atmospheric Pollution Research, 12(6), 11959-1967. http://doi.org/10.24941/ijcr.38710.06.2020
[25] Shihab, A.S. (2023). Assessment of air quality through multiple air quality index models–A comparative study. Journal of Ecological Engineering, 24(4): 110-116. https://doi.org/10.12911/22998993/159398
[26] Zhang, X., Zhou, S. (2023). Building a city with low noise pollution: Exploring the mental health effect thresholds of spatiotemporal environmental noise exposure and urban planning solution. International Journal of Environmental Research and Public Health, 20(5): 4222. https://doi.org/10.3390/ijerph20054222
[27] Syamili, M.S., Takala, T., Korrensalo, A., Tuittila, E.S. (2023). Happiness in urban green spaces: A systematic literature review. Urban Forestry & Urban Greening, 86: 128042. https://doi.org/10.1016/j.ufug.2023.128042
[28] Liu, Z., Li, J., Xi, T. (2023). A review of thermal comfort evaluation and improvement in urban outdoor spaces. Buildings, 13(12): 3050. https://doi.org/10.3390/buildings13123050
[29] Jain, T.K. (2019). Concept of happy city: The smart cities of the future. http://doi.org/10.2139/ssrn.3314531
[30] ASHRAE. (2017). ANSI/ASHRAE Standard 55: Thermal environmental conditions for human occupancy. Atlanta, GA: American Society of Heating, Refrigerating and Air-Conditioning Engineers. https://en.wikipedia.org/wiki/ASHRAE_55.