Tajidan Tajidan*![]() | Rifani Nur Sindy Setiawan
| Rifani Nur Sindy Setiawan![]() | Efendy Efendy
| Efendy Efendy![]() | Sharfina Nabilah
| Sharfina Nabilah![]() | Sri Mulyawati
| Sri Mulyawati![]() | Taslim Sjah
| Taslim Sjah![]() | Siti Nur Amirah
| Siti Nur Amirah![]()
© 2025 The authors. This article is published by IIETA and is licensed under the CC BY 4.0 license (http://creativecommons.org/licenses/by/4.0/).
OPEN ACCESS
This study assesses the welfare of industrialists and employees of the tofu agro-industry in Central Lombok, Indonesia. The analysis tool used was the producer's surplus compared to the provincial minimum wage. To achieve this goal, data was collected using triangulation techniques, which combine observation, survey, and in-depth interview methods. The respondents are industrialists and employees of the tofu agro-industry in each village, specifically 26 business units in Puyung Village and four household-scale business units in Aikmual Village. The number of business unit samples in each village is determined proportionally to the number of business units in each village. The results of the study show that the R-Studio application can be used to calculate the producer's surplus with precision results. The agro-industrial entrepreneurs in Puyung Village are classified as very prosperous, while the welfare entrepreneurs of the tofu agro-industry in Aikmual Village is classified as prosperous, and employees in the two villages are at a prosperous level. Sustainable employee well-being can be achieved through efforts to increase productivity, the selection of product sizes according to market demand, and the use of fuel-efficient technologies.
employees, producer's surplus, welfare, tofu, sustainable business
Central Lombok Regency, located in West Nusa Tenggara Province, Indonesia, has the potential in agricultural sector. Food crops are the largest sub-sector compared to the plantation, horticulture, livestock, and fisheries sub-sectors [1]. Therefore, the food crop sub-sector is essential in the regional economy [2], including providing employment opportunities for many people, contributing to regional income. Despite the contribution of the crop sub-sector food crops is relatively significant, there are still challenges that need to be overcome in efforts to improve the welfare of farmers, because the majority of food crop farmers live in less prosperous conditions [3], as the agricultural products produced in the food crop sector are agricultural products that have not been processed into products of high economic value [4].
One of the food crop commodities widely cultivated in Central Lombok Regency, particularly in Jonggat District and West Praya District, is soybean. The area of soybean plants in Central Lombok Regency is 20,891 hectares, productivity is 12.89 ku/hectar, and production is 26,123 tons [5]. Central Lombok Regency is the second largest soybean producer after the Bima Regency in West Nusa Tenggara Province. The potential of soybeans in Central Lombok Regency is essential for developing into a product of high economic value. Tofu is a processed product made from soybeans as raw materials [6]. Therefore, developing the tofu agro-industry in Central Lombok Regency needs to receive attention from various parties through guidance and development.
The tofu agro-industry in Central Lombok Regency is supported by factors such as the availability of quality local soybean as raw materials [7], adequate transportation infrastructure, support from the local government in terms of policies and regulations, as well as ease of obtaining facilities. Tofu agro-industry players, face many obstacles such as fluctuations in raw material prices, tight market competition, inefficient production management, finance, and marketing. One crucial aspect that needs to be considered in improving the welfare of industrialists and employees in the tofu agro-industry sector is controlling the price of soybean [8, 9]. Soybean as raw materials is the most significant component of production costs [7].
Apart from that, it is also essential to pay attention to other factors that can influence the welfare of industrialists and employees in the tofu agro-industry sector [10], such as working conditions and decent wages for workers, as well as environmentally friendly and sustainable production practices [11]. Among the environmentally friendly technologies that have been widely applied is the use of energy-efficient furnaces. The use of energy-saving furnaces can increase thermal efficiency from 4.2% to 14.7% [12], thus reducing fuel use. The appropriate technology that is now being adopted by tofu industrialists in Central Lombok is steam boilers. The use of steam boilers, in addition to saving the use of labor because of shorter working time, also reduces the use of firewood, and improves the quality of tofu products, namely, tofu is to be tastier and hygienic [13]. However, it is unfortunate that the use of steam boilers has only been adopted by 20% of the tofu agro-industry business units. Therefore, the use of appropriate and environmentally friendly technology can reduce production costs, so that it can increase income and the welfare of actors in the tofu agro-industry. By paying attention to all these aspects holistically, it is hoped that it can create supportive conditions for the sustainable growth of the tofu agro-industry sector and improve the welfare of all stakeholders [14, 15].
To raise the welfare of tofu agro-industry players, they still need a long-term struggle to get them out of poverty and into a group of prosperous households. The results of a study conducted by Suriani et al. [13] show that industrialists in the tofu agro-industry in Mataram City have reached a prosperous level measured based on minimum physical needs set by the Central Statistics Agency. In contrast, a study by Tajidan et al. [16] in East Lombok Regency shows that the workforce of those in the tofu agro-industry is still considered less prosperous as measured by the provincial minimum wage. Labor wages are lower compared to the provincial minimum wage.
In the context of the tofu agro-industry, producer surplus can provide an idea of how efficient the production process is. It can also show the profit achieved by industrialists and how much of it is distributed to industrialists and employees [17]. The distribution of producer surplus received by industrialists and employees, then compared with the provincial minimum wage, can determine the impact of the tofu agro-industry on the welfare of industrialists and employees.
The research aims to design sustainable employee welfare improvement in tofu agro-industry. The purpose of the study was to measure producer surplus using the R-Studio application, i.e., the integral of the yield times the quantity of tofu production at the market price minus the marginal cost. Furthermore, the producer surplus received by industrialists and employees is compared to the provincial minimum wage. The research results are hoped to be useful in making decisions about planning policies aimed at improving the welfare of employees, and industrialists of the tofu agro-industry.
2.1 Research sites
The research was carried out in Puyung Village and Aikmual Village in Central Lombok Regency. The research location was determined purposely, considering that Puyung Village and Aikmual Village are tofu agro-industry centers in Central Lombok Regency [18].
2.2 Sampling unit and analysis unit
The household-scale tofu agro-industry business unit is a sampling unit and a unit of analysis. Using quota sampling, the number of sampling units was determined to be 30 due to budget limitations, time to conduct research, and lack of a sampling frame. In contrast, the number of sampling units per village was determined proportionally based on the total number of businesses in each location, i.e., 26 business units in Puyung Village and four business units in Aikmual Village. Sampling units were selected using an accidental sampling technique, which was chosen when the survey was carried out.
2.3 Data collection technique
Primary data was obtained from a combination of three data collection methods, including observation at the business location, structured interviews, and in-depth interviews. The objects observed include the building where the business is located, the equipment, and the machinery used, the amount of labor involved, and the quantity and quality of consumables. Structured interviews using semi-closed questionnaires consist of respondent characteristics, quantity, and price of tofu products, quantity and price of raw materials, quantity and price of auxiliary materials, quantity and wages of labor, and depreciation costs of equipment. In-depth interviews using guidance on the production process, production period, maintenance of assets and capital goods, sources of financing, cash inflows and cash outflows, as well as indirect costs such as capital costs, taxes, and labor recruitment. The key informants in an in-depth interview are the agro-industry managers. Secondary data was obtained using desk study techniques, i.e., accessing online data [19, 20]. NTBsatudata, West Nusa Tenggara Province Central Statistics Agency, Central Statistics Agency, and Central Lombok Regency Agriculture Service, and data from references that can be accessed via the internet.
2.4 Data processing
The data collected was processed using Computer and Excel software. Data per unit of analysis are tabulated, converted, and summed, and the average is calculated. Data is grouped according to the type of data. Each type of data is placed on one sheet. The data group consists of respondent characteristics, raw materials, auxiliary materials, labor, tools, machinery, buildings, and capital [21-23].
2.5 Data analysis
The equation of cost and value of production is assumed to be linear with the quantity of production. Assuming the equation of cost and value of linear production, the regression coefficient is the average variable cost (AVC). The production cost is formulated in Eq. (1), and the production value is formulated in Eq. (2), so that the profit equation is listed in Eq. (3).
$\sum_{i=1}^n T C i=\sum_{i=1}^n T F C i+\sum_{i=1}^n A V C i * Q i$ (1)
$\sum_{i=1}^n T R i=\sum_{i=1}^n P Q i$ (2)
$\sum_{i=1}^n L i=\sum_{i=1}^n T R i-\sum_{i=1}^n T C$ (3)
Eqs. (1)-(3) are integrated into equations:
$L=P * Q-(T F C+A V C * Q)$ (4)
Furthermore, Eq. (4) is transformed into a break-even point (BEP) formulation in Eqs. (5)-(7).
$L=P * Q-T F C-A V C * Q$
$L=(P-A V C) * Q-T F C$
$0=(P-A V C) * Q-T F C$
$B E P q=T F C /(P-A V C)$ (5)
$B E P=B E P q * P$ (6)
$B E P p=T F C /(1-T V C / T R)$ (7)
Information:
TC = total cost
TFC = total fixed costs
AVC = average variable cost
Q = production
TR = production value
P = product price per unit
L = profit
BEPq = break-even point of production
BEPp = break-even point revenue
The break-even point quantity (BEPq) is the minimum amount of production that must be achieved for the production process to be sustainable. If the production is smaller than BEPq, the industrialist is in a losing position, so it is not possible to produce. The production process only occurs if the production quantity is greater than BEPq. BEPq is the starting point for obtaining producer surpluses.
Assuming the equation of linear production costs with production quantities, the average variable cost is equal to the marginal cost. The producer surplus equation is obtained by substituting the margin cost with the average variable cost, so that the producer surplus equation is obtained as in Eq. (8).
$P S=1 / 2 *(P-A V C) *(Q-B E P q)$ (8)
Q in Eq. (8) is obtained from the modification of Eqs. (1)-(2) by substituting TR or TC with Y, so that Eq. (9) is obtained and can be described as a supply curve.
$\begin{gathered}
Y=T R=T F C+T V C \\
Y=T F C+A V C * Q
\end{gathered}$ (9)
The quantity of production in the market equilibrium is obtained by changing Eq. (9) to Eq. (10) as follows.
$Q=(Y-T F C) / A V C$ (10)
Information:
PS = producer surplus
P = product price per unit
AVC = average variable cost
TFC = total fixed costs
Q = production
BEPq = break-even point of production
Y = total revenue or total cost
The use of the R-Studio application in analyzing efforts to improve the welfare of employees and industrialists:
producen_surplus = function(P,Q)
To determine the Total Variable Cost, Total Fixed Cost, Average Variable Cost, breakeven point of production (BEPq), and producer surplus the author used the R-Studio application.
3.1 Research results
3.1.1 R-Studio application implementation for producer’s surplus
In this sub-section, the R-Studio application syntax is provided to determine the value of producer surplus from Puyung and Aikmual Villages. The first one is the syntax for the producer surplus of Puyung Villages.
|
surplus_produsen = function(P,Q) { data2=read.csv("C:/Users/HP/Documents/Data.SurplusPuyung.csv",header=TRUE,sep=";") TVC = sum(data2$Variabel.Cost) TFC = sum(data2$Fixed.Cost) AVC = TVC/Q BEPq = TFC/(P-AVC) PS = 0.5*(P-AVC)*(Q-BEPq) result = data.frame(TotalVarCost=TVC,TotalFixCost=TFC,AverageVarCost=AVC,BEPq=BEPq,PS=PS) return(result) } producer surplus (70000,659) > producer surplus (70000,659) TotalVarCost TotalFixCost AverageVarCost BEPq PS 1 29136479 475944 44213.17 18.45686 8258789 Then, this is the syntax for the producer surplus of Aikmual Village. producer surplus = function(P,Q) { data2=read.csv("C:/Users/HP/Documents/Data.SurplusAikmual.csv",header=TRUE,sep=";") TVC = sum(data2$Variabel.Cost) TFC = sum(data2$Fixed.Cost) AVC = TVC/Q BEPq = TFC/(P-AVC) PS = 0.5*(P-AVC)*(Q-BEPq) result = data.frame(TotalVarCost=TVC,TotalFixedCost=TFC,AveVarCost=AVC,BEPq=BEPq,PS=PS) return(result) } producer surplus (45000,848) > producer surplus (45000,848) TotalVarCost TotalFixCost AveVarCost BEPq PS 1 28827160 462755 33994.29 42.04682 4435043 |
From the results obtained using R software, it will be explained in the next sub-chapter.
3.1.2 Producer’s surplus by Excel versus R-Studio software application
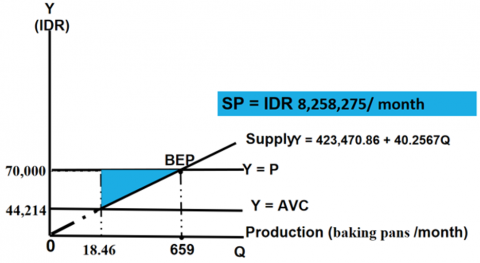
There are many concepts of producer surplus. What is clear is that the producer surplus is the margin for sacrifices in the production process. The concept commonly used is the area (integral) below the market price and above the cost margin curve or supply curve. In this study, the relationship between costs and production is assumed to be linear, so the marginal cost is the average variable cost, becoming Y = MC = AVC. Thus, the producer surplus is the area (integral) below the market price and above the supply curve, with the lower limit being the intersection point between average variable costs and the supply curve, and the upper limit being the intersection of price with the supply curve (Figure 1 and Figure 2). BEP and producer surplus can be calculated using Eqs. (13)-(14). Here, BEP is achieved when the price equals the sum of average fixed costs plus average variable costs, i.e., P = ATC + AVC [7, 24, 25].
The difference between total revenue and total variable costs is called the contribution margin [26]. Producer surplus is equal to half of the contribution margin. The producer surplus shows the level of welfare or satisfaction of producers with the performance achievements of their business (Table 1 and Figure 1).
Table 1. Producer surplus of tofu agro-industry in Puyung and Aikmual Villages
|
Description |
Puyung |
Aikmual |
|
Production (baking pan) |
659 |
848 |
|
BEP of Production (baking pan) |
18.46 |
42.05 |
|
Product price (IDR/baking pan) |
70,000.00 |
45,000.00 |
|
Average variable costs (IDR/baking pan) |
44,214.20 |
33,993.89 |
|
Producer Surplus (IDR) |
8,258,275 |
4,435,175 |
Figure 1. Producers' surplus of tofu agro-industry in Puyung Village
R-Studio can be used as an alternative in calculating producer surplus because the calculation results are not significantly different from the results of calculating producer surplus using Excel (p-value > 0.05). The results of the calculation of the producer's surplus are shown in Table 2.
Table 2. Results of the calculation of producer surplus
|
No. |
Application Type |
Puyung |
Aikmual |
|
1 |
R-Studio |
8,258,789 |
4,435,035 |
|
2 |
Excel |
8,258,275 |
4,435,175 |
|
3 |
p-value** |
0.883 |
0.901 |
R-Studio has the advantage of having several advantages compared to Excel in calculating producer surpluses [27]:
First, its statistical analysis capabilities are broader and more complex, and econometric models.
Second, it is flexible in handling complex and large data and can be integrated with various data sources.
Third, R-Studio is designed to provide precise results, so that it can be relied upon to get accurate prediction of results.
Fourth, it can help in interpreting the results of the calculation, and it can be used to compile repeatable and shareable scripts that can streamline analysis.
In many aspects, the use of Excel makes it easier to compile tables, graphs, and charts; so, it is easier to interpret data, and more accessible because it is available in the Windows package and can be integrated with Word and PowerPoint [28]. Therefore, the use of Excel in the analysis of a producer's surplus is still relevant to use.
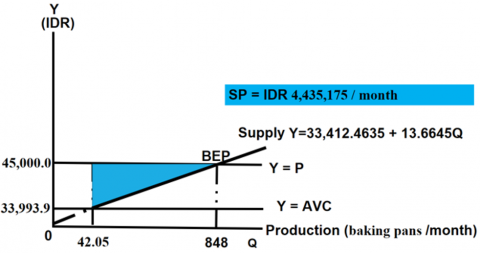
The average producer surplus for the tofu agro-industry in Puyung Village, Central Lombok, reaches IDR 8.3 million, and Aikmual Village IDR 4.4 million per month (Table 1, Figure 1 and Figure 2). The producer surplus is distributed as a measure of the performance of industrialists. The producer surplus value is 50% of the contribution margin, a relatively significant figure, so it can be ensured that the tofu agro-industry business is profitable, provides benefits in the formation of economic value, and contributes to improving prosperity for tofu agro-industry business actors. The welfare of business actors still has the opportunity to be improved through the use of tofu pulp as a raw material for tofu crackers, and liquid waste can be processed as liquid organic fertilizer [29].
Figure 2. Producers' surplus of tofu agro-industry in Aikmual Village
Improving the welfare of employees and entrepreneurs can be done by streamlining the use of raw materials, namely buying raw materials during the harvest season in sufficient quantities for one year, and purchasing is repeatedly every year so that the production process continues. The efficiency of the production process can be carried out by utilizing steam boiler technology because the results of the study carried out that the use of steam boilers can reduce production costs.
Designing sizes according to customer tastes is the most likely alternative strategy to be applied to improve the welfare of tofu agroindustry players. Sizes that are in high demand by customers can increase customer satisfaction, so customers are willing to pay a higher price. This argument is supported by empirical data that a larger tofu size of 22.29% can increase the price by 64.27%, increasing the contribution margin from IDR 11,007 to IDR 25,786 or 134.27% (Figure 1 and Figure 2). Optimizing the size of tofu products is an alternative strategy that is easy to implement because it does not require additional equipment or additional costs.
3.2 Discussion
3.2.1 Welfare of industrialists and employees
The welfare of industrialists can be measured from the comparison of the producer surplus (PS) and the provincial minimum wage (PMW) with the following conditions:
⮚ If PS < 1 * PMW, then it is declared not yet prosperous
⮚ If 1 ≥ PS < 2 * PMW, then it is declared prosperous
⮚ If PS ≥ 2 * PMW, then it is declared very prosperous
The classification of welfare is supported by the theory of welfare, which states that the minimum wage must improve the welfare of workers and their families [30, 31].
Table 1 and Figure 1 show that the tofu agro-industry producer’s surplus in Puyung Village is IDR 8,258,275, while the PMW is IDR 2,444,067/month. The ratio of producer surplus to PMW in Puyung Village is 3.38, meaning that industrialists in the tofu agro-industry are classified as very prosperous because PS > 2 * PMW. The results of this research are in line research by Satria et al. [32], which shows that households of tofu entrepreneurs in the Pringsewo Regency are in the prosperous category.
This study found that PS in Aikmual Village was 1.81 * PMW. Industrialists in Aikmual Village are declared relatively prosperous because PS < 2.0. The producer surplus of the tofu agro-industry in Aikmual Village is IDR 4,435,175/month (Figure 2), while PMW in West Nusa Tenggara is IDR 2,444,067/month. In this way, it can be ensured that the tofu agro-industry business in Central Lombok Regency is guaranteed to be sustainable because it can contribute to the regional economy, in particular by creating job opportunities, and at the same time as a source of livelihood for them. Using the 2024 PMW comparison of the wages or salaries of tofu agro-industry employees, it can be seen that employees in Puyung Village earn a wage of IDR 4,403,000/month (Table 3).
Table 3. Employee welfare of the tofu agro-industry in Puyung and Aikmual Villages
|
Description |
Puyung |
Aikmual |
|
OFW Wages (IDR/month) |
4,403,000 |
4,342,500 |
|
Use of Worker (MWD) |
53.41 |
53.57 |
|
Income (IDR/MWD)* |
82,437.75a) |
81,062.16b) |
|
PMW (IDR/MWD)** |
81,468.90a) |
81,468.90b) |
|
p-value |
0,4964 |
0,4920 |
|
Category |
Prosperous |
Prosperous |
The 2024 Central Lombok district minimum wage is IDR 2,450,968/month, higher than the provincial minimum wage of IDR 2,444,067/month [5]. Considering the position of labor wages as an employee's income, efforts need to be made to increase the wages of employees in the tofu agro-industry in Aikmual Village so that they can match the provincial and/or district minimum wages [5].
The average labor producer surplus in tofu agro-industry businesses in Puyung Village in Central Lombok has exceeded the provincial and district minimum wage. In contrast, the labor producer surplus in Aikmual Village is lower than the provincial minimum wage. One of the reasons is that more labor is used in Aikmual Village than necessary due to the additional work of printing and cutting tofu. The welfare conditions of workers in Aikmual Village are similar to those of tofu agro-industry workers in Masbagik District, where they are both at the provincial minimum wage [5, 25]. However, after statistical tests using the t-distribution, it showed that the producer’s surplus for employees was not significant to the provincial minimum wage standard. Similarly, the producer's surplus for employees between the two villages is non-significant (Table 3). Therefore, based on the producer surplus generated, the workforce working in the tofu agroindustry has reached a prosperous level.
In order for the input procurement, production, and marketing processes to be carried out effectively and efficiently, it is necessary to form an agro-industrial business cluster in Aikmual Village, or a joint business group tasked with purchasing raw materials collectively to save more on transportation and storage costs. Forming a tofu agro-industry cluster in Aikmual can overcome inefficiencies; apart from saving on purchasing raw materials and auxiliary materials, it can also solve the common problems they face [13, 33].
3.2.2 Fixed costs
In the short term, production costs consist of fixed and variable costs. Fixed costs are not used up in one process, while costs that are used up in one production process are called variable costs [34, 35].
Fixed costs consist of building costs, equipment costs, business premises rental, equipment, manager's salary, building land taxes, and licensing fees (if any). Some equipment is purchased periodically, such as filter clothes, large buckets, small buckets, and tools that break down quickly. In other areas, there are fixed costs for building wells, procuring water meters, warehouses for storing raw materials, and purchasing basket equipment and steamers. The type of equipment used varies between regions. The types and values of depreciation on building and equipment costs are shown in Table 4 [36].
Table 4. Fixed costs depreciation of tofu agro-industry in Puyung and Aikmual Villages
|
Description |
Investment (IDR) |
Squirrel (IDR) |
Investment |
Aikmual (IDR) |
|
Depreciation (IDR/Month) |
Depreciation (IDR/Month) |
|||
|
Building |
10,300,000 |
83,666 |
10,500,000 |
85,227 |
|
Milling Machine |
2,600,000 |
23,916 |
2,975,000 |
26,945 |
|
Furnace |
3,450,000 |
28,003 |
2,900,000 |
23,539 |
|
Sideburns |
1,627,000 |
7,711 |
1,425,000 |
5,276 |
|
Centipede |
886,000 |
20,427 |
656,000 |
19,531 |
|
Press |
312,000 |
1,481 |
302,500 |
1,583 |
|
|
1,723,000 |
19,231 |
1,800,000 |
20,089 |
|
Big Bucket |
530,000 |
6,161 |
525,000 |
6,250 |
|
Little Bucket |
413,000 |
5,522 |
415,000 |
5,536 |
|
Filter cloth |
36,300 |
286 |
43,000 |
308 |
|
Rack |
159,000 |
2,304 |
131,500 |
1,808 |
|
Amount |
22,036,300 |
198,709 |
21,673,000 |
196,092 |
Table 5. Fixed costs of capital interest of tofu agro-industrial in Puyung and Aikmual Villages
|
Fixed Cost Type |
Puyung (IDR/Month) |
Aikmual (IDR/Month) |
|
Investment Capital |
22,036,300 |
21,673,000 |
|
Operational Capital |
23,310,710 |
23,134,660 |
|
Capital costs 0.5%/month |
227,235 |
223,538 |
|
Amount |
45,447,010 |
44,707,660 |
Table 6. Types and values of fixed costs for the tofu agro-industry in Puyung and Aikmual Villages
|
Fixed Costs Type |
Puyung (IDR/Month) |
Aikmual (IDR/Month) |
|
Capital interest |
227,235 |
223,538 |
|
Property taxes |
50,000 |
43.125 |
|
Depreciation of buildings and equipment |
198,709 |
196,092 |
|
Amount |
475,944 |
462,755 |
The total depreciation value (IDR/month) is then used as a fixed cost component in the breakeven point (BEP) analysis and producer surplus (PS) analysis.
By using a capital cost approach of half a percent per month, the capital costs obtained are IDR 227,235 in Puyung Village and IDR 223,538/month in Aikmual Village for the tofu agro-industry business (Table 5). The fixed cost components collected consist of capital interest, land and building taxes, and depreciation of buildings and equipment. Table 6 shows the components of fixed costs in household-scale tofu agro-industry businesses.
The largest component of fixed costs is capital interest, followed by depreciation of the value of buildings and equipment. Land and building taxes occupy the lowest ranking, i.e., less than IDR 100,000. Meanwhile, other fixed costs such as permits, halal certificates, and I-PRT certificates have never existed because they have never been sought and obtained.
3.2.3 Variable costs
Variable costs consist of material costs and labor wages. Material costs consist of raw materials and auxiliary materials. The raw material is dry soybean seeds. The sources of raw materials are local soybeans or imported soybeans. Due to the need for soybeans, some raw materials use imported soybeans. Table 4 shows the names of countries that are sources of soybean imports. The largest source of countries supplying soybeans is the United States (Table 7) [12, 37, 38].
Table 7. List of source countries for soybean imports to Indonesia in 2021
|
Country Name |
Value (USD) |
|
United States of America |
1,286,840,699 |
|
Canada |
135,895,452 |
|
Argentina |
52,080,377 |
|
Brazil |
5,348,383 |
|
Malaysia |
2,463,462 |
Around 90% of the total demand for imported soybeans comes from the United States, with the remaining 10% shared among Canada, Argentina, Brazil, and Malaysia (Table 7). The need for soybeans is sure to increase, especially to meet the food needs for tofu from soybeans. The global security situation influences the amount of soybean imports supplies. International security disturbances, such as war and criminal acts of pirates affect the amount of insurance premium costs and disruption of international shipping. The total variable costs of the tofu agro-industry can be seen in Table 8.
Table 8. Variable costs of tofu agro-industry in Puyung and Aikmual Villages
|
Description |
Puyung (IDR/Month) |
Aikmual (IDR/Month) |
|
Soybean Raw Materials |
20,492,308 |
20,250,000 |
|
Auxiliary Materials: |
|
|
|
Saltwater |
197,654 |
190.125 |
|
Salt |
395,308 |
380,250 |
|
PDAM water |
54,038 |
110,000 |
|
Well Water (Electricity) |
16,154 |
- |
|
Motorcycle Fuel |
720,000 |
720,000 |
|
Engine Fuel |
720,000 |
720,000 |
|
Oil |
14,286 |
14,285 |
|
Remember |
400,962 |
- |
|
Wood |
196.154 |
750,000 |
|
Peanut Shells |
103,846 |
- |
|
Amount |
23,310,710 |
23,134,660 |
Raw materials account for 87.86% of material costs, while the remainder (12.14%) is the cost of auxiliary materials (Table 8). This research's results are in line with those of which confirm that the largest cost component in the tofu agro-industry is raw materials.
The raw material is dry soybean grain. Raw material prices are relatively expensive and tend to increase, making it difficult for industrialists to manage business units. Tofu entrepreneurs use this yeast in Abiantubuh Village, Sandubaya District, in Mataram City. Yeast can improve the quality of tofu so that the tofu is chewier, and the yield of tofu also increases [7, 39].
In one month, the average wage is IDR 85,160/MWD in Puyung and IDR 86,394/MWD. This average wage will determine the level of employee welfare, but the amount received is less because the use of labor exceeds requirements. The absorption of labor from workers outside the family in Puyung is almost the same as in Aikmual because the technology used is almost the same (Table 9).
Table 9. The variable costs of labor for tofu agro-industry in Puyung and Aikmual Villages
|
Description |
Puyung |
Aikmual |
||
|
MWD |
IDR |
MWD |
IDR |
|
|
Labor in the Family |
15.00 |
1,422,692 |
12.32 |
1,350,000 |
|
Workers outside the family |
53.41 |
4,403,077 |
53.57 |
4,342,500 |
|
Amount |
68.41 |
5,825,769 |
65.89 |
5,692,500 |
3.2.4 Production and production value
Based on quantity units, the average tofu production in Puyung is less than in Aikmual. However, the production value in Puyung is higher than in Aikmual because the price of tofu per unit in Puyung is more expensive than in Aikmual. This is because the size of the tofu in Aikmual is smaller than in Puyung. One baking pan of tofu in Puyung requires 2.5 to 3.0 kg of raw materials with an average of 2.59 kg/baking pan, while in Aikmual, one baking pan is filled with 1.8 to 2.2 kg with an average of 1.99 kg/baking pan, meaning that the size of the tofu produced in Puyung is larger than the size of the tofu produced in Aikmual, but what is interesting is the price Tofu from Puyung is more expensive than tofu from Aikmual (Table 10), so it has an impact on income generation for industrialists. Consumer behavior in assessing product prices is interesting to study further to determine the price effectiveness index.
Table 10. Production and production value of tofu agro-industry in Puyung and Aikmual Villages
|
Description |
Puyung |
Aikmual |
|
Production (baking pan/month) |
659 |
848 |
|
Price (IDR/baking pan) |
70,000 |
45,000 |
|
Production value (IDR/month) |
46,130,000 |
38,160,000 |
Based on quantity units, the average tofu production in Puyung is less than Aikmual. However, the production value in Puyung is higher than in Aikmual because the price of tofu per unit in Puyung is higher than in Aikmual. This is because the size of the tofu in Aikmual is smaller than in Puyung. One baking pan of tofu in Puyung requires 2.5 to 3.0 kg of raw materials with an average of 2.59 kg/baking pan, while in Aikmual, one baking pan is filled with 1.8 to 2.2 kg with an average of 1.99 kg/baking pan, meaning that the size of the tofu produced in Puyung is larger than the size of the tofu produced in Aikmual, but what is interesting is the price Tofu from Puyung is more expensive than tofu from Aikmual, so it has an impact on income generation for industrialists and employees. Consumer behavior in assessing product prices is interesting to study further to determine the price effectiveness index.
Production value results from production at a price per unit. The production value of tofu reaches IDR 45 million to IDR 46 million per month, which is a prominent figure for the tofu agro-industry on a household scale. Even though the use of raw materials is almost the same between the agro-industries in Puyung and Aikmual (Table 11), the production value is quite unequal.
Table 11. Analysis of production cost, volume, and profits of tofu agro-industry in Puyung and Aikmual Villages
|
Description |
Puyung |
Aikmual |
|
Production (baking pan/month) |
659 |
848 |
|
Price (IDR/baking pan) |
70,000 |
45,000 |
|
Production value (IDR/month) |
46,130,000 |
38,160,000 |
|
Fixed Fee (IDR/month) |
475,944 |
462,755 |
|
Total Variable Costs |
29,136,479 |
28,827,160 |
|
Raw Material Costs (IDR/month) |
20,492,308 |
20,250,000 |
|
Cost of Auxiliary Materials (IDR/month) |
2,818,402 |
2,884,660 |
|
Kindergarten fees (IDR/month) |
5,825,769 |
5,692,500 |
|
Total Cost (IDR/month |
29,612,423 |
29,289,915 |
|
Profit (IDR/month) |
16,517,577 |
8,870,085 |
Product quality is a consideration for consumers when providing services for a product. Good quality tofu, is chewy, has a flexible texture, and is clean white. The amount of remuneration for a product is also influenced by the product's interaction with consumers, their past experiences that shape the image. A positive image can increase the demand and price of a product [40].
3.2.5 Break-even point
The components that determine the break-even point (BEP) are total fixed costs, product price per unit, and average variable costs. Using fixed costs per month produces a BEPq value of 18.42 baking pans in Puyung and 42.05 baking pans per month in Aikmual (Table 11), meaning that the business unit produces above BEPq, and the company operates in an area that generates profits. In other words, the production process is in the profit-making zone or has exceeded the breakeven point. The results of this research are the results of research conducted by, and the "Vivi" tofu business in the city of Palu produces above the breakeven point [33, 40, 41].
The contribution margin is the most determining factor in achieving BEPq. If the contribution margin is positive, BEP will inevitably be obtained in the short term. However, if the contribution margin is negative, the business will be in a loss position, and it will also be impossible to obtain BEPq or BEPp revenue [12].
The tofu agro-industry in Puyung is more efficient than the tofu agro-industry in Aikmual. This is shown by the BEPq in Puyung being achieved more quickly than the BEPq in Aikmual (Table 12). Even though the average variable costs of the tofu agro-industry in Puyung are higher than those in Aikmual because the price is higher, the tofu produced in Puyung can reach BEP earlier.
Table 12. The break-even point of tofu agro-industry in Puyung and Aikmual Villages
|
Description |
Puyung |
Aikmual |
|
Production (baking pan/month) |
659 |
848 |
|
Price (IDR/baking pan) |
70,000 |
45,000 |
|
Average Variable Cost (IDR/baking pan) |
44,214 |
33,994 |
|
Fixed Fee (IDR/month) |
475,944 |
462,755 |
|
BEPq production (baking pan) |
18.46 |
42.05 |
|
BEPp receipts (IDR) |
1,292,200 |
1,892,250 |
The R-Studio application has the same level of precision as Excel, so it can be used to calculate producer surpluses and engineer improvements in the welfare of industrialists and employees. The surplus of producers from the tofu agroindustry in Puyung Village is 3.38 times, while the surplus of producers in Aikmual Village is 1.8 times the provincial minimum wage, due to a more efficient production process, higher productivity, and the quality and size of products in according to customer demand. The welfare of tofu agro-industry entrepreneurs in Puyung Village has reached a very prosperous level compared to tofu agro-industry entrepreneurs in Aikmual Village that has reached a level of sufficient welfare. Employees of agro-industrial companies know that in both villages they have achieved a fairly prosperous level. Employee welfare can be improved through the utilization of production technology using steam boilers, energy-saving furnaces, the selection of product sizes according to customer demands, and conducting direct marketing to customers.
Future research on the tofu agro-industry will be expected to use a proportional random sampling technique with an optimization sampling size, to industrialists it is expected to increase the minimum employee wage equal to the district minimum wage and increase every year by taking into account the increase in minimum physical needs and the increase in employee wages exceeding the inflation rate.
This manuscript is supported by the Rector and Chairman of the Institute for Research and Community Service, University of Mataram, the financing is sourced from Non-Tax State Revenue in 2024 (Contract Number: 1217/UN18. L1/PP/2024). Thank you to the Dean of the Faculty of Agriculture, University of Mataram for the support and facilities provided in carrying out research activities.
[1] Anonymous. (2023). Lombok Tengah Regency in Figures 2023. BPS-Statistics Indonesia. https://lomboktengahkab.bps.go.id/en/publication/2023/02/28/d6970e473082805351a418b4/lombok-tengah-regency-in-figures-2023.html.
[2] Adhitya F.W., Hartono D., Awirya A.A. (2023). Determinants of agricultural land productivity of food crop subsector in Indonesia rent Land Productivity of Food Crop Subsector in Indonesia. Jurnal Ekonomi Pembangunan, 14(1): 110-125. http://doi.org/10.23917/jep.v14i1.165
[3] Nirmala, A.R., Hanani, N., Muhaimin, A.W. (2016). Analysis of factors that affecting farmers exchange rage of food crops in Jombang. Habitat, 27(2): 66-71. https://doi.org/10.21776/UB.HABITAT.2016.027.2.8
[4] Suhendi, Ulayya, M., Aeni, R., Dzahir, M., Maulida’ia, G., Prapanca, I.G.D.B., Fitri, R.L., Sopian, E., Wulandari, F., Dewik, L.D., Zain, M.I. (2022). Diversification of tempe products into tempe chips in East Kalijaga Village. Jurnal Pengabdian Magister Pendidikan IPA, 5(1): 259-264. https://doi.org/10.29303/jpmpi.v5i3
[5] Badan Pusat Statistik. (2024). Central Lombok in Figures. Statistical Centre Bureau. 1(1): 400 Praya. https://lomboktengahkab.bps.go.id/id/publication/2024/02/28/364e2cafc4e3498f9386f09a/kabupaten-lombok-tengah-dalam-angka-2024.html.
[6] Nansel, T.R., Schwedhelm, C., Lipsky, L.M., Faith, M.S., Siega-Riz, A.M. (2025). Socioeconomic characteristics and the home food environment are associated with feeding healthful and discretionary foods during the first year of life in the pregnancy eating attributes study. Journal of the Academy of Nutrition and Dietetics, 125(2): 228-238. https://doi.org/10.1016/j.jand.2024.05.011
[7] Tajidan, T., Halil, H., Fernandez, E., Efendy, E., Nabilah, S., Effendy. (2022). A cost-driven method for determining the optimum selling price in tofu production on the household-scale tofu agroindustry: A case study in Mataram, Indonesia. International Journal of Sustainable Development and Planning, 17(3): 1033-1039. https://doi.org/10.18280/ijsdp.170335
[8] Kitole, F.A. (2025). Impact of dairy farming extension programs on smallholder livestock keepers’ welfare among Maasai communities in Arusha, Tanzania. Preventive Veterinary Medicine, 239: 106511. https://doi.org/10.1016/j.prevetmed.2025.106511
[9] Rehberg, B., May, T., Heß, S., Kreienbrock, L. (2025). Evaluating slaughterhouse findings for lung and tail lesions in fattening pigs from secondary data. Preventive Veterinary Medicine, 238: 106469. https://doi.org/10.1016/j.prevetmed.2025.106469
[10] Costantini, V., Martini, C., Mina, B., Zoli, M. (2025). The welfare impact of climate action: A distributional analysis for Italy. Energy Economics, 143: 108181. https://doi.org/10.1016/j.eneco.2025.108181
[11] Ashkenazi, I., Katzman, J., Thomas, J., Davidovitch, R., Meftah, M., Schwarzkopf, R. (2024). Trends in revenue, cost, and contribution margin of patients who have a high comorbidity burden undergoing total hip arthroplasty from 2013 to 2021. The Journal of Arthroplasty, 39(9): 2188-2194. https://doi.org/10.1016/j.arth.2024.04.056
[12] Jubaedah, E. (2022). PT digantara Indonesia’s prospects base on break even point analysis. Scientific Journal of Management, Economics, & Accounting (MEA), 5(1): 1757-1767. https://doi.org/10.31955/mea.v5i1.1488
[13] Suriani, B., Sudirman, J., Mukarramah, S., Sabar, S., Saleng, H. (2021). Fermented soybean cake nugget (tempeh) as an alternative for increasing weight of little children aged 36-60 months. Gaceta Sanitaria, 35: S382-S384. https://doi.org/10.1016/j.gaceta.2021.10.056
[14] Wikström, G., Bledow, N., Matinmikko-Blue, M., Breuer, H., et al. (2024). Key value indicators: A framework for values-driven next-generation ICT solutions. Telecommunications Policy, 48(6): 102778. https://doi.org/10.1016/j.telpol.2024.102778
[15] Massacci, A., Ul-Durar, S., Arshed, N., Sharif, A. (2024). Climate change, environmental policies in the housing sector of Italy, and the impact on social welfare. Energy Economics, 108058. https://doi.org/10.1016/j.eneco.2024.108058
[16] Tajidan, T., Anas, Z., Amanda, A.P., Effendy, E., Zaenul, M. (2022). Sales expansion of agro-industrial products through e-commerce: A gender analysis approach. The Financial and Economic Feasibility Analysis: A Value-Added Approach, 17(2): 1-16. https://eprints.unram.ac.id/32747/.
[17] Tripuraneni, V., Robbins, P. (2024). Credit in agrarian India: Narrative policy struggles over farmer surplus. Geoforum, 155: 104081. https://doi.org/10.1016/j.geoforum.2024.104081
[18] Amirah, S.N., Sjah, T., Tajidan, T. (2024). Feasibility study analysis of tofu agro-industry business in Jonggat and Praya District, Central Lombok Regency. Journal Agrimasion, 25(1): 12-23. https://doi.org/10.29303/agrimansion.v25i1.1603
[19] Nguyen, D.V.M., Vu, A.T., Ross, V., Brijs, T., Wets, G., Brijs, K. (2025). Practical safety countermeasures for small-displacement motorcycle users in Vietnam: Findings from a focus group and in-depth interview study. Asian Transport Studies, 11(1): 100159. https://doi.org/10.1016/j.eastsj.2025.100159
[20] Rocha-Jiménez, T., Torres, I., Cabieses, B., López-Cevallos, D.F., Mercado-Órdenes, M. (2025). Intersectionality, racism, and mental health of migrants arriving at borders in Latin America: A qualitative study based on in-depth interviews with key informants of the cases of Ecuador and Chile. The Lancet Regional Health–Americas, 44: 101040. https://doi.org/10.1016/j.lana.2025.101040
[21] Kim, S., Kim, K.J., Hong, I.S. (2025). The basic data processing for KPLO gamma-ray spectrometer (KGRS). Acta Astronautica, 230: 139-147 https://doi.org/10.1016/j.actaastro.2025.02.018
[22] Schneider, M., Zolg, D.P., Samaras, P., Ben Fredj, S., et al. (2025). A scalable, web-based platform for proteomics data processing, result storage and analysis. Journal of Proteome Research, 24(3): 1241-1249. https://doi.org/10.1021/acs.jproteome.4c00871
[23] Zhang, C., Shen, S., Huang, H., Yu, S. (2025). An integrated data processing strategy for pavement modulus prediction using empirical mode decomposition techniques. Mechanical Systems and Signal Processing, 228: 112468. https://doi.org/10.1016/j.ymssp.2025.112468
[24] Yao, J.S., Wu, K. (1999). Consumer surplus and producer surplus for fuzzy demand and fuzzy supply. Fuzzy Sets and Systems, 103(3): 421-426. https://doi.org/10.1016/S0165-0114(97)00191-7
[25] Tajidan, Halil, Efendy, Fernandez, F.X.E., Usman, A., Jamil, M.H. (2021). Added value rentability of tofu agroindustry business in North Lombok Regency. IOP Conference Series: Earth and Environmental Science, 807(2): 022019. https://doi.org/10.1088/1755-1315/807/2/022019
[26] Besner, M. (2022). The grand surplus value and repeated cooperative cross-games with coalitional collaboration. Journal of Mathematical Economics, 102: 102764. https://doi.org/10.1016/j.jmateco.2022.102764
[27] Arthi, M.P., Gandhimathi, S.N.S. (2025). Research trends and network approach of critical thinking skills in English Language Teaching–A bibliometric analysis implementing R studio. Heliyon, 11(2): e42080. https://doi.org/10.1016/j.heliyon.2025.e42080
[28] Bonakdari, H., Noori, A., Morovati, K. (2025). Application of Microsoft Excel in multicriteria decision-making. In Multicriteria Decision-Making Analysis for Civil Engineering Applications. Woodhead Publishing, pp. 785-874. http://doi.org/10.1016/B978-0-443-22282-5.00011-5
[29] Rockström, J., Gupta, J., Qin, D., Ladeet, S.J., et al. (2023). Safe and just Earth system boundaries. Nature, 619: 102-111. https://doi.org/10.1038/s41586-023-06083-8
[30] Dusche, M. (2012). Development as freedom. In Identity Politics in India and Europe. New York: Oxford University Press. https://doi.org/10.4135/9788132108009.n31
[31] Rawls, J. (2014). A Theory of Justice. Belknap Press: An Imprint of Harvard University Press.
[32] Satria, M.A., Adawiyah, R., Kasymir, E. (2022). Income and welfare of tofu agroindustrial households at tofu industrial center in Gadingrejo Villag, Gadingrejo Sub District, Pringsewu Regency. Journal of Agribusiness Science, 10(3): 327-333. https://jurnal.fp.unila.ac.id/index.php/JIA/article/view/6019/pdf.
[33] Junita, D., Mukmin, A. (2022). The effect of education level and job placement on employee performance in DP3AP2KB in Bima Regency. Journal Management. 12(1): 96-108. https://doi.org/10.30738/jm.v12i1.3074
[34] Maudet, S., Brusse, T., Poss, B., Caro, G., Marrec, R. (2025). Estimating landscape intensity through farming practices: An integrative and flexible approach to modelling farming intensity from field to landscape. Ecological Modelling, 501: 110975. https://doi.org/10.1016/j.ecolmodel.2024.110975
[35] The Investopedia Team. (2024). Producer Surplus: Definition, Formula, and Example. Investopedia. https://www.investopedia.com/terms/p/producer_surplus.asp.
[36] Shilton, K. (2013). Values levers: Building ethics into design. Science, Technology, & Human Values, 38(3): 374-397. https://doi.org/10.1177/0162243912436985
[37] Kim, J.H. (2025). Comparison of predictive models for knee pain and analysis of individual and physical activity variables using interpretable machine learning. The Knee, 54: 146-153. https://doi.org/10.1016/j.knee.2025.02.006
[38] Shaikh, S., Gupta, A., Raj, V., Singh, A. (2025). Data-driven predictive models for evaluating optimum binder content and volumetric properties of bituminous mixtures using design variables. Measurement, 253: 117411. https://doi.org/10.1016/j.measurement.2025.117411
[39] Bales, A.M., Lock, A.L. (2024). Effects of raw and roasted high oleic soybeans on milk production of high-producing dairy cows. Journal of Dairy Science, 107(12): 10869-10881. https://doi.org/10.3168/jds.2024-25092
[40] Ahern, S., Browne, J., Murphy, A., Teljeur, C., Ryan, M. (2024). An economic evaluation and incremental analysis of the cost effectiveness of three universal childhood varicella vaccination strategies for Ireland. Vaccine, 42(14): 3321-3332. https://doi.org/10.1016/j.vaccine.2024.04.027
[41] Li, Y., Yang, Z., Li, K., Yang, C., et al. (2024). Two major rice loci determine rice-staple food populations differences in vitamin B1 deficiency levels. Science Bulletin. https://doi.org/10.1016/j.scib.2024.11.040