Meng Fan*![]() | Chokeanand Bussracumpakorn
| Chokeanand Bussracumpakorn![]()
© 2025 The authors. This article is published by IIETA and is licensed under the CC BY 4.0 license (http://creativecommons.org/licenses/by/4.0/).
OPEN ACCESS
The rapid transition toward sustainable packaging highlights the need to understand how external enablers drive value chain optimization (VCO) in emerging green industries. This study systematically examined the influence paths of industry collaboration networks (ICN) and policy support (PS) on the optimization of the sugarcane bagasse packaging value chain, focusing on the mediating roles of technology integration capability (TIC) and green innovation (GI), and the moderating effect of environmental responsiveness. Drawing on Resource-Based View (RBV), Collaborative Network Theory, and Institutional Theory, primary data were collected from 463 industry participants and analyzed using Partial Least Squares Structural Equation Modeling (PLS-SEM). Results indicated that ICN significantly enhance TIC (β = 0.593, p < 0.001) and GI (β = 0.256, p < 0.001), while PS more strongly promotes GI (β = 0.464, p < 0.001). Both technology integration (β = 0.338, p < 0.001) and GI (β = 0.416, p < 0.001) positively affect value chain optimization. Environmental responsiveness (ER) significantly moderated these relationships (β = 0.124 and 0.104, both p < 0.05), and mediation analyses confirmed both internal capabilities as key pathways. These findings clarified the mechanisms by which external collaboration and policy support optimize value chains through strengthening internal capabilities, with ER amplifying these effects. This research provided robust empirical evidence and actionable insights for advancing sustainable transformation in the agricultural by-product packaging sector.
industry collaboration network(ICN), policy support (PS), sugarcane bagasse packaging, value chain optimization(VCO), structural equation model (SEM)
1.1 Research background
The increasing demand to address global environmental issues like climate change, resource depletion, and ecosystem loss has intensified the innovation of sustainable industrial processes in all sectors. In this scenario, the traditionally petroleum-based packaging sector is being significantly transformed to achieve low-carbon and circular economy targets. Being one of the promising renewable commodities, sugarcane bagasse—the fiber remaining after sugar extraction—is receiving considerable attention for its potential to substitute conventional plastics in packaging. Particularly in the emerging economies with vast sugarcane production, namely China, Brazil, and India, the transformation of agricultural residues like bagasse into valuable and eco-friendly packaging solutions not only helps in reducing waste but also results in sustainable rural development and green industrial development [1, 2]. However, realizing the full potential of sugarcane bagasse packaging requires more than technological substitution; it demands comprehensive optimization of the entire value chain, encompassing raw material supply, manufacturing, product design, and market diffusion. Recent research suggests that external factors, such as industry collaboration networks (ICN) and policy support mechanisms, play crucial roles in shaping enterprise capabilities and facilitating sustainable innovations [3]. Nonetheless, empirical investigations into how these external enablers drive internal capability development—particularly technology integration and green innovation—and subsequently enhance value chain optimization remain limited, especially in the context of agricultural by-product packaging industries. Addressing this research gap, the present study integrated Resource-Based View (RBV), Collaborative Network Theory, and Institutional Theory to construct a conceptual framework that elucidates the dynamic mechanisms through which ICN and policy support (PS) influence value chain optimization (VCO) via the mediating roles of enterprise capabilities and the moderating role of environmental responsiveness. Focusing on the sugarcane bagasse packaging sector, this research sought to advance theoretical understanding and provide actionable insights for enterprises and policymakers striving to achieve sustainable and competitive value chain transformations.
1.2 Objectives of the study
The primary objective of this study was to systematically explore how external environmental enablers—namely ICN and PS—drive the optimization of the sugarcane bagasse packaging value chain through the development of internal enterprise capabilities. Specifically, the study aimed to construct and empirically validate a comprehensive conceptual framework that integrates RBV, Collaborative Network Theory, and Institutional Theory to explain the multi-layered pathways from external collaboration and institutional pressures to internal technological integration, green innovation enhancement, and ultimately, value chain optimization. By examining the mediating roles of TIC and green innovation (GI), as well as the moderating role of environmental responsiveness, the research sought to uncover the dynamic mechanisms through which firms transform external stimuli into sustainable competitive advantages. Furthermore, through rigorous empirical testing using Partial Least Squares Structural Equation Modeling (PLS-SEM), this study intended to provide both theoretical contributions to the fields of sustainable supply chain management and organizational capability development, and practical insights to guide enterprises, policymakers, and stakeholders in promoting sustainable industrial transformation in emerging sectors such as agricultural by-product packaging. Ultimately, this research aspired to bridge existing knowledge gaps, support the diffusion of eco-innovations, and enhance the ecological, economic, and social value of the sugarcane bagasse packaging industry.
1.3 Research significance
The research is important in that it has the potential to contribute to the growth of theoretical knowledge, practice, and policy development for sustainable value chain development in the novel field of agricultural by-product packaging. First, by combining the RBV, Collaborative Network Theory, and Institutional Theory, this research provides a comprehensive framework that explains systematically how external environmental enablers—ICN and PS—trigger internal firm capability development and, subsequently, VCO. This holistic approach not only enriches the theoretical foundation of sustainable supply chain management but also addresses the substantial research gap concerning the dynamic interaction between external drivers and internal resource development within the context of eco-innovation. Second, this research explores sugarcane bagasse packaging as a case study, gaining valuable insight into the processes underlying valorization of agricultural waste, technology enhancement, and green innovation development, thereby presenting a replicable model for other emerging green industries such as those associated with rice husk, wheat straw, and bamboo fiber packaging. Third, the implications of this research are of practical value to firms and policymakers interested in advancing low-carbon transitions and facilitating industrial development. Firms can leverage the uncovered channels to enhance technology integration and green innovation competences, while policymakers can formulate targeted support mechanisms to facilitate industry collaboration and eco-innovation systems. Overall, by addressing theory gaps and offering empirical validation, this study contributes to the advancement of sustainable industrial transformation, circular economy practices, and the establishment of high-value green industries from agro-industry by-products.
2.1 Theoretical foundation
2.1.1 Resource-Based View (RBV) and enterprise capabilities
RBV is a conceptual framework that determines the internal capabilities and resources of organizations as central to gaining sustainable competitive advantage and value creation. Founded on the seminal work of Barney [4] and Wernerfelt [5], the RBV holds that organizations with resources that are valuable, rare, inimitable, and non-substitutable (VRIN) have better performance consequences. Within the framework of developing sustainable value chains, the RBV holds that the application of technological and environmental innovations establishes essential internal capabilities. These capabilities are deemed strategic resources required to address competitive pressures and environmental concerns [6]. The TIC of a company refers to its ability to absorb, integrate, and implement new technological developments into its business model, thus working towards enhancing operational effectiveness, product quality, and responsiveness to market changes [7]. On the other hand, green innovation capability refers to the capacity of an organization to develop environmentally friendly products, processes, and practices that lead to ecological sustainability, as well as enabling market differentiation [8]. In the sugarcane bagasse packaging sector, they are the fundamental internal drivers converting external forces—policy incentive and cooperative industry networks—into concrete value chain performance enhancement. Thus, based on RBV, this research formulates a hypothesis that green technology integration and innovation are the mediators through which exogenous environmental drivers propel the value chain optimization of sugarcane bagasse packaging.
2.1.2 Collaborative Network Theory and industry coordination
Collaborative Network Theory focuses on the importance of organizational relations in achieving shared objectives, especially within the context of having complex and dynamic market settings. Following the contributions of Powell [9] and Provan and Kenis [10], the theory asserts that single organizations lack all the resources and abilities necessary for long-term evolution over time. Industry networks in partnership here perform a critical function as external drivers that facilitate the transfer of knowledge, technology, and best innovative practices across organizational boundaries. For sugarcane bagasse packaging, they allow organizations to break resource constraints, speed up the diffusion of green technologies, and provide cooperative solutions in sustainability management. To supplement RBV-required internal capabilities, the study employs Collaborative Network Theory in examining how the formation and density of industry networks externally influence technology integration and green innovation in order to advance value chain optimization.
2.1.3 Institutional Theory and policy support mechanisms
Institutional Theory provides insight into how external social, political, and regulatory forces shape enterprise behavior and strategic choices [11, 12]. In emerging industries, policy interventions—such as environmental regulations, subsidies, and technology promotion—create institutional pressures that can direct firms toward sustainable practices. Rather than reiterate internal capabilities, this perspective emphasizes how well-designed policy support mechanisms lower barriers to innovation, reduce uncertainty, and legitimize eco-friendly initiatives. Within this framework, the study investigates how policy support, as an institutional force, influences enterprises’ ability to build and deploy the technological and innovative capacities described by RBV, thus indirectly driving VCO.
Although this study draws on RBV, Collaborative Network Theory, and Institutional Theory, these perspectives are not treated as isolated frameworks. Rather, their integration provides a comprehensive analytical lens for explaining how external drivers (industry collaboration, policy support) interact with internal capabilities (technology integration, green innovation) to optimize the value chain. This approach addresses the complex, multi-dimensional nature of sustainable transformation in emerging industries and prevents the analysis from becoming too diffuse.
2.2 Industry Collaboration Network and policy support
ICN and PS represent two critical external enablers that shape enterprise capabilities, particularly TIC and GI [13]. Collaborative networks allow firms to access external knowledge, technologies, and complementary resources that are otherwise unattainable internally [14]. Through partnerships with suppliers, customers, research institutions, and government agencies, firms embedded in strong industry networks can accelerate technological adoption and improve their capacity for integrating cutting-edge technologies into their operational systems [15]. This inter-organizational cooperation not only reduces transaction costs and innovation risks but also fosters shared learning and technological upgrading, thereby enhancing TIC [16]. In addition, networks of collaboration are essential channels for the development of green innovation through the diffusion of environmentally friendly practices, eco-friendly materials, and joint creation of sustainable solutions. Firms participating in industry collaborations are more likely to leverage shared knowledge and external capabilities to initiate and sustain programs for developing green innovation [17].
Meanwhile, policy support mechanisms are key external drivers that motivate corporations to strengthen their technological and environmental competences [18]. State-funded financial assistance, environmental legislation, innovation subsidies, and environmental certification schemes provide institutional pressures and incentives that lead companies to embrace innovative technologies and sustainable practices [19]. Policy assistance removes the financial and technological risks of technology adoption so that businesses can invest more in their internal processes and systems [20]. Furthermore, well-structured policy frameworks support green innovation by endorsing environmental activities, providing technical assistance, and preparing good market conditions for eco-innovative products and services [21]. In emerging industries such as sugarcane bagasse packaging, where there is development of technological readiness and market institutions, the co-presence of collaboration networks along with policy support is vital in leveraging the internal capabilities to drive sustainable advancement in the value chain. But existing literature has yielded ambiguous evidence concerning the efficacy of these external facilitators under varying circumstances. There is some work that emphasizes the leading role that policy support has in stimulating innovation, particularly in highly regulated industries [19], and other work that pinpoints that the effects of industry partnerships are dependent upon a firm's absorptive capacity as well as the phase of its network evolution [14, 15]. Also, there is contention regarding the specific functioning of these mechanisms in new industries, e.g., the processing of farm by-products, where network and institutional forces cross-fertilize one another with intricate results. This calls for more empirical research and comparison across contexts.
Thus, this research posits the following hypotheses:
H1: ICN has a positive effect on the enterprise’s TIC.
H2: ICN has a positive effect on the enterprise’s GI.
H3: PS has a positive effect on the enterprise’s TIC.
H4: PS has a positive effect on the enterprise’s GI.
2.3 Enterprise capabilities: Technology integration and green innovation
An enterprise's technologies, particularly the technology integration capacity (TIC) and GI, are the key enablers that enable the optimization of sustainable VCO [22]. Technology integration capacity refers to the ability of the company to incorporate, coordinate, and effectively apply new technologies into its business operations, thereby achieving production efficiency, product quality, responsiveness to market demand, and environmental awareness enhancements [23]. By maximizing the integration of technology, organizations can maximize their effectiveness in operations, minimize resource consumption, and develop best practices that maximize competitiveness and value chain sustainability [24]. GI—evidenced in the discovery and adoption of environment-friendly products, processes, and business models—is also maximizing the value chain potential by combining environmental responsibility with economic efficiency [25]. Firms that proactively undertake green innovation are able to decrease their environmental footprints, establish green market niches, and differentiate themselves from competitors, and thus gain both environmental advantage and sustainable business success [26]. For firms in new industries like sugarcane bagasse packaging, where the application of eco-friendly materials and processes is paramount, the simultaneous development of technology integration and green innovation is a strategic approach to value chain performance improvement. Nevertheless, prior research shows varying conclusions regarding the relative importance and interaction of these two capabilities. Certain research indicates the incorporation of technology as the fundamental source of increased performance in conventional manufacturing industries [23], while other research highlights the emerging function of green innovation in environmental or new sectors [25, 26]. Secondly, the combined effect of TIC and GI has yet to be researched adequately, particularly with regards to packaging of agricultural by-products, where characteristics of the industry might influence their interaction. This imbalance in existing literature is the reason that further empirical research and cross-sector analysis are necessary.
Therefore, this study formulates the following hypotheses:
H5: TIC has a positive effect on VCO.
H6: GI has a positive effect on VCO.
2.4 The moderating role of environmental responsiveness
Environmental responsiveness (ER) has been described as a firm's proactive awareness and capability to respond to environmental concerns, regulatory demands, and stakeholder expectations [27]. In the context of sustainable VCO, ER is an important moderating factor that can strengthen or weaken the effect of internal organizational competencies on value chain performance [28]. Firms that are more environmentally proactive will view external environmental pressures as opportunities, not threats, and therefore will conduct activities such as innovation, organizational restructuring, and optimization of their activities in alignment with sustainable objectives [29]. Strong technological integration capability (TIC) in organizations can have positive implications for technological transformation through enhanced environmental responsiveness [30]. This level of responsiveness helps to map the embedded technology to goals like eco-efficiency, conservation of resources, and the shift to low-carbon options, thus enabling further improvements along the value chain [31]. Similarly, GI programs, though inherently sustainability-driven, can be even more successful in their role towards value chain streamlining when aligned with high environmental responsiveness because, by possessing a higher ability to connect the outputs of innovation with environmental needs, market needs, and social pressures, firms stand a better chance to capitalize on such innovation initiatives [32]. Consequently, firms with high environmental responsiveness are more likely to reap the maximum advantages of both technology integration and green innovation to improve their value chain sustainability and competitiveness considerably. However, existing studies report inconsistent findings on the moderating effect of environmental responsiveness. While some research suggests that ER consistently strengthens the positive impacts of technology integration and green innovation [31], others find the effect to be context-dependent or insignificant in certain industries [27]. Such discrepancies highlight the necessity for further empirical investigation, particularly in the emerging field of agricultural by-product packaging.
Therefore, this study proposes the following hypotheses:
H7: ER positively moderates the relationship between TIC and VCO.
H8: ER positively moderates the relationship between GI and VCO.
2.5 The mediating mechanisms of technology integration and green innovation
In sustaining VCO key organizational competencies such as TIC and GI are not only direct drivers but also mediating variables that facilitate the translation of external environmental pressures into operational and strategic change [33]. Specifically, ICN and PS are essential external drivers; however, their primary contribution to VCO is the cultivation of internal capabilities [34]. Where firms are strongly embedded in ICN, they are able to tap into external knowledge, emerging technologies at their embryonic stage, and innovative methods that can be efficiently absorbed and integrated through their technology integration capabilities [35]. The internalization process enables firms to reconfigure their activities in the value chain, thereby enhancing ecological efficiency and competitive operations. Technology-Intensive Collaboration (TIC) is therefore a significant mediator connecting Innovation Capability Networks (ICN) and Value Creation Outcomes (VCO). In the same way, policy support comprising financial incentives, regulation demands, and technical assistance enables firms' technological advancement and capacity development [36]. Those that use policy incentives to improve their TIC have greater potential to optimize their value chains, indicating a positive mediating effect of TIC on the PS-VCO relationship [37]. GI is another crucial mediating pathway. Industry cooperation networks create cooperative platforms for joint green product development, green material innovation, and low-carbon logistics solutions, which are translated into specific value chain improvements through green innovation activities [38].
Therefore, GI mediates the relationship between ICN and VCO by enabling firms to implement environmental innovations across value chain stages [39]. Furthermore, policy support legitimizes and incentivizes green practices, encouraging enterprises to invest in eco-innovations [40]. As firms enhance their green innovation capabilities in response to policy frameworks, they are able to embed sustainability more deeply into their value chain operations, thereby mediating the impact of PS on VCO [39]. While numerous studies support the mediating roles of technology integration and green innovation between external drivers and value chain outcomes [35, 36], others question the universality of these mechanisms. Some research suggests that the strength and even presence of these mediating effects may vary significantly across industries and organizational contexts, and may depend on factors such as firm size, absorptive capacity, or sectoral technological maturity [38, 40]. This inconsistency underscores the need for sector-specific empirical validation, particularly in emerging fields like agricultural by-product packaging, where the mechanisms may be less established or behave differently.
Taken together, technology integration and green innovation act as pivotal internal mechanisms that bridge external collaborative and institutional influences with enterprise-level sustainable value chain transformations. Accordingly, this study proposes the following hypotheses:
H9: TIC positively mediates the relationship between ICN and VCO.
H10: TIC positively mediates the relationship between PS and VCO.
H11: GI positively mediates the relationship between ICN and VCO.
H12: GI positively mediates the relationship between PS and VCO.
2.6 Research gaps and development of conceptual model
Despite the growing body of research on sustainable packaging and value chain optimization, there are still significant theoretical and empirical gaps. First, most existing studies tend to analyze ICN or PS in isolation, and systematic research exploring how these two external enablers jointly enhance firms’ internal capabilities remains rare. Second, although TIC and GI are widely recognized as core internal drivers for sustainable development, there is a lack of empirical studies that rigorously examine their joint mediating effects in the pathways linking external factors to value chain optimization—especially in emerging fields such as agricultural by-product packaging. Furthermore, the current literature offers inconsistent conclusions regarding the interactions and relative importance of external networks, policy support, internal capabilities, and ER, with few comparative analyses across industries or specific contexts. Notably, the moderating role of ER in influencing the relationship between internal capabilities and value chain optimization remains underexplored, with little empirical evidence available, particularly in new and emerging industries.
To address these research gaps, this study develops an integrated conceptual model based on the RBV, Collaborative Network Theory, and Institutional Theory (Figure 1). The model positions ICN and PS as key external enabling factors that promote value chain optimization by strengthening firms’ technology integration and green innovation capabilities. Meanwhile, ER is incorporated as a moderator to examine its effects on the paths from technology integration and green innovation to value chain optimization. Unlike prior studies that treat these theories separately, the present research organically integrates multiple theoretical perspectives to comprehensively reveal the mechanisms through which external environments and internal capabilities interact to drive sustainable value chain optimization in emerging industries. This model not only provides a solid theoretical foundation for subsequent empirical analysis but also offers systematic guidance for policymaking and enterprise management practices.
Figure 1. Conceptual model linking industry collaboration, policy support, enterprise capabilities, and value chain optimization
3.1 Research design and methodological approach
This study adopted a quantitative empirical research design to investigate the influence pathways linking ICN and PS to VCO through internal enterprise capabilities. Following a positivist epistemological stance, a structured questionnaire survey was employed to collect primary data from manufacturing enterprises involved in the sugarcane bagasse packaging sector. The research framework, which was grounded in RBV, Collaborative Network Theory, and Institutional Theory, necessitated the examination of multiple interrelated constructs and complex causal relationships, making Structural Equation Modeling (SEM) the most appropriate analytical method. Specifically, this study utilized the PLS-SEM approach due to its advantages in handling complex models, accommodating non-normal data distributions, and providing robust estimations even with moderate sample sizes. Hypothesis testing and model estimation were undertaken using SmartPLS 4.0 software. The process of research involved several key steps: development of initial conceptual model and hypotheses according to theoretical bases, latent construct measurement into observable items through in-depth literature review, questionnaire was created and calibrated via expert consultation and pre-testing, and mass survey was distributed for collecting valid responses. Data analysis was carried out in a two-step approach: the measurement model was tested first to provide reliability and validity, followed by structural model testing to test hypothesized relationships, mediation, and moderation effects. The design of the methodology in this way ensured methodological soundness along with empirical power, allowing the study to probe the dynamic processes through which external collaboration and institution environments affect internal capability development and sustainable value chain optimization in a structured way.
3.2 Measurement development and questionnaire design
In order to operationalize the latent constructs in the suggested conceptual framework, the present study developed a systematic questionnaire based on the available literature and adapted scales to fit the context of the sugarcane bagasse packaging business. Each construct was assessed through multi-item scales, wherein each item was rated on a seven-point Likert scale, ranging from 1 (strongly disagree) to 7 (strongly agree). Specifically, the concept of ICN was measured with eight items assessing the firm's collaboration with supply chain partners, research institutions, and industry associations, drawing on collaborative network theory literature. PS was measured with eight items assessing government incentives, technical support, regulatory climates, and access to subsidies, drawing on institutional theory literature. The ability of technology integration (TIC) was tested via eight separate items that measure the organization's ability to absorb and integrate different technologies into the bagasse packaging production processes. At the same time, GI was tested using eight items that highlight the company's efforts to develop eco-friendly products, apply clean technologies, and cultivate sustainable innovation practices. ER was quantified using eight indicators that assess the awareness and adaptive actions of the organization to environmental regulations, market volatility, and stakeholder expectations. VCO was also assessed using eight metrics based on operational efficiency, cost savings, effective utilization of resources, market competitiveness, and product quality enhancement as a result of using bagasse materials. The survey was initially piloted to industry practitioners and content experts in the area of green packaging to obtain content validity, clarity, and applicability. Minor wording adjustments were done on aspects following comments for better understanding of the items as well as industry practice relevance. The resulting final measurement items for each construct were presented in Table 1. This rigorous development process for measurement guarantees the reliability, validity, and theoretical relevance of the questionnaire, thereby laying a strong basis for subsequent empirical research.
3.3 Data collection and sample description
This study employed a structured questionnaire survey to collect primary data from employees and managers of enterprises involved in the sugarcane bagasse packaging value chain. The respondents covered various functional roles within the value chain, including raw material supply, manufacturing, product design, and sales and distribution. Given the specialized nature of the target population and the difficulty in access, a non-probability convenience sampling method was adopted for sample selection. Data collection was conducted online from January to April 2025. Prior to the large-scale survey, a pilot test involving 30 participants was carried out to verify the clarity and reliability of the questionnaire items, and minor wording adjustments were made based on the feedback.
A total of 500 questionnaires were distributed, and 480 were returned, resulting in a response rate of 96%. After data screening, which involved removing invalid and incomplete responses, 463 valid questionnaires were retained for subsequent analysis. The criteria for valid samples included complete responses to key sections of the questionnaire and a reasonable completion time. The final sample covered a wide range of enterprise sizes and respondent backgrounds, ensuring the breadth and representativeness necessary to provide a robust empirical foundation for the SEM analysis.
Table 1. Construct measurement scales
|
Item Statement |
|
|
ICN-1: Our company maintains close cooperation with other firms in the sugarcane bagasse packaging value chain. |
|
ICN-2: Our company actively participates in industry cooperation projects and research activities. |
|
ICN-3: Our company has effective information-sharing mechanisms with suppliers. |
|
ICN-4: Our company maintains good communication and cooperation with customers. |
|
ICN-5: Our company participates in activities organized by industry associations or alliances. |
|
ICN-6: Our company collaborates with research institutions related to bagasse processing. |
|
ICN-7: Our company jointly solves technical problems with value chain partners. |
|
ICN-8: Our company accesses valuable resources and information through the collaboration network. |
|
|
PS-1: The government has introduced special policies to support the development of the sugarcane bagasse packaging industry. |
|
PS-2: Our company can obtain government subsidies or tax incentives. |
|
PS-3: The government provides technical support and guidance for sugarcane bagasse packaging enterprises. |
|
PS-4: The government has built platforms for inter-enterprise communication and cooperation. |
|
PS-5: The government financially supports research and innovation in bagasse materials. |
|
PS-6: Local governments have enacted regulations to promote bagasse resource utilization. |
|
PS-7: Incentive measures exist for companies using eco-friendly materials. |
|
PS-8: Our company can promptly obtain policy updates related to sugarcane bagasse packaging. |
|
|
TIC-1: Our company effectively integrates different technologies into sugarcane bagasse packaging production. |
|
TIC-2: Our company incorporates new technologies into existing production processes. |
|
TIC-3: Our technical staff are proficient in multiple bagasse processing technologies. |
|
TIC-4: Our company effectively combines technological knowledge from different sources. |
|
TIC-5: Our company is capable of technological innovation and improvement. |
|
TIC-6: Our company holds patents or proprietary technologies in bagasse packaging. |
|
TIC-7: Our company rapidly learns and absorbs external advanced technologies. |
|
TIC-8: Our departments collaborate smoothly in technology R&D and application. |
|
|
GI-1: Our company focuses on developing eco-friendly sugarcane bagasse packaging products. |
|
GI-2: Our company actively adopts clean production technologies. |
|
GI-3: Our company continuously improves packaging design to reduce material use and environmental impact. |
|
GI-4: Our company invests resources in developing biodegradable sugarcane bagasse materials. |
|
GI-5: Our company considers environmental impacts across the full product lifecycle. |
|
GI-6: Our company encourages employees to propose green innovation ideas. |
|
GI-7: Our company jointly promotes green packaging innovation with partners. |
|
GI-8: Our company's green innovation activities have achieved substantial results. |
|
|
ER-1: Our company responds promptly to changes in environmental policies. |
|
ER-2: Our company closely monitors shifts in consumer demand for eco-friendly packaging. |
|
ER-3: Our company quickly adjusts production strategies to comply with environmental regulations. |
|
ER-4: Our company stays highly sensitive to environmental technology developments. |
|
ER-5: Our company effectively copes with environmental pressures. |
|
ER-6: Our company has the ability to identify and manage environmental risks. |
|
ER-7: Our company proactively takes measures to reduce environmental impact. |
|
ER-8: Our company's environmental investment matches external environmental requirements. |
|
|
VCO-1: Our sugarcane bagasse packaging products have strong market competitiveness. |
|
VCO-2: Our company has reduced production costs by using sugarcane bagasse materials. |
|
VCO-3: Our sugarcane bagasse packaging value chain operates efficiently. |
|
VCO-4: Our company provides high-quality sugarcane bagasse packaging products to customers. |
|
VCO-5: Our sugarcane bagasse products have gained market recognition. |
|
VCO-6: Our company improves resource utilization through value chain optimization. |
|
VCO-7: Our company creates high added value within the sugarcane bagasse value chain. |
|
VCO-8: Our sugarcane bagasse value chain operates with good overall coordination. |
The use of a non-probability convenience sampling method was primarily driven by the specialized and difficult-to-access nature of the target population in the sugarcane bagasse packaging industry. While this approach facilitated efficient data collection from relevant respondents, it inherently restricts the generalizability of the findings. The external validity of the study is therefore limited, and the results may not be fully representative of all enterprises in the sector or in other regions. Although efforts were made to maximize diversity in terms of firm size, ownership, and value chain position, we caution that the use of convenience sampling means results should be interpreted with care regarding broad population inferences. To partially mitigate the issue of representativeness, the sample was diversified to include respondents from different enterprise sizes and value chain functions. Nevertheless, we recommend that future studies employ probability sampling techniques or multi-region comparative surveys to enhance the robustness and generalizability of research conclusions.
3.4 Data analysis strategy
In order to further examine the hypothesized relationships of the theoretical model, the present research utilized PLS-SEM as the major method of data analysis, with SmartPLS 4.0 software being applied. PLS-SEM use was justified by its superiority in handling complicated models with several latent variables, by its insensitivity to non-normal data distribution, and by being appropriate for both exploratory and predictive research aims. The research followed a sequential two-step process: initially, the measurement model was examined to provide reliability, convergent validity, and discriminant validity of the constructs through indicators like Cronbach's alpha, composite reliability (CR), average variance extracted (AVE), the Fornell-Larcker criterion, and the Heterotrait–Monotrait ratio (HTMT). Following the confirmation of the measurement model adequacy, the structural model was examined to test the hypothesized hypotheses. Structural model evaluation included analysis of path coefficients, threshold significance (via bootstrapping with 10,000 resamples), and effect sizes (f²) to establish the strength and significance of construct relations. Moderation and mediation effects were also tested to validate the proposed moderating role of ER and the mediating roles of TIC and GI. Furthermore, to enhance the methodological rigor, the study conducted preliminary tests for multivariate normality using Mardia’s coefficients and assessed common method bias (CMB) through the full collinearity test. Finally, the predictive performance of the model was evaluated using the PLS-Predict procedure to ensure that the structural model not only fit the sample data but also possessed out-of-sample predictive relevance. This comprehensive analysis strategy ensured the validity, reliability, and practical applicability of the empirical findings.
4.1 Descriptive statistics
This study collected 463 valid responses from employees and managers involved in the sugarcane bagasse packaging value chain (Table 2). The demographic profile of the respondents indicated that 56.6% were male and 43.4% were female. In terms of age distribution, the majority of participants were between 31 and 40 years old (47.5%), followed by those aged 30 years and below (23.3%), 41 to 50 years old (20.1%), and 51 years and above (9.1%). Regarding educational attainment, nearly half of the respondents (49.9%) held a bachelor's degree, while 26.6% had a diploma, 17.5% had a high school education or lower, and 6% had a master's degree or higher. With respect to enterprise size, 55.7% of the participants were from medium-sized enterprises (51–300 employees), 27.6% from small enterprises (fewer than 50 employees), and 16.6% from large enterprises (more than 300 employees). In terms of organizational position, 60.7% of the respondents were general staff, 31.7% were at the middle management level, and 7.6% were senior managers. For the length of involvement in the sugarcane bagasse packaging value chain, 33% had 3–5 years of experience, 28.9% had 6–10 years, 27% had less than 3 years, and 11% had more than 10 years of experience. Furthermore, regarding their roles in the value chain, 68.9% of respondents were engaged in processing and manufacturing activities, 56.4% participated in raw material supply, 45.8% were involved in product design, and 30.9% were engaged in sales and distribution, indicating that many participants played multiple roles across different value chain segments. Descriptive statistics for the main constructs showed that the mean scores for ICN, PS, TIC, GI, ER, and VCO were relatively high, ranging from 4.858 to 5.044 on a 7-point scale (Table 3), suggesting that respondents generally perceived favorable conditions regarding external collaboration, policy environments, internal capabilities, environmental responsiveness, and value chain outcomes. The standard deviations ranged between 1.110 and 1.304, indicating moderate variability across responses. Overall, the demographic distribution and descriptive analysis results demonstrated that the sample possesses considerable diversity in background characteristics and experience levels, providing a robust empirical foundation for subsequent SEM analysis.
4.2 Preliminary data diagnostics
4.2.1 Normality test
Before conducting SEM, it is essential to assess whether the dataset meets the assumption of multivariate normality, which informs the suitability of the chosen modeling technique. Although PLS-SEM is known for its flexibility with non-normally distributed data, explicitly testing for normality helps justify the methodological rigor and appropriateness of model selection. In line with Cain et al. [52] and Hair et al. [53] recommendations, the present study used Mardia’s multivariate skewness and kurtosis tests to assess the distributional features of the data. The sample consisted of 463 cases across six variables. Mardia’s test results showed a statistically significant value of 15.265 for multivariate skewness (p < 0.01) and 76.322 for multivariate kurtosis (p < 0.01). These findings suggested a clear departure from multivariate normality. The results support the use of PLS-SEM, which is robust and insensitive to violations of normality—common in actual survey data. Thus, the confirmation of non-normality provided a strong methodological justification for employing PLS-SEM in the subsequent path and mediation analyses.
Table 2. Demographic profile of respondents
|
Category |
Classification |
Frequency |
Percentage (%) |
|
Gender |
Male |
262 |
56.6 |
|
|
Female |
201 |
43.4 |
|
Age |
30 years and below |
108 |
23.3 |
|
|
31–40 years |
220 |
47.5 |
|
|
41–50 years |
93 |
20.1 |
|
|
51 years and above |
42 |
9.1 |
|
Educational Level |
High school/vocational or below |
81 |
17.5 |
|
|
Diploma |
123 |
26.6 |
|
|
Bachelor's degree |
231 |
49.9 |
|
|
Master's degree or above |
28 |
6 |
|
Enterprise Size |
Small (fewer than 50 employees) |
128 |
27.6 |
|
|
Medium (51–300 employees) |
258 |
55.7 |
|
|
Large (more than 300 employees) |
77 |
16.6 |
|
Position |
General staff |
281 |
60.7 |
|
|
Middle management |
147 |
31.7 |
|
|
Senior management |
35 |
7.6 |
|
Years Involved in the Value Chain |
Less than 3 years |
125 |
27 |
|
|
3–5 years |
153 |
33 |
|
|
6–10 years |
134 |
28.9 |
|
|
More than 10 years |
51 |
11 |
Table 3. Descriptive statistics of main variable (N=463)
|
Variable |
Minimum |
Maximum |
Mean |
Std. Deviation |
|
ICN |
1.000 |
6.750 |
4.926 |
1.110 |
|
PS |
1.250 |
6.880 |
4.910 |
1.304 |
|
TIC |
1.000 |
6.750 |
5.044 |
1.121 |
|
GI |
1.000 |
6.750 |
4.858 |
1.181 |
|
ER |
1.000 |
6.880 |
4.883 |
1.152 |
|
VCO |
1.250 |
6.880 |
4.936 |
1.262 |
4.2.2 Common method bias test
Since all the data in the study were gathered from the same participants using the same questionnaire once, the possibility of common method bias (CMB) cannot be dismissed. To ensure the accuracy of model estimation, the full collinearity check procedure suggested by Kock and Lynn [54] was employed in the present study. This procedure, grounded in the PLS-SEM framework, involves introducing a dummy latent variable to which all the constructs are regressed. Variance inflation factors (VIFs) are then calculated for each construct. A VIF value greater than 3.3 indicates potential multicollinearity or overlapping measurement errors, suggesting a concern regarding common method bias (CMB). Six latent constructs—ICN, PS, TIC, GI, ER, and VCO—were regressed against the dummy latent variable. The resulting VIF values for all constructs were below the threshold of 3.3, as illustrated in Table 4. These results indicate that no significant common method bias was present in the data, thereby supporting the validity of the measurements and the structural model. The absence of CMB enhances the interpretability and credibility of the empirical findings in subsequent analyses.
Table 4. Full collinearity testing
|
Variable |
ICN |
PS |
TIC |
GI |
ER |
VCO |
|
VIF |
2.166 |
1.819 |
2.192 |
2.163 |
1.518 |
2.099 |
4.3 Measurement model evaluation
In order to ensure the statistical validity of the SEM, the measurement model was assessed systematically in this section by examining reliability and validity indicators. PLS-SEM with the aid of SmartPLS 4.0 was employed to evaluate the six core latent variables based on three dimensions: internal consistency reliability, convergent validity, and discriminant validity.
4.3.1 Reliability and convergent validity
Reliability testing checks the stability and consistency of the measures to constructs, typically measured in terms of Cronbach's Alpha and Composite Reliability (CR). Following Hair et al.'s [53] recommendations, a value above 0.70 for both indicators suggests that there is sufficient internal consistency reliability. Convergent validity is the degree to which a construct explains variance observed in its related indicators. It is assessed using factor loadings and Average Variance Extracted (AVE). A loading of above 0.70 and AVE of more than 0.50 is said to reflect adequate convergence of the measures.
As depicted in Table 5, all six constructs had Cronbach's Alpha values between 0.889 and 0.933 and corresponding Composite Reliability (CR) between 0.911 and 0.945, both well above the 0.70 benchmark suggested by Hair et al. [53], pointing towards good internal consistency reliability.
Standardized factor loadings of all measurement items were greater than 0.70, demonstrating strong correlations among items and their respective constructs. Furthermore, the AVE values of constructs ranged from 0.563 to 0.681, which are far greater than the minimum criterion value of 0.50 and thus indicate the existence of strong convergent validity. It should be noted that the AVE value for ICN is 0.563, which, while close to the lower threshold, still exceeds the widely accepted benchmark of 0.50 as suggested by Fornell and Larcker [55] and Hair et al. [53]. According to these authorities, AVE values above 0.50 are considered acceptable and reflect adequate convergent validity, even if they are relatively modest. Therefore, the convergent validity of ICN can be regarded as sufficient for further analysis. These accumulated findings confirm that the measurement model possesses high internal reliability, correct construct representation, and adequate measurement properties, establishing a solid foundation for the subsequent structural model analysis.
Table 5. Reliability and convergent validity of constructs
|
Variable |
Item |
Factor Loading |
Cronbach's Alpha |
CR |
AVE |
|
ER |
ER1 |
0.767 |
0.912 |
0.929 |
0.620 |
|
ER2 |
0.782 |
||||
|
ER3 |
0.809 |
||||
|
ER4 |
0.785 |
||||
|
ER5 |
0.781 |
||||
|
ER6 |
0.749 |
||||
|
ER7 |
0.805 |
||||
|
ER8 |
0.817 |
||||
|
GI |
GI1 |
0.780 |
0.917 |
0.932 |
0.634 |
|
GI2 |
0.809 |
||||
|
GI3 |
0.827 |
||||
|
GI4 |
0.799 |
||||
|
GI5 |
0.798 |
||||
|
GI6 |
0.727 |
||||
|
GI7 |
0.816 |
||||
|
GI8 |
0.809 |
||||
|
ICN |
ICN1 |
0.775 |
0.889 |
0.911 |
0.563 |
|
ICN2 |
0.776 |
||||
|
ICN3 |
0.747 |
||||
|
ICN4 |
0.709 |
||||
|
ICN5 |
0.705 |
||||
|
ICN6 |
0.714 |
||||
|
ICN7 |
0.782 |
||||
|
ICN8 |
0.789 |
||||
|
PS |
PS1 |
0.826 |
0.933 |
0.945 |
0.681 |
|
PS2 |
0.857 |
||||
|
PS3 |
0.855 |
||||
|
PS4 |
0.847 |
||||
|
PS5 |
0.758 |
||||
|
PS6 |
0.825 |
||||
|
PS7 |
0.834 |
||||
|
PS8 |
0.796 |
||||
|
TIC |
TIC1 |
0.777 |
0.897 |
0.917 |
0.581 |
|
TIC2 |
0.794 |
||||
|
TIC3 |
0.746 |
||||
|
TIC4 |
0.745 |
||||
|
TIC5 |
0.743 |
||||
|
TIC6 |
0.713 |
||||
|
TIC7 |
0.777 |
||||
|
TIC8 |
0.799 |
||||
|
VCO |
VCO1 |
0.810 |
0.927 |
0.940 |
0.661 |
|
VCO2 |
0.853 |
||||
|
VCO3 |
0.831 |
||||
|
VCO4 |
0.833 |
||||
|
VCO5 |
0.753 |
||||
|
VCO6 |
0.817 |
||||
|
VCO7 |
0.826 |
||||
|
VCO8 |
0.777 |
4.3.2 Discriminant validity: Fornell–Larcker and HTMT
Table 6. Fornell-Larcker discriminant validity test results
|
|
ER |
GI |
ICN |
PS |
TIC |
VCO |
|
ER |
0.787 |
|
|
|
|
|
|
GI |
0.431 |
0.796 |
|
|
|
|
|
ICN |
0.375 |
0.515 |
0.751 |
|
|
|
|
PS |
0.320 |
0.607 |
0.557 |
0.825 |
|
|
|
TIC |
0.474 |
0.439 |
0.668 |
0.465 |
0.762 |
|
|
VCO |
0.543 |
0.613 |
0.491 |
0.418 |
0.566 |
0.813 |
Discriminant validity represents the extent to which there are statistical differences between latent constructs, in a way that each construct is measuring a different concept without significant overlap with other constructs. In order to raise the measurement model's strength, discriminant validity was examined based on the Fornell–Larcker criterion and the Heterotrait–Monotrait ratio (HTMT). According to Fornell and Larcker [55], a construct demonstrates sufficient discriminant validity if the square root of its Average Variance Extracted (AVE) is larger than the correlations it has with other constructs. As evident in Table 6, the square roots of AVE (diagonal symbols) of all constructs are larger than their corresponding inter-construct correlations, thereby demonstrating a reasonable conceptual distinction and absence of overlap. Apart from that, to further establish discriminant validity, the HTMT approach suggested by Henseler et al. [56] was used. HTMT measures the ratio of between-construct correlations to within-construct correlations, where the generally used cut-off of 0.90 (even a more conservative 0.85) is accepted. Since in Table 7 all HTMT values among the constructs are below the 0.90 cut-off, sufficient discriminant validity is found. The combined findings achieved via the Fornell–Larcker criterion along with the HTMT analysis substantiate the claim that the measurement model has strong discriminant validity, thus verifying the reliability and transparency of the structural model and the ensuing path analyses.
Table 7. HTMT discriminant validity test results
|
|
ER |
GI |
ICN |
PS |
TIC |
VCO |
|
ER |
|
|
|
|
|
|
|
GI |
0.471 |
|
|
|
|
|
|
ICN |
0.415 |
0.569 |
|
|
|
|
|
PS |
0.345 |
0.655 |
0.608 |
|
|
|
|
TIC |
0.524 |
0.483 |
0.746 |
0.502 |
|
|
|
VCO |
0.584 |
0.663 |
0.540 |
0.449 |
0.617 |
|
4.4 Structural model results
This section presents and interprets the results of the structural model estimated using the PLS-SEM approach. The evaluation includes the estimation of path coefficients, hypothesis testing, and effect size (f²) analysis, aiming to validate the causal relationships among latent constructs and assess the relative influence of each path. Significance testing for all path coefficients was performed using SmartPLS 4.0, applying a bootstrapping procedure with 10,000 resamples to ensure robust inference.
4.4.1 Path coefficients and hypothesis testing
As illustrated in Figure 2 and detailed in Table 8, all six direct effect hypotheses (H1–H6) received statistical support, indicating significant positive relationships among ICN, PS, TIC, GI, and VCO.
Within the structural model, the ICN demonstrated a highly significant positive impact on TIC (β = 0.593, p < 0.001), strongly supporting H1. ICN also exerted a significant positive effect on GI (β = 0.256, p < 0.001), validating H2. These results indicate that enhancing ICN substantially promotes both the technological integration and green innovation activities of enterprises.
PS exhibited a positive influence on TIC (β = 0.135, p = 0.003), supporting H3, and a notably strong positive impact on GI (β = 0.464, p < 0.001), supporting H4. This finding suggests that government or institutional support mechanisms play a critical role in fostering enterprises' technological adoption and green development.
Regarding the downstream effects, TIC had a significant positive impact on VCO (β = 0.338, p < 0.001), confirming H5. Similarly, GI significantly promoted VCO (β = 0.416, p < 0.001), validating H6. These results imply that both technological integration and green innovation are essential drivers for optimizing the ecological and economic performance of value chains.
Figure 2. SEM analysis results
Table 8. Direct path relationship test results
|
Relationships |
Std.Beta |
Std.Dev |
T-Value |
P-Value |
PCI LL |
PCI UL |
f2 |
Effect Size |
|
H1: ICN -> TIC |
0.593 |
0.047 |
12.511 |
0.000 |
0.512 |
0.668 |
0.448 |
Large |
|
H2: ICN -> GI |
0.256 |
0.056 |
4.569 |
0.000 |
0.163 |
0.345 |
0.077 |
Small |
|
H3: PS -> TIC |
0.135 |
0.048 |
2.788 |
0.003 |
0.056 |
0.216 |
0.023 |
Small |
|
H4: PS -> GI |
0.464 |
0.053 |
8.799 |
0.000 |
0.376 |
0.550 |
0.253 |
Medium |
|
H5: TIC -> VCO |
0.338 |
0.048 |
7.083 |
0.000 |
0.254 |
0.412 |
0.178 |
Medium |
|
H6: GI -> VCO |
0.416 |
0.044 |
9.422 |
0.000 |
0.340 |
0.486 |
0.288 |
Medium |
Table 9. Moderation path relationship test results
|
Relationships |
Std.Beta |
Std.Dev |
T-Value |
P-Value |
PCI LL |
PCI UL |
f2 |
Effect Size |
|
H7: ER x TIC -> VCO |
0.124 |
0.057 |
2.170 |
0.015 |
0.031 |
0.219 |
0.032 |
Large |
|
H8: ER x GI -> VCO |
0.104 |
0.049 |
2.096 |
0.018 |
0.023 |
0.188 |
0.022 |
Medium |
Effect size (f²) analysis further strengthened these findings. ICN's impact on TIC exhibited a large effect size (f² = 0.448), indicating a dominant influence. The paths from PS to GI (f² = 0.253), TIC to VCO (f² = 0.178), and GI to VCO (f² = 0.288) showed medium effect sizes, demonstrating moderate but meaningful contributions. Meanwhile, the effects of ICN on GI (f² = 0.077) and PS on TIC (f² = 0.023) were classified as small effects. It is worth noting that, although the direct paths from ICN to GI (H2) and from PS to TIC (H3) were both statistically significant, their effect sizes (f²) were relatively small. This suggests that, while these relationships exist, their practical impact on GI and TIC may be limited in the current industry context. Possible reasons may include the nascent stage of the sector, differences in firms' absorptive capacities, or the specific policy environment. Future research is encouraged to further examine these relationships in different contexts or with larger, more diverse samples.
Overall, the structural paths were clearly defined, with all hypotheses (H1–H6) supported by both statistical significance and effect size measures, highlighting a robust and coherent causal mechanism linking collaboration, policy support, technological capability, innovation, and value chain performance.
4.4.2 Moderation effect testing
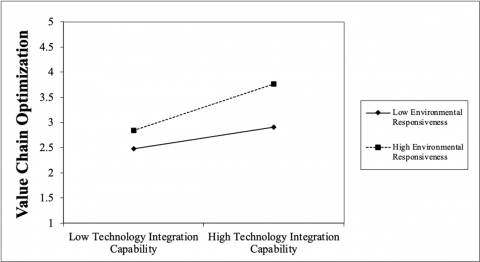
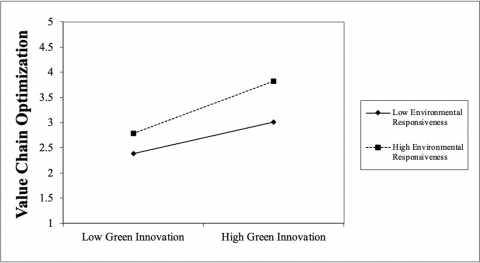
This section examines the moderating role of ER in the structural relationships between TIC and VCO, and between GI and VCO. The moderation effects were assessed using interaction terms, and the results are illustrated in Figures 3 and 4 and summarized in Table 9. Regarding H7, the interaction between ER and TIC significantly influenced VCO (β = 0.124, p = 0.015). As shown in Figure 3, when ER is high, the positive relationship between TIC and VCO becomes stronger, compared to when ER is low. The effect size (f² = 0.032) indicates a strong moderating effect according to the criteria proposed by Hair et al. [53]. For H8, the interaction between ER and GI also significantly influenced VCO (β = 0.104, p = 0.018). As presented in Figure 4, firms with higher ER demonstrate a stronger positive relationship between GI and VCO than those with lower ER. The corresponding effect size (f² = 0.022) suggests a medium moderating effect. Overall, the results confirm that ER positively moderates the impact of both TIC and GI on VCO. Firms that exhibit stronger ER can amplify the beneficial effects of technological and innovative initiatives on optimizing their value chains, thus achieving greater ecological and economic sustainability.
Figure 3. Interaction effect of TIC and environmental responsiveness on value chain optimization
Figure 4. Interaction effect of green innovation and environmental responsiveness on value chain optimization
4.4.3 Mediation effect test results
Table 10 presents the mediation effect test results for the proposed relationships. The findings indicate that TIC positively mediates the relationship between the ICN and VCO (β = 0.200, p < 0.001), with a 95% confidence interval excluding zero (PCL LL = 0.144, PCI UL = 0.259). Similarly, TIC also plays a positive mediating role between PS and VCO (β = 0.045, p = 0.004), with the confidence interval (PCL LL = 0.020, PCI UL = 0.077) supporting the robustness of the mediation effect. Furthermore, GI significantly and positively mediates the relationship between ICN and VCO (β = 0.107, p < 0.001), and GI also mediates the relationship between PS and VCO (β = 0.193, p < 0.001), with both confidence intervals excluding zero (PCL LL = 0.067, PCI UL = 0.150 for ICN → GI → VCO, and PCL LL = 0.144, PCI UL = 0.250 for PS → GI → VCO). These results collectively confirm that both TIC and GI serve as critical mediating mechanisms that channel the effects of external collaboration and policy support into value chain optimization, reinforcing the internal technological and innovative capacities of enterprises as key pathways to achieving sustainable value chain improvements.
4.5 Predictive power assessment
To evaluate the model’s out-of-sample predictive relevance, the PLS-Predict procedure was performed using SmartPLS. Table 11 presents the results, including Q²_predict values, root mean squared errors (RMSE) from PLS-SEM and linear models (LM), and the RMSE differences (PLS-LM). The Q²_predict values for all indicators (VCO1 to VCO8) were greater than zero, ranging from 0.209 to 0.303, indicating that the model exhibits predictive relevance for the target construct VCO [59, 60]. Furthermore, the comparison between PLS-SEM_RMSE and LM_RMSE shows that all PLS-SEM RMSE values are lower than or very close to the LM RMSE values, with negative PLS-LM differences. According to Shmueli et al. [60], this suggests that the PLS-SEM model outperformed the naive benchmark model (LM) in terms of predictive accuracy. Overall, the predictive assessment results confirmed that the proposed structural model not only demonstrates strong in-sample explanatory power but also possesses acceptable out-of-sample predictive ability for VCO, reinforcing the model’s robustness and practical applicability.
Table 10. Mediation effect test results
|
Relationships |
Std.Beta |
Std.Dev |
T-Value |
P-Value |
PCI LL |
PCI UL |
|
H9: ICN -> TIC -> VCO |
0.200 |
0.035 |
5.771 |
0.000 |
0.144 |
0.259 |
|
H10: PS -> TIC -> VCO |
0.045 |
0.017 |
2.627 |
0.004 |
0.020 |
0.077 |
|
H11: ICN -> GI -> VCO |
0.107 |
0.025 |
4.197 |
0.000 |
0.067 |
0.150 |
|
H12: PS -> GI -> VCO |
0.193 |
0.032 |
5.983 |
0.000 |
0.144 |
0.250 |
Table 11. PLS-predict
|
Indicator |
Q² Predict |
PLS-SEM_RMSE |
LM_RMSE |
PLS-LM |
|
VCO1 |
0.239 |
1.252 |
1.291 |
-0.039 |
|
VCO2 |
0.285 |
1.25 |
1.283 |
-0.033 |
|
VCO3 |
0.301 |
1.285 |
1.313 |
-0.028 |
|
VCO4 |
0.303 |
1.319 |
1.356 |
-0.037 |
|
VCO5 |
0.209 |
1.465 |
1.531 |
-0.066 |
|
VCO6 |
0.279 |
1.335 |
1.371 |
-0.036 |
|
VCO7 |
0.235 |
1.344 |
1.379 |
-0.035 |
|
VCO8 |
0.222 |
1.461 |
1.502 |
-0.041 |
4.6 Discussion
The results of this study provide strong empirical support for the conceptual framework linking external environmental enablers, internal enterprise capabilities, and value chain optimization in the sugarcane bagasse packaging sector. The findings confirm that both ICN and PS significantly enhance firms’ technology integration capabilities and green innovation efforts, thereby substantiating the theoretical propositions drawn from RBV, Collaborative Network Theory, and Institutional Theory. Specifically, ICN exhibited a stronger influence on TIC compared to PS, suggesting that interactive relationships and shared knowledge within the industry are particularly critical for technological advancement and absorption in emerging sectors. Conversely, policy support exerted a stronger impact on green innovation, highlighting the crucial role of government incentives, regulatory frameworks, and institutional legitimacy in promoting sustainable practices. Furthermore, the study demonstrated that both TIC and GI have substantial positive effects on value chain optimization, reinforcing the notion that internal capability development is indispensable for achieving superior ecological and economic performance. The identified moderating effects of environmental responsiveness further enriched the understanding of how firms’ adaptive attitudes toward environmental changes can amplify the effectiveness of technological and green innovations on value chain outcomes. Notably, the significant mediating roles of technology integration and green innovation illustrate that external collaboration and policy initiatives translate into value chain improvements primarily through capability enhancement, rather than direct impacts. This highlights the critical importance of building strong internal capacities to fully leverage external opportunities for sustainable transformation. Overall, the discussion underscores that a synergistic approach—where external industry and policy drivers are complemented by robust internal capabilities and proactive environmental strategies—is essential for promoting the sustainable development and competitive advantage of the sugarcane bagasse packaging value chain. These insights offer important theoretical contributions and provide actionable guidance for enterprises, policymakers, and stakeholders committed to advancing green industrialization and circular economy practices.
This study demonstrated that the optimization of the sugarcane bagasse packaging value chain hinges not only on technological advancement but also on the strategic interplay between external environmental enablers and internal enterprise capabilities. By synthesizing the RBV, Collaborative Network Theory, and Institutional Theory within a unified empirical framework, the research revealed that ICN primarily foster technological capability, whereas PS more effectively drives green innovation—together creating a synergistic foundation for sustainable industrial transformation. Crucially, the mediating roles of technology integration and green innovation explained how external drivers are translated into tangible ecological and economic benefits, and the moderating effect of environmental responsiveness underscores the need for enterprises to proactively align their strategies with evolving sustainability imperatives. In moving beyond prior studies, these findings highlighted the importance of leveraging both external partnerships and policy mechanisms, while simultaneously investing in internal capability building and adaptive environmental strategies, to achieve competitive and sustainable value chain optimization in emerging green industries.
5.1 Theoretical contributions
This study advanced the theoretical understanding of sustainable value chain optimization in emerging green industries by integrating the RBV, Collaborative Network Theory, and Institutional Theory into a unified analytical framework. By empirically demonstrating how ICN and PS jointly shape enterprise capabilities—specifically technology integration and green innovation—the research clarified the multi-layered pathways through which external drivers promote both ecological and economic performance. The introduction of environmental responsiveness as a moderating factor further refined the existing capability–performance linkage, revealing that firms’ adaptability to environmental pressures is essential for maximizing the benefits of internal capability development. By situating these insights within the novel context of the sugarcane bagasse packaging sector, this study extended the applicability of established management theories to new sustainability-driven industries and offers a comprehensive lens for understanding how external and internal forces interact to drive industrial transformation.
5.2 Practical contributions
Practically, this study offered actionable insights for enterprise managers, policymakers, and value chain stakeholders striving for sustainable transformation. First, it highlighted that active participation in ICN significantly enhances technological capability, suggesting that firms should invest in long-term partnerships with suppliers, research institutions, and industry associations to facilitate technology absorption and innovation co-development. Second, the study underscored the critical role of policy support in catalyzing green innovation, providing an empirical foundation for governments to implement targeted measures such as subsidies, green certification systems, and regulatory frameworks that reduce adoption costs and legitimize eco-innovations. Third, the findings emphasized the necessity of internal capacity building: firms should not solely rely on external stimuli but must also cultivate technology integration and environmental responsiveness as strategic assets for low-carbon competitiveness. Lastly, the empirical focus on the sugarcane bagasse packaging sector offered a replicable roadmap for other agricultural by-product applications, such as rice husk, wheat straw, and bamboo fiber, contributing to broader efforts in sustainable rural development and green.
5.3 Limitations and future research
While this study provided valuable insights, several limitations must be acknowledged. The use of a cross-sectional survey within a single national context restricted the ability to establish long-term causal inferences and limits the generalizability of the results to other countries or industry settings. The findings might have been influenced by unobserved national or sectoral factors, such as local policy environments, cultural characteristics, or market maturity, which could impact the relationships observed. Future research should consider longitudinal designs to better capture the dynamic evolution of enterprise capabilities and sustainable practices over time. In addition, expanding the empirical scope to include multi-country or multi-industry comparative analyses would help to test the robustness and transferability of the conceptual model. To address additional research gaps, scholars are encouraged to investigate the influence of organizational culture, leadership style, digital transformation readiness, resource endowment, or external stakeholder engagement as potential moderating or mediating variables. Incorporating qualitative case studies or mixed-methods approaches may also uncover context-specific mechanisms and provide deeper insights into the complex interactions between external enablers, internal capabilities, and value chain optimization. As global trends in low-carbon and circular economies continue to accelerate, such research directions will be essential for refining theoretical frameworks and informing more effective strategies for sustainable transformation in emerging and traditional industries alike.
The author wishes to express sincere gratitude to the School of Architecture and Design, King Mongkut’s University of Technology Thonburi, for providing academic and research support throughout this project. Special thanks are extended to the doctoral advisor team, particularly Assoc. Prof. Chokeanand Bussracumpakorn, Ph.D., for their invaluable guidance and encouragement during the course of the Doctor of Philosophy in Design and Planning program.
[1] Ungureanu, N., Vlăduț, V., Biriș, S.Ș. (2022). Sustainable valorization of waste and by-products from sugarcane processing. Sustainability, 14(17): 11089. https://doi.org/10.3390/su141711089
[2] Yao, S., Budthimedhee, K. (2025). Disappearance of vernacular character in rural residences: An assessment of residents’ requirements for rural residential façades and environments in Suzhou, Jiangsu, China. Journal of Chinese Architecture and Urbanism, 7(1): 5719. https://doi.org/10.36922/jcau.5719
[3] Nazari, M., Ansari, M., Ashari Pour, M.J. (2024). Bibliometric analysis and presenting the future research path in the field of sustainable business model innovation. Scientometrics Research Journal. https://doi.org/10.22070/rsci.2024.19650.1759
[4] Barney, J. (1991). Firm resources and sustained competitive advantage. Journal of Management, 17(1): 99-120. https://doi.org/10.1177/014920639101700108
[5] Wernerfelt, B. (1984). A resource-based view of the firm. Strategic Management Journal, 5(2): 171-180. https://doi.org/10.1002/smj.4250050207
[6] Dangelico, R.M., Pujari, D. (2010). Mainstreaming green product innovation: Why and how companies integrate environmental sustainability. Journal of Business Ethics, 95(3): 471-486. https://doi.org/10.1007/s10551-010-0434-0
[7] Wibowo, I. (2023). Operational management in the digital era: Strategic integration with entrepreneurship. Jurnal Ilmiah Multidisiplin Indonesia (JIM-ID), 2(2): 96-102. https://doi.org/10.58471/esaprom.v2i02.4033
[8] Marco-Lajara, B., Zaragoza-Saez, P., Martínez-Falcó, J. (2024). Green Innovation: Balancing economic efficiency with environmental protection. In Research Anthology on Business Law, Policy, and Social Responsibility. IGI Global Scientific Publishing, pp. 916-931. https://doi.org/10.4018/979-8-3693-2045-7.ch048
[9] Powell, W. (1990). Neither market nor hierarchy: Network forms of organization. Research in Organizational Behaviour, 12: 295-336.
[10] Provan, K.G., Kenis, P. (2008). Modes of network governance: Structure, management, and effectiveness. Journal of Public Administration Research and Theory: J-PART, 18(2): 229-252. https://doi.org/10.1093/jopart/mum015
[11] Dimaggio, P., Powell, W. (1983). The iron cage revisited: Institutional isomorphism and collective rationality in organizational fields. American Sociological Review, 23.
[12] Scott, W.R. (1995). Institutions and organizations. Ideas, interests and identities. Sage, 17(2): 136-140. https://doi.org/10.3917/mana.172.0136
[13] Zhang, G. (2023). Analysis of the impact of green innovation and corporate green performance. International Journal of Energy, 3(3): 52-58. https://doi.org/10.54097/ije.v3i3.012
[14] Marra, A., Carlei, V., Baldassari, C. (2020). Exploring networks of proximity for partner selection, firms’ collaboration and knowledge exchange. The case of clean‐tech industry. Business Strategy and the Environment, 29(3): 1034-1044. https://doi.org/10.1002/bse.2415
[15] Hakansson, H. (2015). Industrial Technological Development (Routledge Revivals). Routledge. https://doi.org/10.4324/9781315724935
[16] Sun, D., Yuan, Y. (2019). Cooperative innovation, information technology application and industrial upgrading. DEStech Transactions on Social Science, Education and Human Science, (EMSE). https://doi.org/10.12783/dtssehs/emse2018/27231
[17] Melander, L. (2018). Improving green product innovation through collaboration. IEEE Engineering Management Review, 46(2): 133-137. https://doi.org/10.1109/EMR.2018.2833861
[18] Chen, W. (2023). Research on the mechanism and path of innovation policy driving enterprise technological innovation. Frontiers in Science and Engineering, 3(5): 58-69. https://doi.org/10.54691/fse.v3i5.5021
[19] Fatima, M., Ata, G., Rizwan, A. (2023). Institutional pressures and sustainable business practices: A case of strategic environmental management. Global Economics Review, VIII(I): 196-212. https://doi.org/10.31703/ger.2023(VIII-I).18
[20] Alfaro‐Serrano, D., Balantrapu, T., Chaurey, R., Goicoechea, A., Verhoogen, E. (2021). Interventions to promote technology adoption in firms: A systematic review. Campbell Systematic Reviews, 17(4): e1181. https://doi.org/10.1002/cl2.1181
[21] Bettarelli, L. (2023). Environmental policies and innovation in renewable energy. IMF Working Papers, 2023(180): 55. https://doi.org/10.5089/9798400251658.001
[22] Li, Y., Zhang, X., Hao, J., Huang, Q. (2022). The impact of green technology innovation on global value chain upgrading in China’s equipment manufacturing industry. Frontiers in Environmental Science, 10: 1044583. https://doi.org/10.3389/fenvs.2022.1044583
[23] Cai, Z., Huang, Q., Liu, H., Liang, L. (2016). The moderating role of information technology capability in the relationship between supply chain collaboration and organizational responsiveness: Evidence from China. International Journal of Operations & Production Management, 36(10): 1247-1271. https://doi.org/10.1108/IJOPM-08-2014-0406
[24] Pathania, R., Kumar, Y., Sehgal, M., Deshmukh, A. (2025). Embracing sustainable value chains in reverse logistics.
[25] Sun, Y. (2023). Green innovation risk index screening under the global value chain based on the group decision characteristic root method. Frontiers in Environmental Science, 11: 1208497. https://doi.org/10.3389/fenvs.2023.1208497
[26] Afeltra, G., Alerasoul, S.A., Strozzi, F. (2023). The evolution of sustainable innovation: From the past to the future. European Journal of Innovation Management, 26(2): 386-421. https://doi.org/10.1108/EJIM-02-2021-0113
[27] Bhatt, Y., Ghuman, K. (2023). Corporate environmental responsiveness: A bibliometric and content analysis. Management Review Quarterly, 73(3): 1303-1350. https://doi.org/10.1007/s11301-022-00275-8
[28] Golicic, S.L., Smith, C.D. (2013). A meta‐analysis of environmentally sustainable supply chain management practices and firm performance. Journal of Supply Chain Management, 49(2): 78-95. https://doi.org/10.1111/jscm.12006
[29] Jin, X., Yang, D., Rhee, M. (2024). How do dynamic capabilities enable a firm to convert the external pressures into environmental innovation? A process-based study using structural equation modeling. Systems, 12(12): 561. https://doi.org/10.3390/systems12120561
[30] Hassan, M.G., Akanmu, M.D., Yusoff, R.Z. (2018). Technological integration and sustainable performance in manufacturing firms. International Journal of Technology, 9(8): 1639. https://doi.org/10.14716/ijtech.v9i8.2747
[31] Venaik, S., Midgley, D., Devinney, T. (2024). Integration–responsiveness framework. In Encyclopedia of International Strategic Management. Edward Elgar Publishing, pp. 168-173. https://doi.org/10.4337/9781800884045.ch46
[32] Albitar, K., Hussainey, K. (2023). Sustainability, environmental responsibility and innovation. Green Finance, 5(1): 85-88. https://doi.org/10.3934/GF.2023004
[33] Abbas, A., Luo, X., Wattoo, M.U., Hu, R. (2022). Organizational behavior in green supply chain integration: Nexus between information technology capability, green innovation, and organizational performance. Frontiers in Psychology, 13: 874639. https://doi.org/10.3389/fpsyg.2022.874639
[34] Luo, H. (2024). The impact of value chain embedding on industrial structure optimization. Journal of Education, Humanities and Social Sciences, 35: 156-161. https://doi.org/10.54097/rm5g2375
[35] Bawa, S., Benin, I.W., Almudaihesh, A.S. (2024). Innovation networks and knowledge diffusion across industries: An empirical study from an emerging economy. Sustainability, 16(24): 11308. https://doi.org/10.3390/su162411308
[36] Ghorbani, A., Fartash, K., Bagheri, A. (2024). How a timely policy contributes to technological capability building: Insights from Iran’s biopharmaceutical sector. Science and Public Policy, 51(4): 593-608. https://doi.org/10.1093/scipol/scae003
[37] Garanti, Z., Berjozkina, G. (2025). Theme editorial: What is the transformative relationship between tourism and technology? Worldwide Hospitality and Tourism Themes, 17(1): 1-5. https://doi.org/10.1108/WHATT-02-2025-315
[38] Pourhejazy, P., Wyciślak, S., Solvang, W.D., Ericson, Å. (2025). Editorial: Supply chain transformation for pursuing carbon-neutrality. Frontiers in Sustainability, 6: 1548813. https://doi.org/10.3389/frsus.2025.1548813
[39] Piot-Lepetit, I. (2025). Editorial: Strategies of digitalization and sustainability in agrifood value chains. Frontiers in Sustainable Food Systems, 9. https://doi.org/10.3389/fsufs.2025.1565662
[40] Lu, Y., Chebo, A.K., Dhliwayo, S., Negasa, S.B. (2022). The paradox in the ecological side of corporate entrepreneurship sustainability: A research agenda and policy direction. Sustainability, 14(22): 15198. https://doi.org/10.3390/su142215198
[41] Powell, W.W., Koput, K.W., Smith-Doerr, L. (1996). Interorganizational collaboration and the locus of innovation: Networks of learning in biotechnology. Administrative Science Quarterly, 41(1): 116. https://doi.org/10.2307/2393988
[42] Wei, J., Liu, Y. (2015). Government support and firm innovation performance: Empirical analysis of 343 innovative enterprises in China. Chinese Management Studies, 9(1): 38-55. https://doi.org/10.1108/CMS-01-2015-0018
[43] Zhang, G., Shi, Y., Huang, N. (2024). Government subsidies, green innovation, and firm total factor productivity of listed artificial intelligence firms in China. Sustainability, 16(8): 3369. https://doi.org/10.3390/su16083369
[44] Teece, D.J., Pisano, G., Shuen, A. (1997). Dynamic capabilities and strategic management. Strategic Management Journal, 18(7): 509-533. https://doi.org/10.1002/(SICI)1097-0266(199708)18:7<509::AID-SMJ882>3.0.CO;2-Z
[45] Zahra, S.A., George, G. (2002). Absorptive capacity: A review, reconceptualization, and extension. Academy of Management Review, 27(2): 185. https://doi.org/10.2307/4134351
[46] Li, S., Li, X., Zhao, Q., Zhang, J., Xue, H. (2022). An analysis of the dimensional constructs of green innovation in manufacturing enterprises: Scale development and empirical testing. Sustainability, 14(24): 16919. https://doi.org/10.3390/su142416919
[47] Calik, E. (2024). A validated measurement scale for sustainable product innovation performance. Technovation, 129: 102882. https://doi.org/10.1016/j.technovation.2023.102882
[48] Lee, K.H., Min, B. (2015). Green R&D for eco-innovation and its impact on carbon emissions and firm performance. Journal of Cleaner Production, 108: 534-542. https://doi.org/10.1016/j.jclepro.2015.05.114
[49] Horbach, J., Rammer, C., Rennings, K. (2012). Determinants of eco-innovations by type of environmental impact — The role of regulatory push/pull, technology push and market pull. Ecological Economics, 78: 112-122. https://doi.org/10.1016/j.ecolecon.2012.04.005
[50] Gereffi, G., Humphrey, J., Sturgeon, T. (2005). The governance of global value chains. Review of International Political Economy, 12(1): 78-104. https://doi.org/10.1080/09692290500049805
[51] Trienekens, J.H. (2011). Agricultural value chains in developing countries a framework for analysis. International Food and Agribusiness Management Review, 14(2): 51-82. https://doi.org/10.22004/AG.ECON.103987
[52] Cain, M.K., Zhang, Z., Yuan, K.H. (2017). Univariate and multivariate skewness and kurtosis for measuring nonnormality: Prevalence, influence and estimation. Behavior Research Methods, 49(5): 1716-1735. https://doi.org/10.3758/s13428-016-0814-1
[53] Hair, J., Hult, G.T.M., Ringle, C., Sarstedt, M. (2022). A primer on partial least squares structural equation modeling (PLS-SEM).
[54] Kock, N., Lynn, G. (2012). Lateral collinearity and misleading results in variance-based SEM: An illustration and recommendations. Journal of the Association of Information Systems, 13(7). https://doi.org/10.17705/1jais.00302
[55] Fornell, C., Larcker, D.F. (1981). Evaluating structural equation models with unobservable variables and measurement error. Journal of Marketing Research, 18(1): 39-50. https://doi.org/10.2307/3151312
[56] Henseler, J., Ringle, C.M., Sarstedt, M. (2015). A new criterion for assessing discriminant validity in variance-based structural equation modeling. Journal of the Academy of Marketing Science, 43(1): 115-135. https://doi.org/10.1007/s11747-014-0403-8
[57] Chin, W.W. (1998). The partial least squares approach for structural equation modeling. In Modern Methods for Business Research. Mahwah, NJ, US: Lawrence Erlbaum Associates Publishers, pp. 295-336.
[58] Chin, W.W. (2009). How to write up and report PLS analyses. In Handbook of Partial Least Squares: Concepts, Methods and Applications. Berlin, Heidelberg: Springer, pp. 655-690. https://doi.org/10.1007/978-3-540-32827-8_29
[59] Shmueli, G., Ray, S., Velasquez Estrada, J.M., Chatla, S.B. (2016). The elephant in the room: Predictive performance of PLS models. Journal of Business Research, 69(10): 4552-4564. https://doi.org/10.1016/j.jbusres.2016.03.049
[60] Shmueli, G., Sarstedt, M., Hair, J.F., Cheah, J.H., Ting, H., Vaithilingam, S., Ringle, C.M. (2019). Predictive model assessment in PLS-SEM: Guidelines for using PLSpredict. European Journal of Marketing, 53(11): 2322-2347. https://doi.org/10.1108/EJM-02-2019-0189