Ingrid Sarmiento-Torres*![]() | Edwin Ubillus Agurto
| Edwin Ubillus Agurto![]() | Raúl Sánchez Ancajima
| Raúl Sánchez Ancajima![]()
© 2025 The authors. This article is published by IIETA and is licensed under the CC BY 4.0 license (http://creativecommons.org/licenses/by/4.0/).
OPEN ACCESS
A key component in the economic structure of countries is organizations of popular and solidarity economy (EPS), which have been shown to contribute significantly to local welfare by fostering social cohesion and economic development. However, local development socioeconomic process variables such as the Index of Unsatisfied Basic Needs, level of dependency ratio and non-oil gross value added, exhibit a discernible spatiality, this study addresses this gap by investigating the relationship between the distribution of non-financial EPS organizations and local development variables in Ecuador at the cantonal level. The methodology employed in this study focused on exploratory spatial data analysis (ESDA) and geographically weighted regression (GWR), capturing variations as a function of geographic location. The results revealed that the distribution of non-financial EPS in Ecuador shows significant spatial autocorrelation at the cantonal level. The GWR model estimated with the three cantonal socioeconomic variables (adjusted R² = 0.7134, AICc = 434.34) suggests that in cantons with lower welfare index, there is less presence of EPS organizations. In conclusion, this study provides a detailed view of the spatial distribution of non-financial EPSs in Ecuador and their relationship with local development. Although the overall spatial autocorrelation is weak, the identification of local patterns suggests the need for specific approaches to address inequalities in local development. These findings underscore the importance of considering spatial dynamics in the design of economic and social development policies, providing a basis for future research in local economics and development.
popular and solidarity economy (EPS), local development, spatial autocorrelation, geographically weighted regression (GWR), spatial analysis
Popular and solidarity economy (EPS) organizations have been noted as an effective mechanism for resource redistribution and welfare promotion, especially in areas where traditional economic structures fail to meet local needs [1-4]. However, despite their growing importance, understanding of the dynamics of these EPS organizations and the factors that influence their development remains limited. Most research has focused on individual aspects or on comparisons between EPS organizations and conventional enterprises, leaving a gap in knowledge about how they interact in different territories and how they can be modeled to foster their development.
Local development is a multidimensional process that seeks to improve the quality of life of communities by strengthening their economic, social and cultural capacities [5, 6]. In this context, EPS organizations have been recognized as significant actors contributing to economic resilience and social inclusion. It has been argued that these organizations not only provide goods and services but also generate social capital by strengthening community ties and fostering citizen participation [7]. The role played by EPS organizations in boosting the economy is effective, and in relation to economic growth, it becomes a significant resource, although not an ultimate goal, for the progress of people and their social interactions [8, 9].
According to the Global Entrepreneurship Monitor (GEM), specialists reveal that the environment impacts the choice, evolution and success of entrepreneurship. In the socio-political and cultural context of Ecuador, there are persistent weaknesses over time that have slowed down the real advancement of entrepreneurship, thus limiting its potential impact on the country's economy [10]. The spatial impact of non-financial EPS organizations on local development has been insufficiently explored, highlighting the need for more detailed research.
The complexity of spatial dynamics at the EPS level, structured as cooperatives and associations, represents a key component in the local economy by providing essential services and fostering community participation. Highlighting spatial complexities in socioeconomic development patterns—such as demographic pressure, structural inequalities, and localized economic disparities—that influence the presence of EPS organizations.
Capturing the spatial complexities of this relationship where geographic proximity does not always translate into direct economic or social interactions, and identifying these differences is crucial for the design of public policies that promote more equitable and sustainable development.
This study focuses on the link between non-financial EPS organizations and local development, i.e., the dynamization of the cooperative sector and its relationship with socioeconomic variables of the territory, using a geographically weighted regression (GWR) approach to capture the spatial complexities of this analogy, denoting variations as a function of its geographical location.
2.1 Popular and solidarity economy
In Latin America, the interaction between modernity and postmodernity is particularly complex. Modernity is commonly associated with the production of goods and centralized political power, while postmodernity shifts focus on information, services, and decentralized forms of organizations. As capitalism tends to homogenize the individuals' particularities, space opens up for prominent economic systems to be those that offer differentiated information, where the socioeconomic model moving towards postmodernity is information-driven and governed by collaboration [11-13].
Ecuador, like many countries in the region, faces the challenge of achieving structural economic transformation. Therefore, it is proposed as an essential strategy to promote the development of national companies, increase added value and bet on local innovation; as proposed by the Economic Commission for Latin America and the Caribbean (ECLAC) in its report entitled Horizons 2030: equality at the heart of sustainable development [14], these strategies align with Prebisch’s, quoted by to grow inward [15].
In this context, the third sector is relevant not only for its economic contribution but also for the capacity of self-management for development, which promotes the progress of communities [16-19]. In this sense, local governments act as key actors to enhance the advancement of this economic model, aligned with its ecosystemic characteristics [20-22], until it can establish its own social and economic space in the face of anonymous markets, cementing a basis for its development.
Ecuador’s political-administrative organization is structured across multiple levels of government, with the cantonal level playing a crucial role in territorial governance. The country is divided into 221 cantons, which are distributed across 24 provinces. Each canton functions as an autonomous administrative jurisdiction, governed by a Decentralized Autonomous Government (GAD), headed by a mayor. This territorial division enables the implementation of public policies and development strategies tailored to the specific geographic, demographic, and socioeconomic characteristics of each area, making it especially relevant for studies addressing spatial inequalities or territorial determinants, such as those related to the EPS.
These differences offer a fertile ground for analyzing spatial dependence and development patterns. While several studies used global regression models to examine determinants of local development, these models assume spatial stationarity, thereby masking regional disparities [6, 23]. In contrast, Geographical Weighted Regression (GWR) allows for spatial non-stationarity by estimating location-specific coefficients. This approach is particularly useful in examining the heterogeneous distribution of EPS organizations across Cantons (Figure 1), where institutional capacities, economic structures, and social needs are different.
Figure 1. EPS in political-administrative division of Ecuador
2.2 Statistical models for the study of the popular and solidarity economy
Statistical modeling consists of representing a specific phenomenon through the use of mathematical models, which facilitate the explanation of the variables to be analyzed [24-27]. GWR was established as the central analytical model in this study; it responds to the need to capture the differentiated territorial dynamics underlying the spatial distribution of non-financial EPS organizations in the cantons of Ecuador.
Unlike traditional regression models, which assume homogeneous relationships between variables throughout the geographic space, the GWR approach allows the coefficients of regression to vary locally, identifying how the intensity and direction of the explanatory effects change according to the geographic location [25, 28]. This property is particularly relevant in contexts such as Ecuador, where collective organization processes respond to strongly territorialized socioeconomic, historical, and cultural realities.
A weighted geographical regression model, known as GWR, is used with the objective of modeling variables in a spatial context, capturing variations in relation to their location, making it an appropriate choice for this research. The optimal assignment of the kernel is fundamental to the structure of the model, which is based on weight. The specificity of the treatment given to the spatial component is widely used to identify the heterogeneities of the territories [29].
GWR calculates the distance between the location of two points in geographic space for n observations in k variables, Eq. (1), $y_i$ : Organizations of canton $\mathrm{i} ; \beta_k\left(u_i, v_i\right)$ : model coefficients for given geographic coordinates. $x_{i k}$ : variables corresponding to observation $\mathrm{I} ; \epsilon_i$ : random error term of observation i.
$y_i=\beta_0(u i, v i)+\sum_{i=1}^p x_{i k} \beta_k\left(u_i, v_i\right)+\epsilon_i ; i=1, \ldots, n$ (1)
GWR and its related techniques are directly based on the locally weighted non-parametric regression models proposed by Cleveland and Devlin (1988) for curve fitting and interpolation [30]. GWR improves model fit by calibrating a separate regression equation at each location, using nearby observations weighted by their spatial proximity. This local estimation process enhances the diagnosis of spatial patterns and allows researchers to capture nuanced regional dynamics that would otherwise be masked in global models. In studies on territorial determinants, GWR provides a robust analytical framework to identify where and how local factors exert differential influence across space, thereby supporting more targeted and territorial policy interventions.
To investigate the territorial determinants of the EPS in the cantons of Ecuador, the methodology described in Figure 2 was applied. This methodological approach facilitated a comprehensive understanding of the spatial behavior of the variables under study.
Figure 2. Conceptual diagram of methodology
The disaggregation of data at the cantonal level of the organizations obtained from the official portal of the Super Intendencia de Economía Popular y Solidaria [31], could not possibly integrate directly with other local socioeconomic information sources, due to inconsistencies in format and identifier. Consequently, data mining was undertaken to structure a unified database across the 221 cantons using the national statistical geographic classifier that defines Ecuador´s political-administrative division. This integration incorporated key socioeconomic indicators drawn from the most recent population census published by the Ecuadorian Institute of Statistics and Census (INEC) [32].
Geospatial boundaries were sourced from GADM [33] (Database of Global Administrative Areas), which provides detailed shapefiles for administrative areas. The dependent variable in this analysis corresponds to the number of non-financial EPS organizations per canton. Independent variables included: the Unsatisfied Basic Needs Index [34, 35], a widely recognized proxy for multidimensional poverty; the dependency ratio indicator, which measures the proportion of non-working age population (under 15 and over 65) relative to the economically active population [36], and the non-oil Gross Value added, which reflects the total value produced by the economy excluding petroleum-related activities [37].
To ensure methodological robustness, an exploratory spatial data analysis (ESDA), was conducted to detect irregularities and heteroscedasticity in the distributions. All continuous variables were transformed using logarithms, a standard practice that stabilizes variance and improves the interpretability of coefficients in regression models with skewed distributions [38-40].
The first step involved assessing the presence of spatial dependence in the distribution of EPS organizations across Ecuadorian cantons. For this purpose, both Global Moran’s I and Local Indicators of Spatial Association (LISA) were computed using the spdep and sf packages in R. Moran's I measures the degree of spatial autocorrelation, where values close to +1 indicate clustering of similar values, 0 implies spatial randomness, and values near -1 suggest dispersion. A queen contiguity matrix was used to define spatial neighbors, given the irregular geometry of cantonal boundaries. The global Moran’s I statistic was calculated for the log-transformed dependent variable (number of EPS organizations), followed by LISA cluster maps, which allowed identifying significant local clusters—namely High-High, Low-Low, High-Low, and Low-High patterns—at a 95% confidence level through permutation tests.
Model selection for the GWR followed a stepwise approach, where combinations of independent variables were evaluated iteratively. The selection criterion was the minimization of the corrected Akaike Information Criterion (AICc), which balances model fit and complexity. A total of candidate models were compared, involving different combinations of the three explanatory variables considered: the Unsatisfied Basic Needs Index, dependency ratio, and non-oil Gross Value Added. No interaction terms or higher-order polynomial terms were included, as the primary objective was to maintain model interpretability and avoid multicollinearity, particularly given the spatial heterogeneity already captured by the local parameter estimates of GWR.
Importantly, no missing data was identified in the final dataset. However, three insular cantons (Galápagos) were excluded from the spatial analysis due to their lack of geographic contiguity with the mainland. Since spatial econometric models, including GWR, require contiguity or proximity for constructing spatial weights matrices, the absence of neighboring units rendered these territories analytically incompatible. Their exclusion represents a minimal fraction of the sample and does not compromise the spatial representativeness of the national territory.
As a result of the exploratory analysis, approximately 50% of the 221 cantons in Ecuador have less than 32 organizations, while 25% of the cantons have more than 70 registered non-financial EPS organizations.
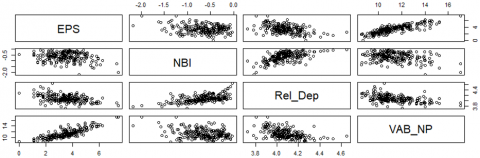
According to the dispersion of the points, as shown in Figure 3, some relationships are confirmed without considering the spaces where they arise. As non-financial EPS organizations become stronger or increase their presence, unsatisfied basic needs and economic dependence are reduced, thus contributing to non-oil economic growth.
Figure 3. Correlation of variables
To examine the presence of spatial patterns of presence in the territory, the spatial autocorrelation of the number of EPS organizations per canton was evaluated by means of the Moran I statistic, under a randomization approach and using a contiguity-based spatial weights matrix. The diagram shown in Figure 4 allows identifying the correlation of EPS organizations with respect to their spatial lag, i.e., their relationship with the weighted average values of neighboring cantons. The existence of a positive spatial autocorrelation is confirmed (I Moran =0.2444, p value= 5.813e-09). That is, cantons with a high presence of EPS organizations tend to be close to other cantons also with a high presence of these organizations, and the same is true for cantons with a low presence of EPS organizations.
Figure 4. I Moran diagram
According to the representation of the cantons on the map, it can be seen that:
In the first quadrant (High-High) there are cantons with a high number of organizations above the average of the indicator and have neighbourhoods with the same characteristic, concluding the presence of positive autocorrelation (Hotspots) in Guayaquil, Quito, Esmeraldas, Santo Domingo, Ambato, Lago Agrio.
In the case of the cantons located in the second quadrant (Low-High), it refers to cantons with a number of EPS below the mean and neighbours with values higher than the mean, spatial outliers, as in Saquisili.
Within the third quadrant (Low-Low) are cantons with low values surrounded by others with low values below the mean, presence of positive autocorrelation (Coldspots). These are Girón, Olmedo and Pablo VI. In addition, the cantons of Isabela, San Cristóbal, Santa Cruz are found in the lower part of the graph, where there is a low presence of EPS and its neighbors, these cantons are those of the Insular Region that do not have proximity with the mainland cantons.
In the fourth quadrant (High-Low) there are no cantons with a number of organizations below the average surrounded by cantons with low values, lack of spatial outliers.
The presence of spatial autocorrelation was reviewed in the ndependent variables: unsatisfied basic needs index, dependency ratio and non-oil gross value added; the results shown in Table 1, denote that they are significant for the indicated variables; which supports their inclusion in spatial analysis models (GWR), it is expected to vary substantially in space and to be conditioned by the geographic proximity between cantons.
Table 1. Global indices independent variables
|
Var |
Stand. Des |
P value |
I Moran |
|
X1_nbi |
9.437 |
< 2.2e-16 |
0.3987 |
|
X2_dep |
10.348 |
< 2.2e-16 |
0.4367 |
|
X3_vab |
6.503 |
7.863e-11 |
0.2734 |
Note: Expectation= -0.0046, Variance=0.00183
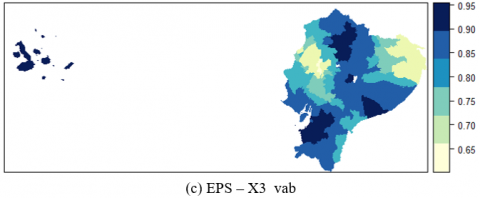
The correlation graphs GWR show in Figure 5 that relationships exist between variables and that these change in different parts of the territory, allowing you to identify specific local effects.
Figure 5. Correlation graphs GWR
Note: dark blue = positive correlation; yellow= negative correlation
The presence of spatial autocorrelation was reviewed in the independent variables (a), (b), (c) unsatisfied basic needs index, dependency ratio and non-oil gross value added; the results shown in Table 1, denote that they are significant for the indicated variables; which supports their inclusion in spatial analysis models (GWR), it is expected to vary substantially in space and to be conditioned by the geographic proximity between cantons.
A Gaussian kernel with an adaptive bandwidth was selected to accommodate variation in canton size and density. The optimal bandwidth was determined by minimizing the corrected Akaike Information Criterion (AICc). A pseudo-stepwise model selection procedure was conducted, comparing models with different variable combinations based on their AICc and deviance explained. All spatial analysis and model calibrations were performed using the GWmodel package in R.
The model with the best fit was included X1_nbi, X2_dep, and X3_vab, the pseudo stepwise procedure is used that proceeds in a forward (Figure 6).
Figure 6. Model selection stepwise
The GWR model (Table 2) was estimated using the logarithmic transformation of both dependent and independent variables; the resulting coefficients can be interpreted as elasticities.
Table 2. GWR model
|
Var |
Coefficient |
SE |
t |
p-value |
|
Intercept |
1.381 |
1.961 |
0.70 |
0.482 |
|
X1_nbi |
0.368 |
0.138 |
2.67 |
0.008** |
|
X2_dep |
-1.157 |
0.428 |
-2.70 |
0.007** |
|
X3_vab |
0.621 |
0.031 |
19.72 |
<0.001*** |
Note: Adjusted R² = 0.7134, AICc = 434.34
The coefficient of 0.368 indicates that a 1% increase in the Unsatisfied Basic Needs Index is associated, on average, with a 0.368% increase in the number of EPS organizations. This positive relationship suggests that EPS organizations may emerge more frequently in areas with higher socioeconomic needs, potentially as mechanisms for community-driven development and self-management in response to poverty.
The coefficient of -1.157 implies that a 1% increase in the dependency ratio, the proportion of non-working age population relative to the working-age population is associated with a 1.157% decrease in the number of EPS organizations. This negative elasticity suggests that higher demographic pressure may hinder the formation or sustainability of EPS organizations, possibly due to reduced economic productivity or lower capacity for collective organization in communities with a high dependent population.
The coefficient of 0.621 indicates that a 1% increase in the non-oil gross value added (a proxy for local economic productivity) is associated with a 0.621% increase in the number of EPS organizations. This result underscores the role of broader economic activity in supporting the emergence and operation of EPS entities, which may benefit from stronger local markets and better resource availability. These elasticities highlight the importance of local economic and demographic contexts in shaping the spatial distribution of EPS organizations.
The direction and magnitude of these effects vary across space, as shown by the GWR model, suggesting that policy interventions to support the EPS sector should be sensitive to localized socioeconomic dynamics. Dependency influences the economic growth rate of communities with EPS; in certain territories, EPS emerge as a community strategy to sustain non-working populations. Cantons such as Taisha, Twintza, and Arajuno exhibit high dependency ratios (above 85%) but maintain a low number of EPS organizations, which aligns with the expected negative association. However, some cantons present interesting deviations, Esmeraldas and Ambato show a relatively high presence of EPS organizations despite moderate-to-high dependency ratios, suggesting that other contextual or institutional factors may moderate this relationship. These spatial exceptions emphasize the importance of considering local heterogeneities when assessing the territorial determinants of EPS dynamics.
Analysis using the scientific method, which is broken down into aspects or variables of real processes, can identify other spatial organizations within the system of socio-territorial formations. This analysis suggests that the determinants of the development of EPS organizations are not homogeneous throughout the country. While certain factors, such as non-oil value added, show a consistent and positive pattern, others, such as the NBI or population dependence, show non-linear and territory-dependent spatial effects. Therefore, public policy aimed at promoting the EPS must be territorially differentiated. It is not enough to apply the same incentives in all cantons; it is necessary to understand how local socioeconomic factors interact in order to design more effective interventions.
The dependent variable number of non-financial EPS organizations per canton reflects a form of socially based economic articulation whose territorial expression is neither uniform nor random but is modulated by factors such as structural exclusion in the NBI index, the dependency ratio, and the conditions of local economic development established in the non-oil GVA.
Through the analysis of spatial weights and the use of a contiguity matrix based on the four nearest neighbors, it was possible to ensure an accurate representation of the spatial interactions for the previous exploratory analysis by means of the Moran I test, which showed that there are significant spatial patterns in the independent variables, suggesting that the relationships between these and the organizational presence of the EPS cannot be adequately represented by a constant global model. In this sense, the use of GWR made it possible to identify areas where these factors have a greater (or lesser) explanatory weight, providing more precise empirical evidence for the formulation of public policies with a differentiated territorial approach.
Consequently, research has highlighted the effectiveness of GWR as a spatial analysis tool. The results of the GWR show that the socioeconomic determinants of the development of EPS organizations do not operate uniformly throughout the territory. While non-oil VAB acts as a consistent positive factor, relative poverty and demographic structure present differentiated effects by canton, which underscores the need to adopt specific territorial strategies in public policies to promote the EPS.
[1] Duque, P., Meza, O.E., Giraldo, D., Barreto, K. (2021). Social economy and solidarity economy: A bibliometric analysis and literature review. REVESCO Revista de Estudios Cooperativos, 138(138): 1-25. https://doi.org/10.5209/REVE.75566
[2] Sarmiento-Torres, I., Sánchez-Ancajima, R., Ubillus-Agurto, E. (2024). Factores de desarrollo en la Economía popular y solidaria: Panorama evolutivo basado en análisis bibliométrico período 2003-2023. INNOVA Research Journal, 9(2): 167-187. https://doi.org/10.33890/innova.v9.n2.2024.2513
[3] Díaz Muñoz, J.G. (2015). Economías solidarias y territorio: Hacia un análisis desde la complejidad. Otra Economía, 9(17): 123-135. https://doi.org/10.4013/otra.2015.917.02
[4] Panch, E.P.T., Panchi, S.M.T., Córdova, J.L.M., Román, H.D.O. (2017). Economía solidaria: Estrategia alternativa para el desarrollo local. Visión Gerencial, (2): 313-323.
[5] Tello, M.D. (2006). Las teorías del desarrollo económico local y la teoría y práctica del proceso de descentralización en los países en desarrollo. Centrum, pp. 1-124.
[6] Vélez-Tamay, A., Carriel, V., Castillo-Ortega, Y. (2021). Índice de Desarrollo Local para Ecuador con datos del 2010. Desarrollo y Sociedad, (88): 83-127. https://doi.org/10.13043/dys.88.3
[7] Murillo, L. (2022). El emprendimiento social como motor de desarrollo sostenible: Propuesta de un modelo para fortalecer la gestión del impacto social en los grupos de interés. Universidad Politécnica de Valencia. España.
[8] de la Casa, J.H., Caballero, S.G. (2021). Communication of sustainable development goals in social economy organizations. CIRIEC-Espana Revista de Economia Publica, Social y Cooperativa, 101: 165-191. https://doi.org/10.7203/CIRIEC-E.101.18393
[9] Castiñeira, A.R. (2020). Social economy and the recovery of work in Uruguay. REVESCO. Revista de Estudios Cooperativos, 135: e69175. https://doi.org/10.5209/REVE.69175
[10] ESPAE, GEM Ecuador - ESPAE Escuela de Negocios, 2023. https://www.espae.edu.ec/gem-ecuador/, accessed on Nov. 07, 2024.
[11] Vargas-Hernández, J.G. (2011). Perspectivas de la posmodernidad institucional. Cuadernos de Filosofía Latinoamericana, 32(104): 121-127. https://doi.org/10.15332/s0120-8462.2011.0104.07
[12] Wanderley, F. (2015). Lectura desde América Latina Desafíos teóricos y políticos.
[13] Cejas, M.N., Demera, M.H.D., Loja, G.M.N. (2021). Trabajo decente y crecimiento económico en Ecuador: Un estudio jurídico y social. Revista Venezolana de Gerencia (RVG), 26(95): 578-594. https://doi.org/10.52080/rvgluz.27.95.9
[14] Calderón, A. (2021). Los desafíos del Ecuador para el cambio estructural con inclusión social. https://repositorio.cepal.org/server/api/core/bitstreams/a6c5ae7d-20ac-4379-9543-9cbb1c7833bf/content.
[15] Gallego-Bono, J.R., Tapia-Baranda, M.R. (2019). The values of the social economy as drivers of change in clusters with a strong fragmentation of knowledge: The case of sugar cane in Veracruz (Mexico) | Los valores de la economía social como impulsores del cambio en clústeres con fuerte fragmentación de. CIRIEC-España, Revista De economía Pública, Social Y Cooperativa, (97): 75-109. https://doi.org/10.7203/CIRIEC-E.97.14108
[16] Lorenzo, I.G. (2021). Expanded abstract the role of the Galician Cofradías in achieving the Sustainable Development Goals: Protection of marine resources and equity. CIRIEC-España, Revista De economía Pública, Social Y Cooperativa, 102: 97-122. https://doi.org/10.7203/CIRIEC-E.102.18388
[17] Coraggio, J. (2013). La Economía Popular y Solidaria El Ser Humano Sobre el Capital 2007–2013. Tercer Seminario Internacional: Rol de la Economía Popular y Solidaria y su aporte en el Sistema Económico Social y Solidario.
[18] Herrán Gómez, J. (2013). La economía popular y solidaria. Una práctica más que un concepto. Retos, 3(5): 35-42. https://doi.org/10.17163/ret.n5.2013.02
[19] Serrano, L.A.L., Carpio, G.E.B., Asanza, F.A.P. (2022). Evolución de la Economía Popular y Solidaria y su impacto en el desarrollo social-productivo del Ecuador, 2008-2021. Revista Ciencias Pedagógicas e Innovación, 10(2): 119-126. https://doi.org/10.26423/rcpi.v10i2.625
[20] AREPS. (2013). Agenda de la Revolución de la Economía Popular y Solidaria. pp. 1-321. https://bit.ly/422Pw73.
[21] CAF, Metodologia Del Índice Caf De Desarrollo Del Ecosistema Digital (Ided), CAF, 2017. https://cafscioteca.azurewebsites.net/handle/123456789/1052, accessed on Feb. 08, 2022.
[22] Estada, B.C., Avila, R.C. (2022). Local governments and policy to promote cooperatives and the social economy: Between a multilevel policy transmission channel and a proactive agent in the territorial ecosystem. The Valencian case | Gobiernos locales y política de fomento de las cooperate. REVESCO. Revista de Estudios Cooperativos, 142: e84392. https://doi.org/10.5209/REVE.84392
[23] LEXIS FINDER. (2010). Codigo Orgánico de Organizacion Territorial, COOTAD. https://www.cpccs.gob.ec/wp-content/uploads/2020/01/cootad.pdf.
[24] Balzarini, M., Bruno, C., Córdoba, M., Teich, I. (2015). Herramientas en el análisis estadístico multivariado. Escuela Virtual Internacional CAVILA. Facultad de Ciencias Agropecuarias, Universidad Nacional de Córdoba. Córdoba, Argentina.
[25] Buzai, G.D., Montes Galbán, E.J. (2021). Estadística espacial: fundamentos y aplicación con sistemas de información geográfica. https://www.researchgate.net/publication/357001572_Estadistica_Espacial_Fundamentos_y_aplicacion_con_Sistemas_de_Informacion_Geografica.
[26] Soriano, J.L., Mejía-Trejo, J. (2022). Modelado de ecuaciones estructurales en el campo de las Ciencias de la Administración. Revista de Métodos Cuantitativos para la Economía y la Empresa, 33: 242-263. https://doi.org/10.46661/revmetodoscuanteconempresa.5414
[27] Veracruzana, U. Metodología de diseño estadístico. https://www.uv.mx/personal/mojeda/files/2012/04/Metdisesta2012.pdf.
[28] Cabrero Ortega, M.Y., García Pérez, A. (2022). Análisis Estadístico de Datos Espaciales con QGIS YR. Editorial UNED.
[29] Bascuñán, M.M., Quezada, C.R. (2015). Regresión geográficamente ponderada para la modelación de la accesibilidad a la red hospitalaria en el área metropolitana de Concepción. Revista geográfica de Valparaíso, 52: 28-39.
[30] Gollini, I., Lu, B., Charlton, M., Brunsdon, C., Harris, P. (2015). GWmodel: An R package for exploring spatial heterogeneity using geographically weighted models. Journal of Statistical Software, 63: 1-50. https://doi.org/10.18637/JSS.V063.I17
[31] Superintendencia de Economía Popular y Solidaria, Estadísticas EPS – Portal Estadístico, 2023. https://estadisticas.seps.gob.ec/index.php/estadisticas-eps/, accessed on Jun. 30, 2023.
[32] INEC, Censo Ecuador, Censo Ecuador 2022, 2023. https://www.censoecuador.gob.ec/data-censo-ecuador/, accessed on Oct. 05, 2024.
[33] GADM. https://gadm.org/, accessed on Oct. 27, 2024.
[34] INEC, FICHA METODOLÓGICA DE INDICADOR Pobreza por Necesidades Básicas Insatisfechas (NBI). https://www.censoecuador.gob.ec/wp-content/uploads/2024/04/Porcentaje_de_personas_u_hogares_en_Pobreza_por_NBI.pdf, accessed on Mar. 26, 2025.
[35] Feres, J.C., Mancero, X. (2001). El método de las necesidades básicas insatisfechas (NBI) y sus aplicaciones en América Latina. Naciones Unidas, CEPAL, Division de Estadística y Proyecciones Económicas.
[36] INEC, FICHA METODOLÓGICA DE INDICADOR, 2022. https://www.censoecuador.gob.ec/wp-content/uploads/2023/09/3.-Relacio%CC%81n-de-dependencia-total_fn-2-ej.pdf.
[37] MPCEIP, Ficha Metodológica De Definición De Metas Del Plan Nacional De Desarrollo, 2021. https://www.produccion.gob.ec/wp-content/uploads/downloads/2022/06/Meta-2.2.4.pdf, accessed on Apr. 08, 2025.
[38] de Corso Sicilia, G.B., Rivera, M.P. (2017). Métodos gráficos de análisis exploratorio de datos espaciales con variables espacialmente distribuidas. Cuadernos Latinoamericanos de Administración, 13(25): 92-104. https://doi.org/10.18270/cuaderlam.v13i25.2417
[39] Ver Hoef, J.M., Cressie, N.A., Glenn-Lewin, D.C. (1993). Spatial models for spatial statistics: Some unification. Journal of Vegetation Science, 4(4): 441-452. https://doi.org/10.2307/3236071
[40] Rodríguez Jaume, M J., Mora Catalá, R. (2001). Capítulo 5 Análisis Exploratorio. Estadística Informática: Casos y ejemplos con el SPSS, Universidad de Alicante.