Arya Rezagama*![]() | Djoko Mulyo Hartono
| Djoko Mulyo Hartono![]() | Tri Edhi Budhi Soesilo
| Tri Edhi Budhi Soesilo![]() | Hayati Sari Hasibuan
| Hayati Sari Hasibuan![]()
© 2025 The authors. This article is published by IIETA and is licensed under the CC BY 4.0 license (http://creativecommons.org/licenses/by/4.0/).
OPEN ACCESS
This study investigated the challenges of ensuring sustainable access to clean water in Semarang City, Indonesia, with a focus on coastal areas, excessive groundwater extraction, distribution network leakage, and unique social conditions. A system dynamics model was developed to simulate various intervention scenarios, assessing the impacts of raw water reliability, leakage control, and industrial wastewater recycling. The novelty of this study lies in the comprehensive integration of these factors within an integrated modeling framework, enabling a holistic evaluation of future clean water availability under diverse policy interventions. The results indicate that, without significant intervention, Semarang City would face a significant water supply-demand gap by 2040. However, strategic investments in leakage control infrastructure and technologies, particularly under moderate and aggressive intervention scenarios, could achieve a water supply balance by 2039 and potentially generate a surplus by 2036. These findings emphasize the importance of technically and socially comprehensive water management strategies in ensuring long-term sustainability. This study provides a valuable decision-making framework for policymakers, offering actionable insights for the development of resilient and sustainable water resource management strategies in urban coastal areas.
groundwater sustainability, system dynamics modeling, urban water policy, water resource management
Many cities around the world are increasingly vulnerable to water-related risks. Trends in economic development, population growth, climate change, and urbanization will exacerbate the future water crisis. Urban areas account for approximately 50% of the global population and are projected to exceed 60% by 2050 [1, 2]. During the same period, global water demand is expected to increase by 55%, and around 4 billion people will reside in water-scarce areas [3]. These challenges position water issues among the highest global risks, potentially leading to significant physical, regulatory, and reputational risks. Such challenges may disrupt businesses, increase operational costs, and even result in the loss of operating licenses in water-stressed regions [4]. In Semarang City, these problems are further exacerbated by rapid population growth and excessive groundwater extraction, leading to land subsidence and saltwater intrusion, which compromise groundwater quality [5-7]. This situation is worsened by frequent tidal flooding, which threatens infrastructure and public health, making it difficult to provide adequate access to clean water [8, 9].
Water resilience in coastal metropolitan areas across various developing Asian countries is under significant threat due to factors such as population growth, increased groundwater extraction rates [10], rapid urbanization [11], land subsidence [12], water quality degradation [13], and climate change [14]. Urban areas consume 60-80% of total energy, including water. Hence, many urban residents face water scarcity [15]. As the urban population continues to grow, this scarcity is expected to worsen in the coming years [1, 16]. In Indonesia, despite the country's abundant water resources, water availability often does not align with adequate infrastructure, leading many residents to rely on groundwater [17]. The overexploitation of groundwater has resulted in various environmental issues, including land subsidence and saltwater intrusion [18, 19].
This study introduces a paradigm shift in water distribution management by developing a system dynamics model that integrates the complex interplay between social, technical, and environmental factors in urban coastal areas. Unlike traditional approaches that focus on isolated aspects of water management, such as water supply, tidal flooding, or groundwater depletion, this study adopts a comprehensive, multidisciplinary approach that considers the intricate connections between these components. By simulating the dynamics of these interactions, the model can capture the nonlinear effects of factors such as raw water reliability, water leakage rates, and industrial wastewater recycling rates on sustainable water resource development. Furthermore, this study's innovative approach allows for identifying critical thresholds and tipping points in the system, enabling the anticipation and mitigation of potential water crises. The model also facilitates the exploration of alternative scenarios and policy interventions, empowering stakeholders to make informed decisions about water resource management in urban coastal areas. By providing a more holistic and accurate understanding of water resource management, this study contributes to the development of sustainable and resilient water distribution systems that can support the well-being of urban coastal communities while safeguarding the environment. The findings have significant implications for policies and practices aimed at more effective, sustainable, and equitable management of water resources in urban coastal areas.
This study aims to simulate the impact of raw water reliability, water leakage rates, and industrial wastewater recycling rates on sustainable water resource development in urban coastal areas. Through the development of a system dynamics model, the study seeks to achieve a 100% water service level by 2040. Traditional methods, such as statistical analysis or mathematical modeling, often fail to capture the complex dynamics between various factors affecting water availability and quality. With their ability to simulate interactions and feedback loops between components, system dynamics offer a more accurate and effective approach to developing sustainable water management policies in urban coastal areas.
System dynamics is a theoretical framework that views complex systems as a set of interconnected components that interact and influence each other over time [20, 21]. This approach recognizes that systems are dynamic, nonlinear, and subject to feedback loops, which can lead to unintended consequences and emergent behavior [22]. In the context of water resource management, system dynamics can help identify the underlying structures and connections that drive the system's behavior and assist in designing more effective policies and interventions [23]. One of the key concepts in system dynamics is the idea of stocks and flows. Stocks represent the accumulation of resources or materials over time, while flows represent the rates of change of these stocks [24]. In the case of water resources, stocks might include the amount of water stored in reservoirs or aquifers, while flows could include the rates of water extraction, treatment, and distribution. By understanding the correlations between stocks and flows, system dynamics can help identify potential bottlenecks and constraints, as well as design more efficient and sustainable water management strategies [20].
Another important concept in system dynamics is the idea of feedback loops. It occurs when the output of a system is fed back into the system as input, creating a cycle of cause and effect [25]. In the context of water resource management, feedback loops might include the correlations between water extraction, water quality, and ecosystem health. For example, over-extraction of groundwater might lead to decreased water quality, affecting ecosystem health and biodiversity [26]. By identifying and understanding these feedback loops, system dynamics can help design more effective and sustainable water management strategies that account for the complex interactions between human and natural systems. System dynamics can also be used to model the behavior of complex systems over time, using techniques such as simulation modeling and scenario analysis [27]. These approaches can help identify future scenarios and outcomes, as well as evaluate the effectiveness of different policy interventions and management strategies [28]. By using system dynamics to model the behavior of water resource systems, researchers and policymakers can gain a better understanding of the complex interactions and connections that drive the system and design more effective and sustainable water management strategies. System dynamics provides a robust framework for understanding and managing complex systems, including water resource systems. Recognizing the interconnectedness and dynamics of these systems can help identify more effective and sustainable solutions to the water challenges facing urban coastal areas. Ultimately, by using system dynamics to model and analyze the behavior of water resource systems, researchers and policymakers can gain a better understanding of the complex interactions and connections that drive the system, enabling them to design more effective and sustainable water management strategies that support the well-being of human and natural systems.
The selected study area was the coastal city of Semarang and its surrounding regions, chosen for their unique characteristics shaped by the marine ecosystem and their specific challenges, including sea-level rise, saltwater intrusion, land subsidence, and other related issues [29]. Semarang City, which confronts significant challenges such as high tidal flooding and densely populated residential areas, was selected for this study due to these factors [30]. With a population of approximately 1.7 million, Semarang is a metropolitan city where most residents live in low-lying coastal areas, exacerbating the pressure on water resources [31]. This scenario is typical of northern coastal cities in Java, including Pekalongan, Cirebon, and Jakarta, among others [32]. Semarang City has a varied topography: the southern part, located at the foot of Mount Ungaran, rises to over 100 meters above sea level, while the northern part is relatively flat [33]. The coastal areas are predominantly inhabited by lower-middle-class populations, who often have limited access to water resources.
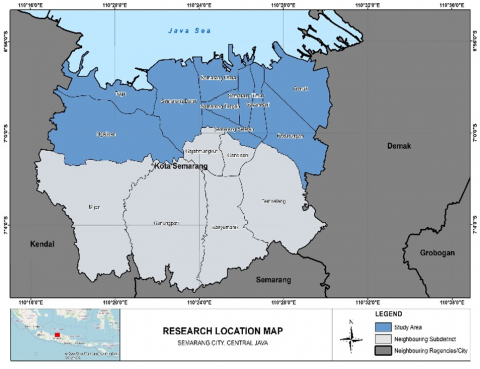
For the objective of this study, the focus was narrowed to the coastal areas influenced by the sea within the boundaries of the relevant sub-districts. Ten sub-districts met the selection criteria: Gayamsari, Genuk, Ngaliyan, Pedurungan, West Semarang, South Semarang, Central Semarang, East Semarang, North Semarang, and Tugu as presented in Figure 1. The location selection was further confined to the downstream areas, as each segment with a reservoir operates its own purification system, necessitating a separate model for analysis [34]. Geographically, the study area lies primarily within the Garang Watershed in Central Java Province, situated between 105° 41' 51"-109° 33' 33" East Longitude and 6° 45' 18"-7° 20' 45" South Latitude. This area covers 21,277.36 hectares, encompassing Semarang City, Semarang Regency, and Kendal Regency, with the Garang River serving as the main river. The Garang River stretches 40.53 kilometers in length, with a straight-line distance of only 26.83 kilometers from Mount Ungaran to the sea.
Figure 1. Study area
Data collection for this study involved primary and secondary data to support the analysis of water supply management in Semarang City as presented in Figure 2.
Figure 2. Sampling framework employed in the study
4.1 Study variables
The study focused on sustainable water supply management, specifically minimizing groundwater use and transitioning to surface or spring water to ensure long-term sustainability. Several key variables were identified and analyzed to achieve this goal. Raw water reliability was assessed by evaluating water availability during dry seasons, with an 80% reliability threshold from sources within Semarang City serving as the benchmark. Another crucial variable, water resource development, aimed to determine the raw water capacity needed to achieve 100% service coverage, emphasizing the importance of infrastructure planning and resource allocation. The study also examined industrial wastewater recycling, measuring the percentage of water that could be recycled and reused, thereby reducing overall water demand, particularly in industrial sectors. Water leakage control was another important variable, targeting reductions in leakage rates within the water distribution network, which is essential for improving system efficiency and minimizing water losses. Maintenance costs were analyzed to assess the financial sustainability of the water management system, calculated based on the volume of water sold and the associated maintenance costs per unit. Additionally, the study considered sustainable water supply, representing the total volume of raw water available for various uses, including domestic, industrial, and commercial purposes. Finally, well projections were included to estimate the number of active residential and industrial wells, which is crucial for assessing dependence on groundwater and progress toward reducing this reliance. These variables were modeled quantitatively using a system dynamics approach to predict trends and evaluate their impacts over time.
4.2 Data collection
Primary data were collected through in-depth interviews with key informants selected purposively based on their involvement and understanding of the program aimed at ensuring equal access to clean water. The informants included officials from drinking water companies and members of the deep-well user community in Semarang City. These primary data were analyzed qualitatively to critically assess the results of the system dynamics modeling under various potential scenarios.
Secondary data were sourced from relevant publications by government agencies, particularly the Semarang City Water Works and the Central Statistics Agency. Secondary data were compiled into a trend series, focusing on literature from the last 10 years (2013-2023), primarily sourced from the Scopus database.
4.3 Data processing
This study employed quantitative and qualitative methods for data processing. Quantitative data processing involved using the collected data as inputs for system dynamics simulations, which were essential for modeling various water management scenarios and predicting their outcomes. Community survey results were analyzed statistically to understand public perceptions and usage patterns. Software tools such as Powersim Studio and Microsoft Excel were utilized to develop and calibrate the system dynamics model. Excel was primarily used for preprocessing, cleaning, and organizing empirical data, including population statistics, household water consumption rates, historical water production data, and infrastructure coverage by district. These datasets were then transferred to Powersim to serve as baseline or exogenous inputs. In Powersim, key dynamic variables, such as projected water demand, raw water availability, household connection growth, groundwater extraction rates, and non-revenue water, were simulated over time using feedback loops, stock-flow relationships, and causal linkages. Parameters such as system leakage rate, per capita consumption, industrial wastewater recycling percentage, and the rate of groundwater-to-surface water conversion were modeled endogenously, enabling the simulation to estimate their evolution under different intervention scenarios.
Static or manually input variables included historical population data (2012-2021), baseline infrastructure capacity (e.g., treatment plant throughput), and fixed cost coefficients for water maintenance. Dynamic variables were modeled using differential equations and interlinked feedback mechanisms, accounting for physical infrastructure constraints and behavioral responses (e.g., connection rates responding to improvements in water availability). To operationalize the system dynamics modeling, empirical data were systematically converted into model variables through normalization, parameterization, and trend-based estimation techniques. For instance, raw water reliability was quantified as the percentage of time that raw water supply from surface or spring sources met monthly demand without interruption, based on a historical time series (2012-2021). A reliability threshold of 80% was established in line with Indonesian water utility standards. The model represented these parameters as functions that varied over time, depending on population changes, industry size, and raw water availability. Scenario-specific assumptions were incorporated into these base functions to reflect expected variations in reliability under pessimistic, moderate, and aggressive intervention scenarios.
Similarly, other empirical indicators (e.g., population served, well utilization rate, and non-revenue water) were converted into flows or stocks by calculating monthly or annual rates and embedding them in system behavior equations. Calibration was performed by comparing model outputs with historical trends to ensure the simulated system behavior aligned with observed data patterns.
To enhance transparency and replicability, Table 1 summarizes the key parameters used in the model, including their initial values, assumed constants, and sensitivity ranges applied during scenario testing. These parameters were derived from empirical data involving government reports or estimated based on literature and expert consultations.
5.1 Causal loop diagram of the water supply system
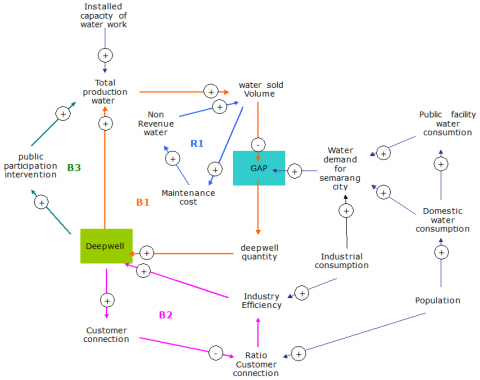
A Causal Loop Diagram (CLD) is a visual tool used in system dynamics modeling to map the correlations between variables within a system [35]. It consists of variables connected by arrows that indicate the direction of causality, with each arrow labeled with a "+" or "-" sign to denote whether the correlation is positive or negative. CLDs can be categorized into two main types of loops: reinforcing (R) loops and balancing (B) loops. Reinforcing loops are characterized by positive feedback, where an initial change in a variable leads to further changes in the same direction, creating a self-reinforcing cycle. Conversely, balancing loops are characterized by negative feedback, where an initial change in a variable induces changes in the opposite direction, creating a self-correcting cycle.
The CLD of the water supply system in Semarang City serves as a powerful tool for analyzing the complex correlations between various factors impacting the water supply system. By adopting a system dynamics approach, the CLD offers a comprehensive understanding of the feedback loops driving the system’s behavior and highlights potential leverage points for intervention to improve the sustainability of the water supply system. The CLD consists of four interconnected feedback loops that influence the system's overall behavior.
Figure 3. Causal loop diagram of sustainable coastal water supply
The first loop, B1, illustrates the interaction between the urban water supply network and the total urban water demand. This interaction leads to a gap in the supply of clean water extracted from underground sources. According to Lo and Purnomo [36], the use of private wells in coastal areas is a significant concern, as it can result in over-extraction of groundwater and land subsidence [36]. Analyzing this loop enables policymakers to devise strategies to encourage residents to switch to the municipal water supply, such as through educational campaigns or economic incentives.
The second loop, B2, demonstrates the correlation between industrial efficiency, the decline in the number of deep wells, and the increase in customer connections. This loop indicates that an increase in household connections will reduce reliance on private wells, thereby alleviating pressure on the water supply system. According to Carrard and Foster [10], increasing household connections is crucial in reducing the strain on water supply systems, as it promotes more efficient water use [10].
The third loop, R1, shows that increased water sales by the water company lead to higher maintenance costs, which, in turn, reduce water loss. Maintenance costs are critical in determining the sustainability of water supply systems, as they significantly impact the system's overall efficiency [37]. Policymakers can use this analysis to identify strategies for reducing maintenance costs, such as the adoption of more efficient technologies or the optimization of maintenance schedules.
The third loop, B3, represents the interaction between the urban water supply, raw water intake, and the river's carrying capacity, as depicted in Figure 3. It underscores the importance of considering the river's capacity when determining the sustainable water supply for cities. River capacity is a key factor in ensuring the sustainability of urban water supplies, as it impacts the resilience of the overall system [38].
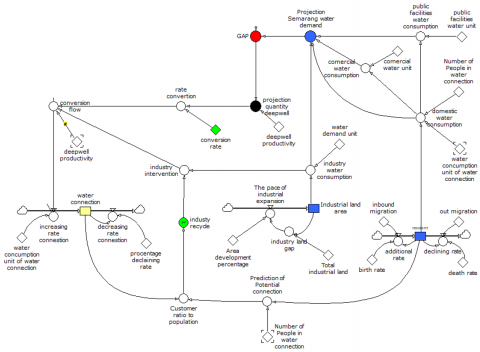
5.2 Stock and flow diagram (SFD)
The management of water supply and demand is a complex task that requires a deep understanding of the underlying system dynamics [39]. In the coastal area of Semarang, the water supply company is responsible for providing water to the local population, industries, and commercial areas. However, the increasing demand for water coupled with the limited supply has created a significant challenge. To address this challenge, a system dynamics approach was applied to develop the SFD of the water supply and demand system. The SFD is an effective tool for analyzing complex systems and identifying leverage points for improvement [40]. The SFD was built based on the CLD, capturing the connections between various components of the system, including water supply, demand, and infrastructure [41].
Figure 4 shows that the SFD consisted of 23 variables, 28 constants, and 5 stocks, representing the different components of the system. The model was initialized with data from 2012 and ran over a period of 14 years, from 2012 to 2023. The SFD is designed to simulate the system's behavior over time, considering the various feedback loops and interactions among the different components. The SFD demonstrates a goal-seeking behavior in the system, where the system seeks to achieve a balance between water supply and demand [42]. The model shows that the system operated within a negative feedback loop, where the difference between water supply and demand drove the system to adjust and attempt to reach equilibrium. This feedback loop is a fundamental feature of the system, as it enables the water supply company to respond to fluctuations in demand and adjust its supply accordingly. The SFD also identifies several leverage points for improving the system, including the development of alternative water sources, the enhancement of water efficiency, and the reduction of NRW [43]. These interventions can help increase the water supply, decrease demand, and improve the overall sustainability of the system [44].
5.3 Validity test
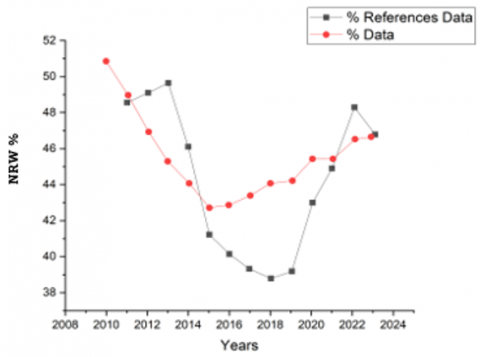
Visual validation was performed by comparing empirical data with the simulation results generated by the model. The primary goal was to assess the alignment between the simulated behavior and observed reference patterns, particularly focusing on key components such as population growth, increases in production capacity by the water company, the number of household connections, and the rate of water leakage. The model’s simulation successfully captured these trends.
Additionally, the model accurately reflected the significant increase in the water supply company's water processing capacity, driven by government initiatives such as the construction of the Jatibarang Reservoir in 2018. This development boosted the supply by 1,000 liters per second. Improvements to the Klambu-Kudu raw water pipeline system also enhanced the reliability of the Kudu Water Treatment Plant, increasing its supply capacity to 1,250 liters per second. The visual comparison in Figure 5 demonstrates that the model successfully replicated the empirical trends in water leakage rates, capturing fluctuations over the observed period, particularly the spike in leakage rates in 2020 due to increased network pressure. Over the ten-year period, water leakage rates fluctuated around 40%. This variability was affected by factors such as the increased pressure in the existing network following the integration of the Jatibarang water supply, which contributed to higher leakage rates in 2020. Furthermore, the water supply company's policy of continuous service delivery also played a role in this trend. Meanwhile, Figure 6 illustrates the model's ability to accurately simulate the increasing trend of household connections over time, reflecting the expansion of service coverage and infrastructure improvements made by the water supply system. The number of household connections consistently rose over the decade, in alignment with the increasing availability of water. The expansion of service into new areas and improvements in already-served regions were effectively mirrored in the model. A summary of the empirical and simulated data used for visual validation is presented in Appendix Table A.
Statistical validation was conducted by calculating the Mean Absolute Error (MAE) for the variables under study, including population growth, the water supply system’s production capacity, the number of household connections, and the water leakage rate. The MAE values were calculated using Microsoft Excel, which facilitated data preprocessing and error calculation by comparing empirical values with simulated outputs. The software’s formula-based environment allowed for transparent, step-by-step calculations of the absolute deviations and their average.
The results indicated that the MAE for the population of Semarang City was 1.89%; for Water work’s capacity, it was 3.49%; for the rate of water leakage, it was 5.76%; and for household connections, it was 7.05%. All these values were within the acceptable limits for model validity, with thresholds defined as less than 10% for controlled variables (such as those in a factory or laboratory setting) and less than 30% for less controlled variables (such as those affected by climate or market conditions). Based on these validation results, the water resource development model for the coastal areas of Semarang was deemed valid, successfully replicating the actual system's performance. Therefore, it is considered suitable for use in further intervention scenarios. This robust validation process ensures that researchers can account for uncertainties in real-world situations, enabling more realistic assessments of algorithm performance.
However, several limitations of the validation process should be acknowledged. Certain input variables, such as groundwater conversion rates and reductions in non-revenue water, were derived from assumptions or expert judgment due to the limited availability of disaggregated local data. Moreover, the model is moderately sensitive to specific parameters, including leakage rates and household connection growth, which could impact long-term projections under unexpected future conditions. While the model provides a reliable approximation of system behavior, its outputs should be interpreted cautiously and refined as more precise or updated data become available.
Figure 4. Stock and flow diagram model-Business as usual
Figure 5. Comparison graph of modeling results with empirical data for the water leakage rate process
Source: Author, 2025
Figure 6. Comparison graph of modeling results with empirical data for household connections
Source: Author, 2025
5.4 Prediction of water demand discrepancy
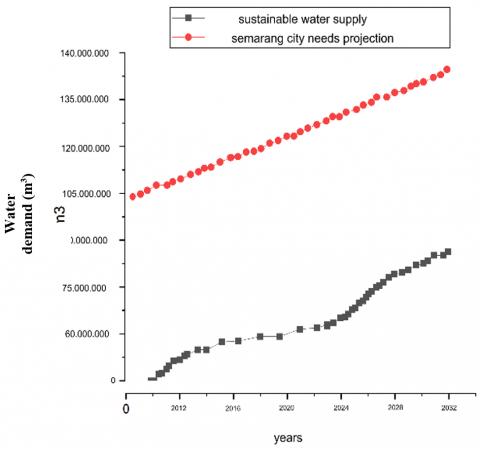
Semarang City, located in Indonesia, faces a significant challenge in meeting its water demands due to rapid population growth, industrialization, and urbanization. Correspondingly, the present study aimed to analyze the water demand and supply gap in Semarang City, employing a system dynamics approach. The model simulated the city's water system, incorporating factors such as population growth, water supply, demand, and the carrying capacity of the nearby river. According to the projections, the population of Semarang City was expected to reach 1,018,791 people by 2024, with a growth rate of 0.14% per year (see Figure 7). This growth was affected by government policies aimed at mitigating flooding and tidal flooding (rob), as well as the development of industrial areas [5]. The increasing population would lead to a rise in water demand, which was projected to reach 88 million m³/year by 2040. This surge in demand was driven by the expanding needs of the population, industry, and commercial sectors. The water demand projection indicated a significant increase in the industrial and commercial sectors, accounting for approximately 60% of the total water demand by 2040. This rise was attributed to the rapid industrialization and urbanization of the city, which led to an increase in the number of factories, offices, and other commercial establishments. The residential sector would account for around 30% of the total water demand, while the remaining 10% would be attributed to sectors such as agriculture and public services.
Figure 7. The water demand gap under the business-as-usual scenario
The model results presented in Figure 7 illustrate the growing discrepancy between water supply and demand under the business-as-usual scenario. The gap, which widened significantly after 2027, reflects the combined pressures of population growth and limited infrastructure improvements, underscoring the urgency for intervention strategies. The water supply from the nearby river was limited, with a carrying capacity of 70 million m³/year. This capacity was determined by the river's dependable flow, representing the amount of water that could reliably be supplied during the dry season. The river's carrying capacity was expected to reach a critical point by 2027, with a 90% exploitation rate of the river's dependable flow [45]. This highlights the need for water resource development, such as the construction of dams and reservoirs, to store water during the rainy season for use during the dry season. The water demand and supply gap was projected to widen further due to the increasing population and water demand, potentially leading to over-extraction of groundwater. This, in turn, would exacerbate the existing problems of land subsidence and flooding [46]. The gap was expected to reach approximately 18 million m³/year by 2040, constituting about 25% of the total water demand, as shown in Figure 7. This gap must be addressed through a combination of water conservation measures, water recycling, and new water sources. The model also predicted a significant decrease in the number of wells in Semarang City by 2027, dropping from 250 to 210 due to the over-extraction of groundwater. This decrease could be attributed to government efforts to reduce groundwater extraction and promote the use of surface water. However, the over-extraction of groundwater remains a significant concern, as it can lead to land subsidence, flooding, and saltwater intrusion into the aquifer. The water distribution system in Semarang City also encounters challenges, with a high water loss rate of 45% [47]. This inefficiency can lead to increased maintenance costs and potentially result in more customers being disconnected from the water supply. The distribution system needs to be improved by replacing old pipes, installing new meters, and implementing a more efficient billing system.
The increasing water demand and supply gap, coupled with the limited carrying capacity of the nearby river, necessitate the development of sustainable water resources, such as dams and reservoirs. Additionally, efforts to reduce groundwater extraction and improve the efficiency of the water distribution system are crucial to mitigating the water scarcity issue in Semarang City. Based on the findings of this study, several recommendations are proposed to enhance water resource management in urban coastal areas. Developing sustainable water resources, such as dams and reservoirs, is essential to increasing the water supply and reducing reliance on groundwater. Water conservation measures, including water-saving appliances and rainwater harvesting, can effectively reduce water demand. Moreover, improving the efficiency of the water distribution system is necessary, which can be achieved by replacing old pipes, installing new meters, and implementing a more efficient billing system. Promoting the use of surface water while reducing groundwater extraction is also recommended to prevent land subsidence and flooding. Ultimately, developing a comprehensive water management plan that incorporates these strategies is vital for ensuring the long-term sustainability of the water supply system.
5.5 Formulating strategic scenarios for sustainable water resource development
The CLD presented offers a comprehensive visualization of the complex dynamics involved in managing sustainable water resources in urban coastal areas such as Semarang City. At the core of the diagram is the goal of achieving a Sustainable Urban Water Supply. This central objective is affected by several critical factors, including the river carrying capacity, which is directly impacted by the raw water extraction rate. As water is extracted, the river’s ability to sustain a continuous and reliable water supply diminishes, making it essential to carefully balance extraction with the river's natural capacity. One of the significant challenges highlighted in the diagram is the NRW, which refers to water lost before it reaches customers due to leaks, theft, or inefficiencies. High levels of NRW not only waste valuable resources but also undermine the overall effectiveness of the water supply system. To address this, reducing NRW through infrastructure upgrades, such as replacing aging pipes and implementing smart water management systems, is vital. This effort is closely linked to the system’s overall efficiency and long-term sustainability.
Figure 8. Stock and flow diagram: Acceleration of the urban water system subsystem, NRW declining subsystem, and public intervention subsystem
The diagrams as presented in Figure 8 and Figure 9 underscore the importance of water resource development, including the creation of new water sources or the enhancement of existing ones to meet the growing demand. Without significant investment in this area, the current water infrastructure might fail to meet the city’s future needs, potentially leading to a severe water crisis. Additionally, the projected coastal city water demand, which accounts for future water needs based on population growth and industrial activities, highlights the necessity for proactive water resource management. Several balancing loops within the CLD illustrate the intricate interactions between various system components.
Over-extraction of groundwater can significantly reduce the river’s carrying capacity, leading to long-term environmental degradation and threatening the sustainability of the water supply. Therefore, strict regulations and careful management practices are essential to maintain a balance between water extraction and the health of natural water sources. The diagram also emphasizes the importance of increasing household connections to reduce reliance on private wells, particularly in coastal areas. Expanding household connections can help mitigate issues like land subsidence and saltwater intrusion, which are exacerbated by excessive groundwater extraction.
Strategic scenario formulation is critical in managing and developing sustainable water resources, particularly in regions facing complex environmental and urban challenges like Semarang City. This process involves creating potential scenarios based on current data, trends, and uncertainties, followed by developing strategies to mitigate risks or capitalize on opportunities presented by each scenario. The objective is to ensure that water resources are managed in a way that is adaptable to future changes and continues to meet the needs of the population.
The pessimistic scenario projected growth based on historical data, relying on existing infrastructure. In this scenario, the Jragung Dam was expected to become operational in 2024, increasing the supply capacity by 500 liters per second (l/s) and extending services to the eastern part of Semarang. The distribution network construction was expected to take an additional three years to be completed in 2027. The water leakage rate was targeted to be reduced to 38%, consistent with the rate observed in 2018. This reduction assumed the water company could decrease leakage through pressure and supply management without major pipeline renovations. The groundwater conversion rate was projected to remain at approximately 12%, reflecting the current situation. Recycled water usage was forecasted at 10%, with potential reductions through efficiency improvements and industrial rainwater harvesting.
Figure 9. Stock and flow diagram: Acceleration of deep well reduction, industry efficiency subsystem, and projection of demand
The medium scenario represented a realistic projection of the water company's growth, taking into account the current state of infrastructure, financial constraints, human resources, and standard practices in Indonesia. Following the completion of the Jragung Dam in 2027, the water company could potentially extract an additional 300 l/s from the West Canal Barrage. However, the water treatment technology must adapt to seasonal brackish conditions. The leakage rate was projected to reach 33%, aligning with the national average for water companies in 2018. Significant efforts would be required to reduce leakage, including extensive pipeline renovations. The groundwater conversion rate remained at 12%, and recycled water usage was expected to increase to 32%. This increase could be achieved through centralized water treatment systems in industrial zones, particularly if the cost of clean water surpasses the cost of recycled water treatment.
The aggressive scenario outlined an ideal growth projection for the water company based on advanced theories, policies, and standards from developed countries. The water supply sources remained consistent with the medium scenario, drawing from the Jragung Dam and the Brackish Water Reverse Osmosis (BWRO) system at the West Canal Barrage. The leakage rate was ambitiously targeted at 20%, aligning with national goals. This reduction would require comprehensive pipeline overhauls, advanced control systems, and highly skilled human resources. Recycled water usage was projected to reach 40%, with the goal of implementing extensive water recycling across all industries in Semarang.
These scenarios were built upon previous studies addressing water resource challenges in urban areas. The pessimistic scenario aligns with historical approaches, which often relied on existing infrastructure and minimal interventions. However, it contrasts with studies emphasizing the need for proactive measures to mitigate future water crises, such as those by Stephan and Stephan [4], who highlighted the risks of maintaining the status quo in water management. The medium scenario reflects a more balanced approach, similar to strategies discussed by Molle and Closas [17], who advocated for realistic yet ambitious targets in water management, considering local conditions and constraints. The emphasis on reducing leakage to the national average mirrors efforts in other regions to optimize existing systems rather than solely focusing on new infrastructure. The aggressive scenario is inspired by the standards seen in developed countries, as discussed by Leal Filho et al. [14]. It represents an idealistic approach, pushing the boundaries of current capabilities in Indonesia. While ambitious, it draws parallels with international best practices in water resource management, where advanced technologies and comprehensive system overhauls are employed to achieve significant improvements in sustainability and efficiency. To enhance the clarity and comparability of these scenarios, Table 1 presents a side-by-side summary of the main assumptions, intervention strategies, and projected outcomes for each scenario. This comparative view provides a valuable reference for decision-makers evaluating the potential impacts of each strategic path.
Table 1. Stock and flow diagram of an effective service delivery model for accelerating equitable access to sustainable urban drinking water
|
Output |
Intervention Variable |
Parameter Value |
Intervention Value |
Policy Basis |
|
|
Initial |
Final |
||||
|
Pessimistic scenario |
|||||
|
Public participation |
Subsidy cost, education |
0 |
0 |
0 |
In accordance with the annual growth rate of PERUMDAM at 4.2% |
|
Leakage rate |
Water leakage level |
44.75% |
38% |
6.75% |
The value achieved in 2018 |
|
Industrial intervention |
Water sharing |
0% |
0% |
0% |
In accordance with the existing conditions |
|
Medium scenario |
|||||
|
Public participation |
Subsidy cost, education |
0 |
25% of annual growth |
25% of 4.2% |
An additional 25% subsidy from the 4.2% annual growth rate |
|
Leakage rate |
Water leakage level |
44.75% |
33% |
11.75% |
The average water loss rate of PERUMDA in Indonesia in 2018 |
|
Industrial intervention |
Water sharing |
0% |
10% |
10% |
In accordance with SIPA regulations for the community |
|
Aggressive scenario |
|||||
|
Public participation |
Subsidy cost, education |
0 |
50% of annual growth |
50% of 4.2% |
The rubber dam on the flood canal is already available and requires optimization study |
|
Leakage rate |
Water leakage level |
44.75% |
20% |
24.75% |
The national target set by the government |
|
Industrial intervention |
Water sharing |
0% |
25% |
25% |
The implementation of corporate sharing principles with the community |
5.6 Model outcomes and implications for sustainable water resource management
The simulation model for Semarang City's water resource management provides valuable insights into projected water demand, supply, and the corresponding gaps across three scenarios: pessimistic, medium, and aggressive. The model results, detailed in the supplementary material, illustrate how varying intervention levels impact water resources' sustainability over time. The projections reveal a consistent increase in water demand across all scenarios. In the pessimistic scenario, water demand was expected to rise from approximately 81 million cubic meters in 2012 to over 87 million cubic meters by 2040. The medium scenario followed a similar trajectory, with slight variations due to more optimistic assumptions about population growth and industrial demand. Despite its higher efficiency targets, the aggressive scenario also showed an increase in demand, albeit at a slower pace. Water supply projections indicate a more varied outcome across the scenarios. The pessimistic scenario showed a modest increase in supply, constrained by limited infrastructure improvements and conservative management practices. By 2040, the supply would reach approximately 79.5 million cubic meters, resulting in a persistent shortfall. In contrast, the medium scenario anticipated significant infrastructure enhancements, such as the completion of the Jragung Dam in 2027 and the use of additional water sources, which would increase the supply to around 88.2 million cubic meters by 2040. The aggressive scenario represents the most optimistic projection, forecasting a supply of nearly 100 million cubic meters by 2040, driven by extensive technological adoption, including the BWRO system.
The gap between water demand and supply is a critical indicator of the system's sustainability. In the pessimistic scenario, the gap remained significant throughout the projection period, with a shortfall of approximately 7.9 million cubic meters by 2040. The medium scenario narrowed this gap, achieving balance by 2039. The aggressive scenario, however, eliminated the gap by 2036 and resulted in a surplus, indicating a highly sustainable water management strategy. Furthermore, NRW represents losses due to leaks and inefficiencies and is a critical factor across all scenarios. In the pessimistic scenario, NRW was reduced to 38% by 2040, reflecting minimal improvements. The medium scenario achieved a reduction to 33%, aligning with national averages. The aggressive scenario set an ambitious target of 20%, requiring significant investments in infrastructure and management systems. These reductions in NRW directly contributed to the increased availability of water in the medium and aggressive scenarios.
The results of this study underscore the importance of strategic investments in infrastructure and technology for sustainable water resource management. The persistent shortfall in the pessimistic scenario highlights the risks of underinvestment and reliance on existing infrastructure, which is insufficient to meet the growing demand in Semarang City. This scenario aligns with findings from studies such as those by Stephan and Stephan [4], who warned of the dangers of maintaining the status quo in water management, particularly in rapidly urbanizing regions. The medium scenario represents a more balanced approach, combining realistic investments with targeted improvements in efficiency. This scenario mirrors strategies discussed by Molle and Closas [17], who advocated for the adoption of practical yet forward-thinking water management practices. The alignment of the medium scenario's NRW target with national averages also reflects broader trends in water management within Indonesia, where efforts to reduce water losses are increasingly prioritized.
The aggressive scenario demonstrates the potential of adopting advanced technologies and comprehensive infrastructure overhauls to achieve long-term sustainability. The projected surplus in water supply by 2036 in this scenario is indicative of the benefits of a proactive approach, as also highlighted by Leal Filho et al. [14], who emphasized the role of technological innovation in addressing global water challenges. The ambitious NRW reduction target in this scenario underscores the critical role of efficiency in water management, as reducing losses is often more cost-effective than expanding supply. However, the aggressive scenario also raises important considerations regarding the financial and operational feasibility of such an approach. The significant increase in maintenance costs projected for this scenario, particularly between 2032 and 2040, reflects the substantial investments required to achieve these targets. This aligns with the findings that reducing NRW to minimal levels requires considerable financial and human resources, making it a challenging yet crucial goal for water utilities.
In terms of real-world feasibility, the pessimistic and medium scenarios are more aligned with current trends and institutional capacities in Semarang. The pessimistic scenario reflects business-as-usual growth and assumes minimal capital investment, while the medium scenario incorporates realistic, policy-aligned improvements in infrastructure and management. The aggressive scenario, although technically possible, presents significant implementation challenges. Achieving an NRW rate of 20% by 2040 would require substantial capital investment, robust regulatory enforcement, advanced metering infrastructure, and continuous capacity building within water companies. While some Indonesian cities have made progress in NRW reduction through international partnerships and performance-based contracts, replicating such success in Semarang will depend on sustained political will, cross-sector collaboration, and external funding. Therefore, while the aggressive scenario is aspirational and practical for long-term strategic planning, the medium scenario represents a more actionable pathway under current resource constraints.
As shown in Figure 10, the model projected a decline in active wells across all scenarios, reflecting the anticipated reduction in groundwater reliance. The aggressive scenario predicted the sharpest reduction, aligning with policy efforts to transition toward surface water use.
Several key barriers could impede the realization of the aggressive scenario. Financially, the scenario demands sustained high levels of capital investment in pipeline rehabilitation, advanced metering systems, and industrial-scale water recycling infrastructure, resources that might exceed current municipal or utility-level budgets. Institutionally, water companies would require enhanced technical capacity, strengthened regulatory frameworks, and improved inter-agency coordination to execute such complex interventions. Additionally, limitations in data quality, monitoring systems, and skilled personnel could undermine efforts to implement performance-based water loss management or operate high-efficiency treatment technologies. Technical challenges related to maintaining membrane filtration systems, managing high-salinity inputs for reuse, and ensuring system resilience during climatic variability also pose considerable risks.
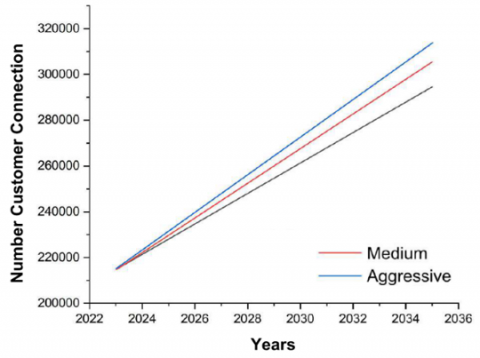
The projection results presented in Figure 11 illustrate that customer connections increased steadily across all scenarios, with the most substantial growth observed in the aggressive scenario. This trend supports the expected improvements in service coverage and water access reliability associated with more ambitious intervention strategies. Empirical evidence from other urban water utilities demonstrates the feasibility of implementing similar strategies under appropriate institutional conditions. For example, the Phnom Penh Water Supply Authority (PPWSA) in Cambodia successfully reduced its NRW from over 70% in the early 1990s to less than 10% by 2010 through a combination of full metering, targeted leakage control, capacity building, and governance reform. In the context of water reuse, Singapore’s Public Utilities Board (PUB) has achieved global recognition for its NEWater initiative, supplying over 40% of the country’s water demand using advanced membrane technologies and rigorous quality control. Closer to Indonesia, Surabaya City has implemented decentralized wastewater recycling systems to support industrial operations and reduce reliance on centralized supply. These international examples indicate that ambitious performance improvements in water management, such as NRW reduction and large-scale recycled water use, are attainable when supported by coherent policy frameworks, adequate investment, and stakeholder engagement. Semarang may leverage such models to design context-sensitive strategies that balance ambition with implementation feasibility.
Figure 10. Projection graph of the number of wells under pessimistic, medium, and aggressive scenarios
Source: Author, 2025
Figure 11. Projection graph of customer connections under pessimistic, medium, and aggressive scenarios
Source: Author, 2025
This study explored the complex dynamics of water resource management in Semarang City, an urban coastal area confronting significant environmental and infrastructural challenges. Through the development and simulation of a system dynamics modeling, the research provides critical insights into how various factors, such as raw water reliability, water leakage rate, and industrial wastewater recycling, affected the sustainability of the city's water resources. The novelty of this study lies in its integrated approach, which combined multiple variables into a single dynamic model, offering a holistic understanding of water management in a coastal urban context. The results indicate that the current trajectory, represented by the pessimistic scenario, would be insufficient to meet the future water demand of Semarang City, leading to a significant supply-demand gap by 2040. However, the study also identified viable pathways to mitigate this impending crisis. Key findings demonstrate that moderate investments in infrastructure and efficiency improvements (medium scenario) could achieve a balanced water supply by 2039. In contrast, aggressive strategies involving advanced technologies and comprehensive reforms could meet future demands and create a surplus by 2036.
These findings highlight the importance of adopting a proactive and integrated approach to water resource management in Semarang City, considering the long-term impacts of current policies and infrastructure investments. Policymakers and water managers are encouraged to implement the strategies identified in the medium and aggressive scenarios to secure a sustainable water future for the city. The study's comprehensive approach and detailed scenario simulations provide a valuable framework for informed decision-making and policy formulation, contributing to the broader discourse on urban water management in coastal regions. Furthermore, this study offers a robust framework that can be adapted to other coastal cities facing similar challenges.
The authors would like to express gratitude to Universitas Diponegoro for providing the scholarship that supported this research.
Appendix Table A. Statistical validation of sustainable coastal water supply model
|
Year |
Total Population of Semarang City (people) |
PERUMDA Capacity (m³/year) |
Change in Water Leakage Rate Value (5) |
Household Connection (HC) |
||||
|
Reference Data |
Simulation Data |
Reference Data |
Simulation Data |
Reference Data |
Simulation Data |
Reference Data |
Simulation Data |
|
|
2012 |
1.013.103 |
1.013.103 |
102.555.072 |
102.555.072 |
43.3 |
43.3 |
94.042 |
94.042 |
|
2013 |
1.016.970 |
1.013.306 |
103.217.328 |
105.567.491 |
41.8 |
43.4 |
108.401 |
99.534 |
|
2014 |
1.013.103 |
1.013.508 |
105.109.488 |
108.492.354 |
42 |
43.5 |
117.042 |
104.760 |
|
2015 |
1.022.800 |
1.013.711 |
108.389.232 |
111.334.124 |
41.2 |
43.6 |
123.899 |
109.733 |
|
2016 |
1.024.201 |
1.013.914 |
112.142.016 |
114.097.032 |
40.1 |
43.6 |
126.388 |
114.465 |
|
2017 |
1.105.831 |
1.014.117 |
115.106.400 |
116.785.088 |
39.14 |
43.7 |
133.180 |
118.969 |
|
2018 |
1.050.230 |
1.014.319 |
106.780.896 |
119.402.093 |
38.73 |
43.8 |
133.494 |
123.256 |
|
2019 |
1.067.320 |
1.014.522 |
106.339.392 |
121.950.518 |
39.1 |
43.9 |
135.260 |
127.334 |
|
2020 |
1.011.151 |
1.014.725 |
125.639.424 |
124.432.434 |
42.94 |
44.0 |
136.399 |
131.211 |
|
2021 |
1.010.842 |
1.014.928 |
127.310.832 |
126.849.741 |
44.8 |
44.1 |
137.877 |
134.894 |
|
Average |
1.033.555 |
1.014.015 |
111.259.008 |
115.146.595 |
41 |
44 |
124.598 |
115.820 |
|
MEA |
1.89% |
3.49% |
5.76% |
-7.05% |
||||
[1] He, C., Liu, Z., Wu, J., Pan, X., Fang, Z., Li, J., Bryan, B.A. (2021). Future global urban water scarcity and potential solutions. Nature Communications, 12(1): 4667. https://doi.org/10.1038/s41467-021-25026-3
[2] Boretti, A., Rosa, L. (2019). Reassessing the projections of the world water development report. NPJ Clean Water, 2(1): 15. https://doi.org/10.1038/s41545-019-0039-9
[3] Mekonnen, M.M., Hoekstra, A.Y. (2016). Four billion people facing severe water scarcity. Science Advances, 2(2): e1500323. https://doi.org/10.1126/sciadv.1500323
[4] Stephan, A., Stephan, L. (2017). Life cycle water, energy and cost analysis of multiple water harvesting and management measures for apartment buildings in a Mediterranean climate. Sustainable Cities and Society, 32: 584-603. https://doi.org/10.1016/j.scs.2017.05.004
[5] Warsilah, H. (2023). Building resilient city in coastal urban areas: Case study of community adaptation and response toward climate change and tidal floods in Semarang, Indonesia. In Climate Change, Community Response and Resilience. Elsevier, pp. 75-92. https://doi.org/10.1016/B978-0-443-18707-0.00004-7
[6] Aditiya, A., Ito, T. (2023). Present-Day land subsidence over Semarang revealed by time series InSAR new small baseline subset technique. International Journal of Applied Earth Observation and Geoinformation, 125: 103579. https://doi.org/10.1016/j.jag.2023.103579
[7] Nillesen, A.L., zum Felde, M., Pfannes, E., Meyer, H., Klijn, O. (2021). Water as leverage: Design studies for khulna, chennai and semarang. SeaCities: Urban Tactics for Sea-Level Rise, Springer, Singapore, 133-169. https://doi.org/10.1007/978-981-15-8748-1_6
[8] Allen, T.R., Crawford, T., Montz, B., Whitehead, J., Lovelace, S., Hanks, A.D., Christensen, A.R., Kearney, G.D., Kearney, G.D. (2019). Linking water infrastructure, public health, and sea level rise: Integrated assessment of flood resilience in coastal cities. Public Works Management & Policy, 24(1): 110-139. https://doi.org/10.1177/1087724X18798380
[9] Ashrafuzzaman, M., Gomes, C., Guerra, J. (2023). The changing climate is changing safe drinking water, impacting health: A case in the southwestern coastal region of Bangladesh (SWCRB). Climate, 11(7): 146. https://doi.org/10.3390/cli11070146
[10] Carrard, N., Foster, T., Willetts, J. (2019). Groundwater as a source of drinking water in Southeast Asia and the pacific: A multi-country review of current reliance and resource concerns. Water, 11(8): 1605. https://doi.org/10.3390/w11081605
[11] Chan, F.K.S., Chuah, C.J., Ziegler, A.D., Dąbrowski, M., Varis, O. (2018). Towards resilient flood risk management for Asian coastal cities: Lessons learned from Hong Kong and Singapore. Journal of Cleaner Production, 187: 576-589. https://doi.org/10.1016/j.jclepro.2018.03.217
[12] Esteban, M., Takagi, H., Jamero, L., Chadwick, C., Avelino, J.E., Mikami, T., Fatma, D., Yamamoto, L., Thao, N.D., Onuki, M., Woodbury, J., Valenzuela, V.P.B., Crichton, R.N., Shibayama, T. (2020). Adaptation to sea level rise: Learning from present examples of land subsidence. Ocean & Coastal Management, 189: 104852. https://doi.org/10.1016/j.ocecoaman.2019.104852
[13] Hamel, P., Tan, L. (2022). Blue-Green infrastructure for flood and water quality management in Southeast Asia: Evidence and knowledge gaps. Environmental Management, 69(4): 699-718. https://doi.org/10.1007/s00267-021-01467-w
[14] Leal Filho, W., Balogun, A.L., Olayide, O.E., Azeiteiro, U.M., Ayal, D.Y., Muñoz, P.D.C., Nagy, G.J., Bynoe, P., Oguge, O., Toamukum, N.Y., Saroar, M., Li, C. (2019). Assessing the impacts of climate change in cities and their adaptive capacity: Towards transformative approaches to climate change adaptation and poverty reduction in urban areas in a set of developing countries. Science of The Total Environment, 692: 1175-1190. https://doi.org/10.1016/j.scitotenv.2019.07.227
[15] Hou, J., Yang, X., Chen, C. (2018). Emerging trends and new developments in information science: A document co-citation analysis (2009-2016). Scientometrics, 115: 869-892. https://doi.org/10.1007/s11192-018-2695-9
[16] Du, S. (2020). Life cycle assessment of a new steel-making process for sustainable steel industrial development in China. In Journal of Physics: Conference Series. IOP Publishing, 1699(1): 012005. https://doi.org/10.1088/1742-6596/1699/1/012005
[17] Molle, F., Closas, A. (2020). Why is state‐Centered groundwater governance largely ineffective? A review. Wiley Interdisciplinary Reviews: Water, 7(1): e1395. https://doi.org/10.1002/wat2.1395
[18] El Shinawi, A., Kuriqi, A., Zelenakova, M., Vranayova, Z., Abd-Elaty, I. (2022). Land subsidence and environmental threats in coastal aquifers under sea level rise and over-pumping stress. Journal of Hydrology, 608: 127607. https://doi.org/10.1016/j.jhydrol.2022.127607
[19] Xiao, H., Tang, Y., Li, H., Zhang, L., Ngo-Duc, T., Chen, D., Tang, Q. (2021). Saltwater intrusion into groundwater systems in the Mekong Delta and links to global change. Advances in Climate Change Research, 12(3): 342-352. https://doi.org/10.1016/j.accre.2021.04.005
[20] Rebs, T., Brandenburg, M., Seuring, S. (2019). System dynamics modeling for sustainable supply chain management: A literature review and systems thinking approach. Journal of Cleaner Production, 208: 1265-1280. https://doi.org/10.1016/j.jclepro.2018.10.100
[21] McGill, E., Er, V., Penney, T., Egan, M., White, M., Meier, P., Whitehead, M., Lock , K., de Cuevas, R.A., Smith, R., Savona, N., Rutter , H., Marks , D., de Vocht, F., Cummins, S., Popay, J., Petticrew, M. (2021). Evaluation of public health interventions from a complex systems perspective: A research methods review. Social Science & Medicine, 272: 113697. https://doi.org/10.1016/j.socscimed.2021.113697
[22] Foguelman, D., Henning, P., Uhrmacher, A., Castro, R. (2021). EB-DEVS: A formal framework for modeling and simulation of emergent behavior in dynamic complex systems. Journal of Computational Science, 53: 101387. https://doi.org/10.1016/j.jocs.2021.101387
[23] Zare, F., Elsawah, S., Bagheri, A., Nabavi, E., Jakeman, A.J. (2019). Improved integrated water resource modelling by combining DPSIR and system dynamics conceptual modelling techniques. Journal of Environmental Management, 246: 27-41. https://doi.org/10.1016/j.jenvman.2019.05.033
[24] Wiedenhofer, D., Fishman, T., Lauk, C., Haas, W., Krausmann, F. (2019). Integrating material stock dynamics into economy-wide material flow accounting: Concepts, modelling, and global application for 1900-2050. Ecological Economics, 156: 121-133. https://doi.org/10.1016/j.ecolecon.2018.09.010
[25] McAvoy, S., Grant, T., Smith, C., Bontinck, P. (2021). Combining life cycle assessment and system dynamics to improve impact assessment: A systematic review. Journal of Cleaner Production, 315: 128060. https://doi.org/10.1016/j.jclepro.2021.128060
[26] Khorrami, M., Malekmohammadi, B. (2021). Effects of excessive water extraction on groundwater ecosystem services: Vulnerability assessments using biophysical approaches. Science of The Total Environment, 799: 149304. https://doi.org/10.1016/j.scitotenv.2021.149304
[27] Papachristos, G. (2019). System dynamics modelling and simulation for sociotechnical transitions research. Environmental Innovation and Societal Transitions, 31: 248-261. https://doi.org/10.1016/j.eist.2018.10.001
[28] Pereira, L.M., Davies, K.K., den Belder, E., Ferrier, S., Karlsson‐Vinkhuyzen, S., Kim, H., et al. (2020). Developing multiscale and integrative nature-people scenarios using the nature futures framework. People and Nature, 2(4): 1172-1195. https://doi.org/10.1002/pan3.10146
[29] Hantoro, I., Löhr, A.J., Van Belleghem, F.G., Widianarko, B., Ragas, A. (2023). Microplastics in seafood from the coastal areas of Semarang, Indonesia.
[30] Herbanu, P.S., Nurmaya, A., Nisaa, R.M., Wardana, R.A. (2024). The zoning of flood disasters by combining tidal flood and urban flood in Semarang City, Indonesia. In IOP Conference Series: Earth and Environmental Science. IOP Publishing, 1314(1): 012028. https://doi.org/10.1088/1755-1315/1314/1/012028
[31] Buchori, I., Pramitasari, A., Sugiri, A., Maryono, M., Basuki, Y., Sejati, A.W. (2018). Adaptation to coastal flooding and inundation: Mitigations and migration pattern in Semarang City, Indonesia. Ocean & Coastal Management, 163: 445-455. https://doi.org/10.1016/j.ocecoaman.2018.07.017
[32] Sariffuddin, S., Samsura, D.A.A., van der Krabben, E., Setiyono, B., Pradoto, W. (2024). Toward obsolete housing: A complementary explanation of increasing coastal vulnerability. International Journal of Disaster Risk Reduction, 111: 104709. https://doi.org/10.1016/j.ijdrr.2024.104709
[33] Seyawan, A., Triahadini, A., Yuliananto, Y., Aribowo, Y., Widiarso, D.A. (2016). Subsurface structure and fluid flow analysis using geophysical methods in the geothermal manifestation area of paguyangan, brebes, central java. International Journal of Renewable Energy Development, 5(3): 171-177. http://dx.doi.org/10.14710/ijred.5.3.171-177
[34] Supangat, A.B., Basuki, T.M., Indrajaya, Y., Setiawan, O., Wahyuningrum, N., Purwanto, et al. (2023). Sustainable management for healthy and productive watersheds in Indonesia. Land, 12(11): 1963. https://doi.org/10.3390/land12111963
[35] Perrone, A., Inam, A., Albano, R., Adamowski, J., Sole, A. (2020). A participatory system dynamics modeling approach to facilitate collaborative flood risk management: A case study in the Bradano River (Italy). Journal of Hydrology, 580: 124354. https://doi.org/10.1016/j.jhydrol.2019.124354
[36] Lo, W., Purnomo, S.N., Dewanto, B.G., Sarah, D., Sumiyanto. (2022). Integration of numerical models and InSAR techniques to assess land subsidence due to excessive groundwater abstraction in the coastal and lowland regions of semarang city. Water, 14(2): 201. https://doi.org/10.3390/w14020201
[37] Ramos-Salgado, C., Muñuzuri, J., Aparicio-Ruiz, P., Onieva, L. (2022). A comprehensive framework to efficiently plan short and long-Term investments in water supply and sewer networks. Reliability Engineering & System Safety, 219: 108248. https://doi.org/10.1016/j.ress.2021.108248
[38] Anamaghi, S., Behboudian, M., Mahjouri, N., Kerachian, R. (2023). A resilience-based framework for evaluating the carrying capacity of water and environmental resources under the climate change. Science of The Total Environment, 902: 165986. https://doi.org/10.1016/j.scitotenv.2023.165986
[39] Keyhanpour, M.J., Jahromi, S.H.M., Ebrahimi, H. (2021). System dynamics model of sustainable water resources management using the Nexus Water-Food-Energy approach. Ain Shams Engineering Journal, 12(2): 1267-1281. https://doi.org/10.1016/j.asej.2020.07.029
[40] Langellier, B.A., Kuhlberg, J.A., Ballard, E.A., Slesinski, S.C., Stankov, I., Gouveia, N., Kroker-Lobos, M.F., Sarmiento, O.L., Caiaffa, W.T., Diez Roux, A.V., Salurbal Group. (2019). Using community-based system dynamics modeling to understand the complex systems that influence health in cities: The salurbal study. Health & Place, 60: 102215. https://doi.org/10.1016/j.healthplace.2019.102215
[41] Naeem, K., Zghibi, A., Elomri, A., Mazzoni, A., Triki, C. (2023). A literature review on system dynamics modeling for sustainable management of water supply and demand. Sustainability, 15(8): 6826. https://doi.org/10.3390/su15086826
[42] Nyam, Y.S., Kotir, J.H., Jordaan, A., Ogundeji, A.A. (2022). Identifying behavioural patterns of coupled water‐agriculture systems using system archetypes. Systems Research and Behavioral Science, 39(2): 305-323. https://doi.org/10.1002/sres.2753
[43] Tan, A.H.P., Yap, E.H., Abakr, Y.A. (2020). A complex systems analysis of the water-energy nexus in Malaysia. Systems, 8(2): 19. https://doi.org/10.3390/systems8020019
[44] Zhang, X., Chen, N., Sheng, H., Ip, C., Yang, L., Chen, Y., Sang, Z., Tadesse, T., Lim, T.P.Y., Rajabifard, A., Bueti , C., Zeng , L., Wardlow, B., Wang, S., Tang, S., Xiong, Z. Li, D., Niyogi, D. (2019). Urban drought challenge to 2030 sustainable development goals. Science of The Total Environment, 693: 133536. https://doi.org/10.1016/j.scitotenv.2019.07.342
[45] Lim, F.H., Lee, W.K., Ishak, A.M., Hasan, A.A., Khor, J.W.S., Sulaiman, M.N.I.A., Ishak, A.F., Liew, J. (2023). Multi-criteria evaluation for long-term water resources augmentation planning with consideration of global change. Environmental Advances, 12: 100375. https://doi.org/10.1016/j.envadv.2023.100375
[46] Sharma, R., Kumar, R., Agrawal, P.R., Gupta, G. (2021). Groundwater extractions and climate change. In Water conservation in the era of global climate change. Elsevier, pp. 23-45. https://doi.org/10.1016/B978-0-12-820200-5.00016-6
[47] Rezagama, A., Handayani, D.S., Zaman, B., Putra, R.R.S. (2020). Design optimization of water distribution suburban area in Mranggen, Semarang, Indonesia. IOP Conference Series: Earth and Environmental Science, 448(1): 012066. https://doi.org/10.1088/1755-1315/448/1/012066