Fiora Helmi![]() | Ernan Rustiadi*
| Ernan Rustiadi*![]() | Bambang Juanda
| Bambang Juanda![]() | Sri Mulatsih
| Sri Mulatsih![]()
© 2025 The authors. This article is published by IIETA and is licensed under the CC BY 4.0 license (http://creativecommons.org/licenses/by/4.0/).
OPEN ACCESS
The spatial disparity in the development of the PEKANSIKAWAN metropolitan area (comprising Pekanbaru City, Kampar Regency, Siak Regency, and Pelalawan Regency) highlights Pekanbaru City as the economic and administrative center, while the surrounding areas serve as supporting regions with potential in agriculture, plantations, and industry. This study aims to analyze the spatial distribution of regional development and examine the typology of the PEKANSIKAWAN metropolitan area. The spatial distribution analysis was conducted using the scalogram method with Microsoft Excel and ArcGIS as analytical tools. The second objective of this study is to analyze the metropolitan PEKANSIKAWAN regional typology using the Rustiadi Quantitative Zoning (RQZ) method, also utilizing ArcGIS for analysis. The findings from the first objective indicate that villages with the highest level of development (Hierarchy I) are concentrated in the western corridor of the PEKANSIKAWAN metropolitan area, covering most of Pekanbaru City and parts of Kampar and Siak Regencies. Meanwhile, villages classified under Hierarchies II and III are more widely dispersed, characterized by limited basic infrastructure, low accessibility, and weak economic potential. The results of the second objective, based on three different spatial weight model simulations, reveal that the PEKANSIKAWAN metropolitan area consists of three regional typologies: (1) Cluster 1, forming a rural settlement area (kampung tua) characterized by dryland forests and non-industrial plantation forests (Kampar Regency); (2) Cluster 2, representing an urbanized area (Pekanbaru City); and (3) Cluster 3, forming a rural area dominated by industrial plantation forest concessions and large-scale palm oil plantations (Siak and Pelalawan Regencies). This study recommends implementing affirmative policies to encourage Cluster 3 to become a more inclusive area that actively contributes to generating a multiplier effect for the development of its surrounding regions.
spatial distribution, spatial disparity, PEKANSIKAWAN metropolitan, regional development, regional typology
The development of metropolitan areas is one of the main challenges in urban planning across various countries [1]. Metropolitan areas serve as economic growth centers that are closely interconnected with their surrounding regions in terms of social, economic, and infrastructure aspects [2, 3]. Metropolitan areas tend to grow rapidly as centers of economic growth and innovation, characterized by high urbanization, infrastructure expansion, and a concentration of industrial and service activities. However, this development is not always evenly distributed and often creates disparities between the city center and its surrounding areas [4]. Disparities in metropolitan development can be observed in differences in access to infrastructure, public services, and economic opportunities, which are more concentrated in the city center than in suburban areas. This condition raises various issues related to urban sustainability, equitable distribution of development benefits, and the integration of urban areas with the surrounding rural regions [5].
The main challenge in metropolitan area development in a global context is the growing disparity, both spatially and socially [6, 7]. In developed countries, this issue is often linked to the concentration of the technology and innovation sectors, which tend to attract highly skilled workers to city centers, while suburban areas face limitations in accessing the same opportunities [8]. Conversely, in developing countries, disparities are more often caused by differences in accessibility, infrastructure, and the quality of human resources [9]. This imbalance leads to urban sprawl, where uncontrolled urban expansion exacerbates economic disparities and increases pressure on the environment [7, 10].
The interaction between the core city and its surrounding areas within a metropolitan region also creates complex dynamics in spatial development patterns [11, 12]. An urban-centered growth model can lead to a backwash effect, where economic resources and labor are drawn to the city center, while suburban areas experience developmental stagnation. [13, 14]. This condition creates economic dependency between more developed and lagging regions, preventing the equitable distribution of development benefits. Without proper intervention strategies, this phenomenon can worsen economic disparities, increase poverty in peripheral areas, and drive uncontrolled population migration to city centers [12, 15]. A more inclusive and sustainable approach to metropolitan development is needed to address these challenges [16].
Spatial planning policies can integrate central and peripheral areas into a harmonious urban system. Enhancing interregional connectivity, ensuring equitable access to basic infrastructure, and strengthening the economic capacity of peripheral areas are some strategies that can be implemented [17, 18]. Additionally, a participatory approach involving various stakeholders, including the government, private sector, and community, is key to creating a more balanced and equitable metropolitan area [19].
Understanding the challenges and opportunities in metropolitan development helps regional planning focus on balanced, sustainable growth. An integrated approach between the city center and surrounding areas enhances competitiveness and ensures that development benefits are shared across society. Thus, analyzing spatial typologies is essential for designing adaptive and inclusive development strategies.
At the global level, similar challenges can be observed in the Jing-Jin-Ji region (Beijing-Tianjin-Hebei) in China, which was designed to alleviate urbanization pressure in Beijing by redirecting investment and infrastructure development to Tianjin and Hebei. However, disparities between Beijing and its satellite cities remain significant due to imbalances in investment distribution and uneven industrial development policies [20, 21]. A similar situation occurs in India, particularly in the National Capital Region (NCR), where growth has far outpaced that of its surrounding cities. This is due to the dominance of the service and manufacturing sectors in the capital, which are difficult to equitably expand to neighboring areas, further exacerbating economic disparities and regional development imbalances.
In Indonesia, disparities in metropolitan development can also be observed in the MEBIDANGRO metropolitan area (Medan City, Binjai City, Deli Serdang Regency, and Karo Regency) in North Sumatra Province. Medan has rapidly developed as a center for trade and services, while its surrounding areas still rely heavily on the agriculture and plantation sectors. This imbalance is further exacerbated by suboptimal infrastructure connectivity, which hinders economic integration and equitable development across the region [22].
The PEKANSIKAWAN metropolitan strategic area (Pekanbaru City, Kampar Regency, Siak Regency, and Pelalawan Regency) holds significant potential as a regional economic growth center in Riau Province. The PEKANSIKAWAN metropolitan area consists of 62 subdistricts and 582 villages. This area serves as the core region of Riau Province, with a population of 2,830,552 in 2022, accounting for approximately 42.03% of the province's total population. Additionally, PEKANSIKAWAN plays a vital role as an economic growth center in Riau Province, with a Gross Regional Domestic Product (GRDP) of IDR 421.064 trillion in 2022, contributing 42.46% to the province's total GRDP. Pekanbaru City acts as the growth center, with surrounding regencies supporting agriculture, plantations, and resource-based industries. Despite its economic potential, development disparities persist, leading to an uneven economic hierarchy. This inequality is driven by the unequal distribution of resources and ineffective management [23].
The PEKANSIKAWAN Metropolitan Area, with Pekanbaru as the capital of Riau Province, has experienced faster infrastructure growth and economic activity compared to Kampar Regency, Siak Regency, and Pelalawan Regency [24]. Unlike other regions in Riau Province, Pekanbaru has limited natural resources, making its economy highly dependent on the trade and service sectors. As the trade and service hub of Riau, Pekanbaru benefits from well-developed infrastructure and a strategic position as the economic gateway of Sumatra [25]. The city's economic potential continues to grow with the expansion of the creative industry and investment sectors. However, major development challenges include limited agricultural land, reliance on non-productive sectors, and rapid urbanization, which may threaten regional food security [26]. Therefore, economic diversification policies and urban spatial optimization are essential to support food sustainability and community welfare.
Kampar Regency, has advantages in agriculture, plantations, and fisheries, with key commodities such as pineapples, oil palm, and catfish [27]. Its economic potential is further strengthened by its strategic location as a connector between Riau and West Sumatra [28]. However, development challenges include limited infrastructure, disparities in access to education, and the conversion of agricultural land into plantations, which threatens food security. Sustainable land management policies and the development of agro-based industries are necessary to maintain economic balance and food security.
Siak Regency, has advantages in the plantation sector, processing industries, and historical tourism, particularly with the presence of Siak Palace as a key destination [29]. Its economic potential is supported by abundant natural resources and strategic accessibility to regional trade routes. However, development challenges include dependence on the extractive sector, limited rural infrastructure, and the conversion of agricultural land into oil palm plantations, which threatens regional food security. Sustainable land management policies and economic diversification are essential to balancing development and food security.
Meanwhile, Pelalawan Regency, Riau, possesses significant potential in the palm oil plantation, forestry, and natural resource-based industries [30]. The Pelalawan Technopolitan Area strengthens its role as an innovation and technology hub. However, the conversion of agricultural land to plantations has reduced food security, threatened productive land, and increased food import dependence. Infrastructure limitations, skill gaps, and bureaucratic inefficiencies also pose challenges. To overcome these, economic diversification through creative industries, tourism, and innovative governance is crucial for sustainable development. Limited production capacity in supporting regions is due to a lack of technological support and industrial investment [31].
The economic differences among regions within the PEKANSIKAWAN Metropolitan Area influence each area's contribution to the regional economy. Therefore, development strategies focusing on equitable accessibility and infrastructure improvement are key to supporting the growth of this metropolitan region. An inclusive and well-directed development strategy is needed to address regional development disparities [32, 33]. Equitable infrastructure distribution and improved connectivity are strategic measures to integrate areas with lower development hierarchies into the regional economic system [34, 35]. The optimization of growth corridors plays a crucial role in promoting the development of industries based on local resources, particularly the agro-industry sector, which holds significant potential in this region. Additionally, policies that support investment and enhance human resource capacity must also be implemented to ensure that economic growth in the PEKANSIKAWAN Metropolitan Area becomes more equitable and sustainable [36, 37].
Pekanbaru City dominates the development hierarchy with the highest growth rate, while the surrounding regencies exhibit varying levels of growth. This disparity highlights that infrastructure and connectivity remain key factors in determining the economic development of the region [38]. The distribution pattern of the development hierarchy indicates that areas with the highest growth levels are concentrated around Pekanbaru City and along the main transportation routes [39]. In contrast, regions with a lower development hierarchy still rely on traditional agriculture and face infrastructure limitations [40].
Various studies emphasize that the success of metropolitan area development is highly influenced by transportation integration policies and industrial cluster-based economic development strategies [41]. Metropolitan PEKANSIKAWAN needs to adopt a more inclusive and sustainable strategy, particularly in enhancing interregional connectivity and ensuring equitable infrastructure development to reduce economic disparities [42]. The synergy between Pekanbaru as the growth center and its surrounding areas can be strengthened through strategic planning that focuses on improving accessibility, promoting a more balanced economic distribution, and optimizing the role of each region in supporting the area's economic ecosystem [43, 44].
The Riau Provincial Government has proposed in the 2025-2029 RPJMN to promote the growth of the PEKANSIKAWAN Metropolitan Area through infrastructure development, mass transportation, and improved interregional connectivity. Key initiatives include integrated spatial planning, toll roads, industrial corridors, and revitalization of tourism and residential areas. A Bus Rapid Transit (BRT) system will enhance mobility, aiming to establish PEKANSIKAWAN as a sustainable economic growth center in Riau.
This study aims to analyze the development level of the PEKANSIKAWAN Metropolitan Area and explore its regional typology in order to optimize the economic potential of each sub-region and promote inclusive development. Unlike previous studies, this research specifically applies a zoning approach to classify the spatial characteristics of a metropolitan region, which has not yet been extensively explored. The novelty of this approach lies in its ability to provide a more detailed spatial typology that reflects the actual development patterns across the metropolitan area. This study seeks to offer new insights into regional planning by identifying disparities and development clusters, which can serve as a foundation for more targeted policy interventions. Furthermore, the findings of this research are expected to contribute significantly to the discourse on sustainable regional development in Indonesia, particularly in ensuring balanced growth between core and peripheral areas. Therefore, this study holds strategic relevance for spatial planning and the formulation of inclusive regional development policies at both local and national levels.
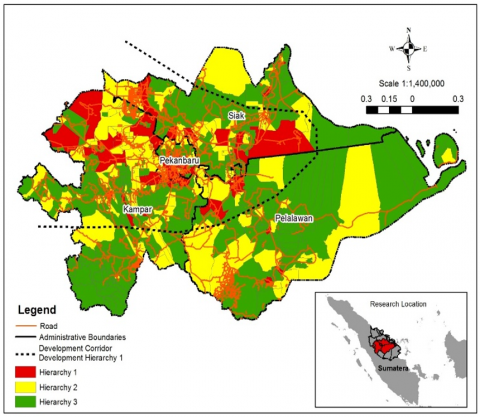
The research location includes Pekanbaru City, Kampar Regency, Siak Regency, and Pelalawan Regency in Riau Province. Figure 1 shows the research location, which includes Pekanbaru City, Kampar Regency, Siak Regency, and Pelalawan Regency in Riau Province. This study employs a quantitative approach using spatial analysis methods to explore the development level and typology of the PEKANSIKAWAN metropolitan area.
The data used in this research is sourced from secondary data obtained from the BPS-Statistics Indonesia, the Regional Development Planning, Research, and Development Agency (BAPPEDALITBANG) of Riau Province, as well as analysis results from previous studies, as presented in Table 1.
Table 1. Data sources and their uses
|
Data Source |
Year Access |
Uses |
|
Village Potential Data 2021, BPS-Statistic Indonesia |
2021 |
Analysis of the Development Level of the PEKANSIKAWAN Metropolitan Area |
|
Land Cover Data 2020, Population Density, and Village Development Index (IPD)–BAPPEDALITBANG Riau Province & BPS-Statistic Indonesia |
2020 |
Spatial and Demographic Analysis |
|
Other Supporting Data, Including the Analysis Results of the First Objective Related to IPD |
- |
Strengthening Spatial Analysis of the Region |
The first objective of this study is to analyze the level of infrastructure development and accessibility in the PEKANSIKAWAN metropolitan area using the scalogram analysis method. Scalogram analysis is utilized to assess the development level of a region administratively by evaluating the completeness of facilities and infrastructure within the area [45].
The research focuses on 582 villages within the PEKANSIKAWAN metropolitan area in Riau Province. Scalogram analysis is employed to examine the development level of these regions. The variables used in the scalogram analysis for this study include the distance from villages to the sub-district capital, the distance between the sub-district center and the district capital, and the population data for each sub-district. Meanwhile, the facility data analyzed cover various aspects, including educational facilities (number of elementary schools/Islamic elementary schools, junior high schools/Islamic junior high schools, senior high schools/Islamic senior high schools, and higher education institutions), religious facilities (mosques, prayer houses, churches, temples, and monasteries), healthcare facilities (hospitals, community health centers, integrated health service posts, and pharmacies), as well as economic facilities (markets, minimarkets, shops, food stalls, restaurants, and hotels) [46].
Figure 1. Research location (Metropolitan PEKANSIKAWAN)
Stages of Scalogram Analysis:
The data processing begins with organizing a table by selecting and filtering data based on the villages studied. Next, the data is categorized into facility data and accessibility data to facilitate further analysis. The final stage involves calculating the number of facilities distributed across all villages to evaluate spatial distribution and service coverage.
In this analysis, the facility index is calculated using the equation: $I=F / P$ where $I$ represents the facility/factor index, F is the number of facilities, and P is the population per 1,000 people. Next, to obtain the inverse value of the data index, the equation is used: $I^{\prime}=1 / I$ aiming to manipulate several variables in the opposite direction to the level of development. After that, the characteristic index weight is calculated using the formula: $W=I^{\prime} / \sum I^{\prime}$ which allows for comparisons between regions based on the proportion of the normalized facility index. Finally, all variables are normalized using: $I_{\text {norm }}=\left(I-I_{\min }\right) /\left(I_{\max }-I_{\min }\right)$, so that the final result is a standardized index, enabling a more objective and consistent comparative analysis across all studied regions.
The studied regions are ranked based on the facility index to obtain a comparative overview of service availability levels. Subsequently, the infrastructure hierarchy is determined by ordering the index values from highest to lowest. This analysis produces the Regional Development Index (RDI) at the village level, which is then categorized into three hierarchical levels and presented in Table 2.
Table 2. Determining the value of the hierarchical interval [47]
|
Class |
Interval Value |
Hierarchy Level |
|
Hierarchy I |
X>[mean+(St Dev.IPW)] |
High |
|
Hierarchy II |
mean<X<[mean+(St Dev.IPW)] |
Medium |
|
Hierarchy III |
X<mean |
Low |
The second objective of this study is to identify the spatial utilization of the PEKANSIKAWAN metropolitan area to optimize the economic potential of each region using Rustiadi’s Quantitative Zoning method, based on spatial proximity and spatial compactness [48, 49]. There are three spatial classification methods that can be used in spatial analysis. The first is the Non-Contiguous (NC) method, which does not consider spatial connectivity between territorial units, allowing each region to be analyzed independently. Second, the Contiguous I (C1) method considers the direct spatial connectivity between adjacent regions, making the interaction patterns between areas more visible. Third, the Contiguous II (C2) method not only takes spatial connectivity into account but also applies continuity weights, allowing for a more detailed analysis of the spatial proximity influence between regions. By implementing these methods, the spatial distribution patterns can be analyzed more comprehensively in accordance with the characteristics of interregional connectivity.
The basis for using the contiguous spatial method (C') in this study is used the Euclidean Distance principle for grouping variables that form a typology, considering both proximity and regional characteristic similarities. Compared to the Non-contiguous and Contiguous (C") methods, this approach is simpler, with clear quantitative parameters and no need for data manipulation. This method (C') use Spatial proximity based on geographic coordinates easting X and Northing Y (x, y) and spatial proximity weights (B<1 strong, B>1 weak).
The calculation is performed using the Euclidean distance with the following equation:
$\left.D_{i j}=\sqrt{\left(z_i^{\prime}-z_j^{\prime}\right)^2+\beta\left\{\left(X_i^{\prime}-X_j^{\prime}\right)^2+\left(Y_i^{\prime}-Y_j^{\prime}\right)^2\right.}\right\}$ (1)
$D_{i j}=\sqrt{\begin{array}{c}\left(z_{1 i}^{\prime}-z_{1 j}^{\prime}\right)^2+\left(z_{2 i}^{\prime}-z_{2 j}^{\prime}\right)^2+\cdots \\ +\left(z_{m i}^{\prime}-z_{m j}^{\prime}\right)^2+\beta\left\{\left(X_i^{\prime}-X_j^{\prime}\right)^2+\left(Y_i^{\prime}-Y_j^{\prime}\right)^2\right\}\end{array}}$ (2)
where, $D_{i j}$ represents the Euclidean distance between locations i and j; $Z_i, Z_j$ are the variable values at locations i and j; X, Y denote the spatial coordinates of each regional unit; β is the spatial continuity weight.
Standardization of Variables:
$Z_{\mathrm{i}}^{\prime}=\frac{Z_i-Z_{\min }}{S D}$ (3)
$S D=\sqrt{\frac{\sum\left(Z_i-\bar{Z}\right)^2}{n}}$ (4)
where,, Zmin is the minimum value, $\bar{Z}$ is the average value, and n is the total number of data.
$X_i^{\prime}=\frac{\left(x_i-x_{\min }\right)^2}{\sum\left(S D_X x S D_Y\right) * 0.5}$ (5)
$Y_i^{\prime}=\frac{\left(y_i-y_{\min }\right)^2}{\sum\left(S D_X x S D_Y\right) * 0.5}$ (6)
By using this approach, spatial analysis can produce a more representative regional classification. Subsequently, the spatial clustering process is carried out using several data processing applications. The best spatial clustering model is determined through the Coefficient of Variation (CV) and K-Means. According to Rustiadi dan Kobayashi (2000), the formula for calculating the CV value is as follows:
$C V=\frac{\sigma^2}{\bar{X}}$ (7)
where, $\sigma^2$ is the standard deviation of the Euclidean distance between locations and $\bar{X}$ is the average distance. A smaller CV value indicates lower data variability within the cluster. Additionally, a smaller K-Means value signifies consistency within a cluster, indicating that the characteristics within the cluster are more homogeneous.
3.1 Regional development level in metropolitan PEKANSIKAWAN
The spatial distribution of regional development levels at the village level across the PEKANSIKAWAN metropolitan area is presented in Figure 2. The red color represents Hierarchy 1 distribution, the yellow color represents Hierarchy 2, and the green color represents Hierarchy 3. A deep understanding of this distribution is essential for formulating inclusive and sustainable development strategies to enhance welfare and ensure equitable development across the region.
Figure 2 shows that the spatial structure of the development hierarchy in the PEKANSIKAWAN metropolitan area forms a spatial development corridor for Hierarchy 1. This Hierarchy 1 corridor extends along the western side of the PEKANSIKAWAN metropolitan area. This corridor plays a strategic role in the economic development of the metropolitan region.
A detailed depiction of the distribution of village development levels across the PEKANSIKAWAN metropolitan area, based on the hierarchy categories shown in Figure 2, is presented in Table 3. This table reflects the development dynamics within the region. Overall, the PEKANSIKAWAN metropolitan area consists of 582 villages, distributed across different hierarchy levels, highlighting variations in development across different areas.
Table 3. Metropolitan PEKANSIKAWAN regional development level
|
Village/Urban Development Categories |
Region |
||||
|
Pekanbaru |
Kampar |
Siak |
Pelalawan |
PEKANSIKAWAN |
|
|
Hierarchy 1 |
49 |
21 |
15 |
8 |
93 |
|
Hierarchy 2 |
23 |
63 |
33 |
22 |
141 |
|
Hierarchy 3 |
11 |
166 |
83 |
88 |
348 |
|
Total |
83 |
250 |
131 |
118 |
582 |
Source: Data Processed, 2024
Figure 2. Metropolitan PEKANSIKAWAN village development level in 2021
3.2 Typology of the PEKANSIKAWAN region
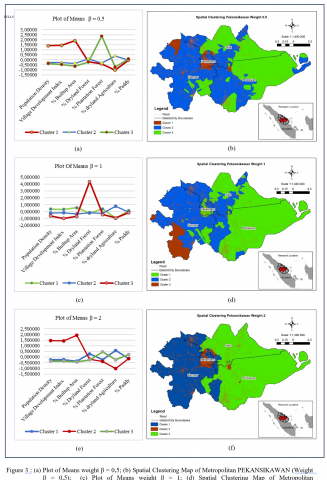
The results of the regional typology of the PEKANSIKAWAN area using Rustiadi’s Quantitative Zoning method (Contiguous I) are presented in Figure 3. To determine the best model for the typology of the PEKANSIKAWAN metropolitan area, the calculation of the Coefficient of Variation (CV) and K-means (k) is conducted, as presented in Table 4.
Table 4. Coefficient of variation (CV) and spatial cluster number (k)
|
β |
Cluster 1 |
Cluster 2 |
Cluster 3 |
|||
|
CV |
k |
CV |
k |
CV |
k |
|
|
0.5 |
57.8 |
10 |
63.66 |
8 |
70.7 |
13 |
|
1 |
44.25 |
8 |
42.08 |
7 |
44.84 |
1 |
|
2 |
58.05 |
2 |
46.95 |
5 |
49.35 |
1 |
Source: Data Processed
Figure 3 presents the data processing results illustrating the regional typology of the PEKANSIKAWAN Metropolitan Area in Riau Province, using Rustiadi’s Quantitative Zoning analysis method (Contiguous I). This method applies three spatial weighting variations—β=0.5, β=1, and β=2—resulting in three different regional typology models. These models are presented as alternatives to be considered in determining the most representative typology. To identify the model that best reflects empirical conditions in the field, spatial clustering analysis was conducted using the Coefficient of Variation (CV) and the K-Means method. The model with the lowest K-Means value is considered the most optimal in representing the spatial heterogeneity of the region. Based on the analysis, the model with a spatial weight of β=2 was selected as the most appropriate typology, as it yielded the lowest K-Means value of 8. The optimal model, based on the CV and K-Means (k) values presented in Table 4.
To further elaborate on the typological characteristics of the PEKANSIKAWAN metropolitan area based on β=2, the details are presented in Table 5.
Table 5. Characteristics of village typology based on clustering with weight (β)=2 in metropolitan PEKANSIKAWAN
|
Variabel β=2 |
Cluster 1 |
Cluster 2 |
Cluster 3 |
|
Population Density |
medium |
high |
low |
|
Village Development Index |
medium |
high |
low |
|
% Builtup Area |
low |
high |
low |
|
% Dryland forests |
high |
low |
low |
|
% Plantation Forest |
medium |
low |
high |
|
% Dryland farming |
high |
low |
medium |
|
% Paddy |
low |
low |
high |
|
Regional Characteristics |
Rural areas with characteristics of dryland forests and dryland agriculture (natural forests and agriculture) |
Urban |
Rural areas with characteristics of industrial plantation forests |
Source: Data Processed
Figure 3. (a) Plot of Means weight β=0,5; (b) Spatial Clustering Map of Metropolitan PEKANSIKAWAN (Weight β=0,5); (c) Plot of Means weight β=1; (d) Spatial Clustering Map of Metropolitan PEKANSIKAWAN (Weight β=1); (e) Plot of Means weight β=2; (f) Spatial Clustering Map of Metropolitan PEKANSIKAWAN (Weight β=2)
Table 5 outlines the classification of village typologies in the PEKANSIKAWAN metropolitan area based on clustering results with a weight of β=2. The classification divides the region into three clusters based on key variables, including population density, village development index, land use, as well as agricultural and forestry aspects.
In the regional typology visualization (Figure 3), blue indicates rural areas with characteristics of dryland forests and dryland agriculture-natural forests and agriculture (cluster 1), red represents urban areas (cluster 2), and green represents rural areas with characteristics of industrial plantation forests (cluster 3). This approach provides a more accurate spatial representation of the dynamics within the PEKANSIKAWAN region. The PEKANSIKAWAN Metropolitan Area has not yet empirically demonstrated the formation of suburban areas.
4.1 The regional development level in the PEKANSIKAWAN metropolitan area
The distribution pattern of regional development indicates a significant disparity within the PEKANSIKAWAN metropolitan area. Sustainable and inclusive regional development is one of the primary objectives in spatial planning and regional economic development. The spatial distribution of regional development levels in the PEKANSIKAWAN metropolitan area highlights interregional imbalances, as illustrated in the map (Figure 2). The red color, representing the highest development hierarchy, is concentrated in Pekanbaru City, while Kampar Regency, Siak Regency, and Pelalawan Regency exhibit a more diverse distribution of development hierarchies. This aligns with the growth center theory, which states that urban areas with more advanced infrastructure tend to become magnets for economic activities [50].
The distribution of development in the PEKANSIKAWAN metropolitan area forms a Hierarchy 1 corridor, which serves as a growth region connecting major activity centers (with Pekanbaru City dominating in Hierarchy 1). This reflects a high level of urbanization and intensive economic activity. The Hierarchy 1 corridor extends across the western part of the PEKANSIKAWAN metropolitan area. The distribution of villages with Hierarchy 1 development levels indicates that the most advanced areas are concentrated along major transportation routes. This finding reinforces the role of infrastructure and primary transport corridors as key drivers of regional growth. The presence of road networks connecting these areas is crucial in supporting accessibility and economic connectivity. Pekanbaru City serves as the primary hub, while Kampar, Siak, and Pelalawan Regencies have the potential to develop as secondary growth centers, supporting agricultural, industrial, trade, and distribution activities.
The distribution pattern of Hierarchy 1 development in villages within the PEKANSIKAWAN metropolitan area also indicates the role of growth corridors in enhancing regional prosperity. Areas along major transportation routes have significant potential to be developed as industrial and agro-industrial centers. These regions can be directed toward becoming industrial clusters based on local resources, particularly in Kampar Regency, through the optimization of supporting infrastructure such as logistics and transportation networks [51]. In the context of more equitable development, a development approach based on local advantages is an effective strategy. Regions with lower development hierarchies can be enhanced through agricultural modernization, the application of innovative technologies, and commodity-based ecotourism. In this way, Pekanbaru City can serve as a catalyst for driving growth in its surrounding areas, fostering a more integrated and sustainable economic ecosystem.
Table 3 shows that Pekanbaru City dominates the category of regions with Hierarchy 1, with 49 villages, reflecting its status as an economic and administrative center. In contrast, other regencies such as Kampar, Siak, and Pelalawan have significantly fewer villages in Hierarchy 1 (a total of only 44), indicating that economic growth centers are still concentrated in Pekanbaru City. The total number of villages in Hierarchy 1 is 93 (16%) out of the total 582 villages in the PEKANSIKAWAN metropolitan area. This has implications for disparities in access to infrastructure, public services, and economic opportunities across the region.
Meanwhile, Hierarchy 2, which represents areas in transition toward more advanced development, is dominated by Kampar Regency with 63 villages, followed by Siak Regency with 33, Pekanbaru City with 23, and Pelalawan Regency with 22. The relatively large number of villages in this hierarchy category, 141 in total (24%) of all villages in the PEKANSIKAWAN metropolitan area, indicates significant potential for these regions to develop more rapidly if supported by appropriate strategic policies, such as improved infrastructure connectivity, strengthened local industrial sectors, and innovation based on key commodities.
In the Hierarchy 3 category, Kampar Regency has the highest number of villages, totaling 166, followed by Pelalawan Regency with 88, Siak Regency with 83, and Pekanbaru City with 11. The total number of villages in Hierarchy 3 is 348, accounting for 60% of the total villages in the PEKANSIKAWAN metropolitan area. This condition indicates that most rural areas within the PEKANSIKAWAN metropolitan region still face significant challenges in development, particularly in terms of accessibility, infrastructure quality, and economic opportunities.
The concentration of Hierarchy I villages in the western corridor of the PEKANSIKAWAN metropolitan area particularly in Pekanbaru City and parts of Kampar and Siak Regencies reflects a pattern of uneven growth. This phenomenon aligns with spatial inequality patterns observed in other metropolitan regions, such as Jabodetabek [52]. In the case of Jabodetabek, Jakarta, as the center of economic and administrative growth, demonstrates strong dominance over its satellite cities, which often face delays in the development of basic infrastructure similar to the conditions observed in Hierarchy II and III villages within the PEKANSIKAWAN metropolitan area. However, there are significant structural differences. Jabodetabek is dominated by the tertiary sector, such as services and finance, whereas the PEKANSIKAWAN metropolitan area—particularly Kampar, Siak, and Pelalawan Regencies—remains heavily reliant on primary sectors such as agriculture, oil palm plantations, and forestry. This indicates that the development challenges in PEKANSIKAWAN are not solely spatial in nature, but also involve sectoral economic transformation that remains uneven.
A comparison can also be made with the MEBIDANGRO area (Medan, Binjai, Deli Serdang, and Karo), where development is more horizontally distributed, largely due to infrastructure connectivity such as the Medan-Binjai toll road, which has facilitated growth in peripheral areas [22]. In the context of PEKANSIKAWAN, interregional connectivity still faces significant challenges, both in terms of infrastructure quality and accessibility between growth centers. The importance of adopting a polycentric development approach in metropolitan planning to reduce inequality [44].
Disparities in access to infrastructure, public services, and economic opportunities in peripheral areas pose major challenges to equitable development. Kampar Regency has the highest number of villages in Hierarchy 3, followed by Pelalawan Regency, Siak Regency, and Pekanbaru City. Most rural areas in the PEKANSIKAWAN metropolitan region still face developmental challenges, such as limited accessibility, inadequate infrastructure quality, and restricted economic opportunities. Therefore, development strategies should focus on increasing investments in sectors that directly contribute to community welfare. Referring to the concept of sustainable development, the integration of the industrial, agricultural, and service sectors must be strengthened to create a more balanced economic ecosystem. As a strategic area in Riau Province, the PEKANSIKAWAN metropolitan region has significant potential for accelerated growth by implementing development policies based on local advantages and regional connectivity. A data-driven approach and well-planned strategies will be key to optimizing the region's economic potential to achieve inclusive and sustainable growth.
4.2 The typology of the PEKANSIKAWAN metropolitan area
Based on the results of the PEKANSIKAWAN typology analysis (Figure 3, weight β=2, best/appropriate model), the PEKANSIKAWAN metropolitan area can be categorized as an area with a combination of complementary urban and rural areas. The classification of the PEKANSIKAWAN metropolitan area consists of three clusters. Cluster 1 is a rural settlement area or traditional village, most of which are located in Kampar Regency (the number of cluster 1 members is 262 villages), which is characterized by dry land forests and non-industrial plantation forests, including natural forests and traditional agricultural lands, which reflect an agrarian and ecologically balanced rural landscape. Cluster 2, which is located in Pekanbaru City (the number of cluster 2 members is 98 villages), includes villages with urban characteristics, characterized by higher population density, advanced infrastructure, and a variety of non-agricultural economic activities, which highlight the urban transformation of rural settlements. In contrast, Cluster 3 includes villages in Siak and Pelalawan Districts (the total number of members of cluster 3 is 222 villages), which are still rural but are heavily influenced by industrial-scale land use, especially large-scale industrial tree plantation concessions and oil palm plantations, which show a strong integration of village life with commercial forestry-based and monoculture agricultural practices Table 5.
Cluster 1 represents a rural area with dominant characteristics of dryland forests and dryland agriculture. The areas within this cluster have moderate population density and human development index (HDI), indicating that development and the level of community welfare are in the medium category. The percentage of built-up land in this area is relatively low, suggesting a limited level of urbanization. However, this region has a high percentage of dryland forests and extensive dryland agriculture, reflecting that the region's economy is still heavily dependent on the forestry and dryland-based agricultural sectors.
Cluster 2 represents an urban area with high population density and HDI, indicating that this region is more advanced in terms of socio-economic aspects and development. The high percentage of built-up land suggests that this area has experienced rapid urbanization, likely dominated by residential areas, infrastructure, as well as business and trade centers. In contrast, dryland forests, industrial tree plantations, and dryland agriculture have very low percentages, indicating that the agricultural and forestry sectors are not the primary factors in the economic structure of this region.
Cluster 3 depicts a rural area that differs from Cluster 1 as it is more dominated by industrial tree plantations and rice fields. The population density and HDI in this area are relatively low, indicating that development and the well-being of its population are still limited. This region has a high percentage of industrial tree plantations and extensive rice fields, suggesting that the commercial forestry and rice farming sectors are the main contributors to the economy of this area. In contrast, dryland forests and built-up land are relatively low, indicating that this region is more focused on the production of industrial forest products and agriculture rather than urban infrastructure development.
The PEKANSIKAWAN metropolitan is a strategic area. The city of Pekanbaru serves as the center of economy and administration, with more advanced infrastructure compared to the surrounding areas. Meanwhile, Siak Regency has strong potential in the plantation and cultural tourism sectors, especially with the presence of the Siak Palace, which is a historical tourist attraction. Kampar Regency is known for its agricultural sector and small-medium industries (SMEs), particularly in agro-industry, including the processing of agricultural products [51]. Meanwhile, Pelalawan Regency has strengths in the forestry and plantation industries, particularly in palm oil, which is the main sector of the region's economy.
Pekanbaru City, as the center of economic and service activities, plays a role in providing markets, infrastructure, and innovation hubs for the surrounding areas. Siak Regency and Kampar Regency function as buffer zones that provide natural resources and labor for the urban area, while Pelalawan Regency serves as a center for resource-based industries that make significant contributions to the regional economy. The integration of these four areas creates a strong economic linkage and requires a holistic development strategy to ensure that each region can develop optimally.
In the context of development, strengthening connectivity between regions is a key factor in supporting the integration of the PEKANSIKAWAN metropolitan area. Improving transportation infrastructure, such as toll roads and logistics routes, is essential to accelerate the distribution of goods and services between regions. Furthermore, policies that encourage investment in the creative industries and technology sectors can also enhance the competitiveness of this area. One of the main challenges in the development of the PEKANSIKAWAN metropolitan area is the infrastructure and accessibility gap between regions. Some areas in Siak Regency, Kampar Regency, and Pelalawan Regency still face limitations in terms of road access and basic facilities, which can hinder investment flows and local economic growth. Therefore, integrated planning between local and central governments is needed to ensure equitable and inclusive development.
Metropolitan PEKANSIKAWAN has great potential to drive economic growth based on regional strengths with proper planning. Collaboration between the government, academia, business actors, and the community is crucial in creating an ecosystem that supports innovation and inclusive sustainable development. Through a targeted and synergistic approach, the PEKANSIKAWAN metropolitan area can develop into a new high-competitiveness economic growth center at both national and international levels. An adaptive, inclusive and integrated planning and development strategy needs to be carried out to achieve the vision of sustainable development [52]. Studies on metropolitan areas indicate that successful development depends on infrastructure integration and inclusive economic development strategies [53, 54].
Based on the analysis of regional development levels and spatial typology in the PEKANSIKAWAN metropolitan area, several policy implications can be proposed to support more inclusive and sustainable development.
Enhancing Regional Connectivity and Infrastructure. The development disparity in the PEKANSIKAWAN metropolitan area highlights the need for policies that focus on improving interregional connectivity and infrastructure. Local and central governments must accelerate the development of toll roads, logistics routes, and other transportation infrastructure to reduce accessibility gaps between Pekanbaru City and its surrounding buffer areas, such as Kampar Regency, Siak Regency, and Pelalawan Regency. Strengthening connectivity will support regional economic integration and expedite the distribution of goods and services.
Development of Local Resource-Based Industrial Clusters. To promote equitable economic growth, development policies should focus on strengthening industrial clusters based on local resources. Kampar Regency has potential in agro-industry, Siak Regency in plantations and cultural tourism, and Pelalawan Regency in forestry and palm oil industries. The government needs to provide incentives for small and medium enterprises (SMEs) to foster their growth and establish innovation hubs to support regional productivity and competitiveness.
Improving Access to Public Services and Education. Disparities in access to public services, particularly in rural areas, should be a key focus in the development planning of the PEKANSIKAWAN metropolitan area. The government must develop policies that ensure equitable access to education, healthcare, and other essential services. Enhancing human resource capacity through vocational education programs and partnerships with universities in Pekanbaru City can serve as a strategy to improve workforce quality and support regional economic growth.
Strengthening Policies for Sustainable Natural Resource Management. As a region with dominant agricultural and plantation sectors, the PEKANSIKAWAN metropolitan area requires sustainable policies for natural resource management. The government needs to develop regulations that ensure environmentally friendly industrial and agricultural practices, including the optimization of waste management systems and the adoption of green technologies. Additionally, spatial planning policies must consider sustainability aspects to maintain a balance between economic development and environmental conservation.
Strengthening Synergy and Collaboration Among Stakeholders." To achieve more equitable and inclusive development, collaboration between the government, academia, the business sector, and the community is essential. Local governments need to establish cross-sector communication forums to formulate strategies that align with the specific needs of each region. This collaboration can also enhance the effectiveness of policy implementation and ensure that the development of the PEKANSIKAWAN metropolitan area is well-directed and evidence-based.
The level of village development in the PEKANSIKAWAN metropolitan area in 2021 forms a hierarchical 1 village corridor and its surroundings, which stretches from west to east of the PEKANSIKAWAN metropolitan area. This corridor is also located on the north side of the PEKANSIKAWAN metropolitan area and has encouraged economic agglomeration in the region. Development disparities in the PEKANSIKAWAN metropolitan area indicate that Pekanbaru City dominates as the primary economic growth center (Hierarchy 1), while surrounding areas such as Kampar Regency, Siak Regency, and Pelalawan Regency experience more varied levels of development. The spatial distribution of development suggests that accessibility and transportation infrastructure play a crucial role in determining a region’s growth level. Most villages/urban wards in PEKANSIKAWAN remain in Hierarchy 3, highlighting the need for an integrated development acceleration strategy based on local potential. This includes agro-industrial development in areas with lower hierarchies to promote balanced regional growth. This study suggests that affirmative policies should be more focused on encouraging Cluster 3 to become a more inclusive area and play an active role in creating an effective multiplier effect for the development of its surrounding regions. This study has several limitations, including the absence of a comprehensive time-series analysis to capture the dynamics of typological changes in the metropolitan area over time, reliance on secondary data without incorporating a participatory planning approach using primary data, and the limited integration of remote sensing data, such as urban sprawl and land use change. These three aspects are recommended as key areas for further research development.
[1] Rustiadi, E., Indraprahasta, G.S., Mulya, S.P. (2020). Teori perencanaan: Madzab & praktik perencanaan pengembangan wilayah. Pertama. Jakarta: Yayasan Pustaka Obor Indonesia. http://www.obor.or.id.
[2] Liu, Y., Yang, M., Cui, J. (2024). Urbanization, economic agglomeration and economic growth. Heliyon, 10(1): e23772. https://doi.org/10.1016/j.heliyon.2023.e23772
[3] Schuster-Olbrich, J.P., Marquet, O., Miralles-Guasch, C., Arce, L.F. (2024). Spatial patterns and drivers of urban expansion: An exploratory spatial analysis of the Metropolitan Region of Santiago, Chile, from 1997 to 2013. Cities, 153: 105305. https://doi.org/10.1016/j.cities.2024.105305
[4] Firman, T. (2009). The continuity and change in mega-urbanization in Indonesia: A survey of Jakarta-Bandung Region (JBR) development. Habitat International, 33(4): 327-339. https://doi.org/10.1016/j.habitatint.2008.08.005
[5] Hutton, T., Paddison, R. (2014). Cities and economic change: Restructuring and dislocation in the global metropolis.
[6] Fauzi, M.R., Rustiadi, E., Mulatsih, S. (2019). Ketimpangan, pola spasial, dan kinerja pembangunan wilayah di Provinsi Jawa Timur. Journal of Regional and Rural Development Planning (Jurnal Perencanaan Pembangunan Wilayah dan Perdesaan), 3(3): 157-171. https://doi.org/10.29244/jp2wd.2019.3.3.157-171
[7] Wei, Y.D., Ewing, R. (2018). Urban expansion, sprawl and inequality. Landscape and Urban Planning, 177: 259-265. https://doi.org/10.1016/j.landurbplan.2018.05.021
[8] Glaeser, E.L., Resseger, M.G. (2010). The complementarity between cities and skills. Journal of Regional Science, 50(1): 221-244. https://doi.org/10.1111/j.1467-9787.2009.00635.x
[9] Pandey, B., Brelsford, C., Seto, K.C. (2022). Infrastructure inequality is a characteristic of urbanization. Proceedings of the National Academy of Sciences, 119(15): e2119890119. https://doi.org/10.1073/pnas.2119890119
[10] Wang, X., Shi, R., Zhou, Y. (2020). Dynamics of urban sprawl and sustainable development in China. Socio-Economic Planning Sciences, 70: 100736. https://doi.org/10.1016/j.seps.2019.100736
[11] Surya, B., Ahmad, D.N.A., Sakti, H.H., Sahban, H. (2020). Land use change, spatial interaction, and sustainable development in the metropolitan urban areas, South Sulawesi Province, Indonesia. Land, 9(3): 95. https://doi.org/10.3390/land9030095
[12] Kollai, I. (2021). Developmental or impoverishing urban cores? The case of Slovakia. In The Post-Crisis Developmental State: Perspectives from The Global Periphery. Cham: Springer International Publishing, pp. 197-216. https://doi.org/10.1007/978-3-030-71987-6_10
[13] Peón, D., Rodríguez‐Álvarez, J., López‐Iglesias, E. (2019). Spread or backwash: The impact on population dynamics and business performance of a new road in a rural county of Galicia (Spain). Papers in Regional Science, 98(6): 2479-2503. https://doi.org/10.1111/pirs.12463
[14] Cattaneo, A., Adukia, A., Brown, D.L., Christiaensen, L., Evans, D.K., Haakenstad, A., McMenomy, T., Partridge, M., Vaz, S., Weiss, D.J. (2022). Economic and social development along the urban-rural continuum: New opportunities to inform policy. World Development, 157: 105941. https://doi.org/10.1016/j.worlddev.2022.105941
[15] Chen, A., Partridge, M.D. (2013). When are cities engines of growth in China? Spread and backwash effects across the urban hierarchy. Regional Studies, 47(8): 1313-1331. https://doi.org/10.1080/00343404.2011.589831
[16] Ghai, S., Singh, M.P., Yigitcanlar, T. (2020). An integrated management approach for inclusive and sustainable urban development. International Journal of Management, 11(5): 1696-1713. https://doi.org/10.34218/IJM.11.5.2020.159
[17] Zaheer, K., Faiz, A. (2024). Economic corridors and regional development: Opportunities and risks. Kashf Journal of Multidisciplinary Research, 1(02): 11-20.
[18] Athukorala, P.C., Narayanan, S. (2018). Economic corridors and regional development: The Malaysian experience. World Development, 106: 1-14. https://doi.org/10.1016/j.worlddev.2018.01.009
[19] Elwood, S. (2002). Neighborhood revitalization throughcollaboration': Assessing the implications of neoliberal urban policy at the grassroots. GeoJournal, 58: 121-130. https://doi.org/10.1023/B:GEJO.0000010831.73363.e3
[20] Zhang, Y., Yang, Y., Wei, S., Ma, Z., Tian, M., Sun, M., Nie, J. (2022). Research on spatial structure and resilience of complex urban network: A case study of Jing-Jin-Ji Urban Agglomeration. Frontiers in Environmental Science, 10: 999124. https://doi.org/10.3389/fenvs.2022.999124
[21] Ji, J., Wang, S., Zhou, Y., Liu, W., Wang, L. (2021). Spatiotemporal change and coordinated development analysis of “population-society-economy-resource-ecology-environment” in the jing-jin-ji urban agglomeration from 2000 to 2015. Sustainability, 13(7): 4075. https://doi.org/10.3390/su13074075
[22] Taufiq, M., Kombaitan, B. (2019). Urban area entities in affecting regional development: A case study for mebidangro. Jurnal Wilayah dan Lingkungan, 7(3): 153-165. http://doi.org/10.14710/jwl.7.3.153-165
[23] Dewanto, F.W. (2021). Analisis ketimpangan pembangunan ekonomi antarwilayah (Studi di Kawasan Barat Indonesia dan Kawasan Timur Indonesia) Tahun 2014-2018. JIMEK: Jurnal Ilmiah Mahasiswa Ekonomi, 4(1): 28-42. https://doi.org/10.30737/jimek.v4i1.1471
[24] Palensa, Y.I., Marsoyo, A. (2024). Analisis ketergantungan kota bangkinang sebagai kota kecil terhadap kota pekanbaru sebagai kota induk di kawasan metropolitan pekansikawan (Pekanbaru, Siak, Kampar, dan Pelalawan). Desa-Kota: Jurnal Perencanaan Wilayah, Kota, dan Permukiman, 6(1): 171-183. https://doi.org/10.20961/desa-kota.v6i1.80046.171-183
[25] Kota Pekanbaru, B.P.S. (2024). Kota Pekanbaru Dalam Angka 2024. BPS Kota Pekanbaru. https://pekanbarukota.bps.go.id/id/publication/2024/02/28/0e92e9d9c971131ee3ea3a54/kota-pekanbaru-dalam-angka-2024.html.
[26] Ruel, M.T., Garrett, J., Yosef, S., Olivier, M. (2017). Urbanization, food security and nutrition. Nutrition and health in a developing world. S. de Pee, D. Taren, and M. W. Bloem, Eds. Cham: Springer International Publishing, pp. 705-735. https://doi.org/10.1007/978-3-319-43739-2_32
[27] Kampar, B.P.S.K. (2020). Kabupaten Kampar dalam Angka 2021. Kabupaten Kampar. https://kamparkab.bps.go.id/id/publication/2021/02/26/139190ffa3d30e682998f14d/kabupaten-kampar-dalam-angka-2021.html.
[28] Diniaty, D., Fauzi, A.M., Sunarti, T.C., Raharja, S. (2024). Selection of potential location for technopark based on pineapple SMEs using AHP-GIS techniques in Kampar Regency. Journal of Infrastructure, Policy and Development. Infrastructure, 8(10): 1-18. https://doi.org/10.24294/jipd.v8i10.7627
[29] Siak, B.P.S.K. (2022). Kabupaten siak dalam angka 2020. Siak, Kabupaten Siak. https://siakkab.bps.go.id/id/publication/2020/04/27/2e00f75f2b921cfa7f3a051f/kabupaten-siak-dalam-angka-2020.html.
[30] Pelalawan, B.P.S.K., Terbitan, B.T. (2023). Kabupaten Pelalawan dalam Angka. Publikasi BPS. Kabupaten Pelalawan.
[31] Dethier, J.J., Effenberger, A. (2012). Agriculture and development: A brief review of the literature. Economic Systems, 36(2): 175-205. https://doi.org/10.1016/j.ecosys.2011.09.003
[32] Rytova, E., Gutman, S., Sousa, C. (2021). Regional inclusive development: An assessment of Russian regions. Sustainability, 13(11): 5773. https://doi.org/10.3390/su13115773
[33] Mikheeva, N. (2020). Qualitative aspect of the regional growth in Russia: Inclusive development index. Regional Science Policy & Practice, 12(4): 611-627. https://doi.org/10.1111/rsp3.12289
[34] Jiao, J., Wang, J., Zhang, F., Jin, F., Liu, W. (2020). Roles of accessibility, connectivity and spatial interdependence in realizing the economic impact of high-speed rail: Evidence from China. Transport Policy, 91: 1-15. https://doi.org/10.1016/j.tranpol.2020.03.001
[35] Ren, Y., Tian, Y., Xiao, X. (2022). Spatial effects of transportation infrastructure on the development of urban agglomeration integration: Evidence from the Yangtze River Economic Belt. Journal of Transport Geography, 104: 103431. https://doi.org/10.1016/j.jtrangeo.2022.103431
[36] Buevich, A.P., Varvus, S.A., Terskaya, G.A. (2019). Investments in human capital as a key factor of sustainable economic development. In Institute of Scientific Communications Conference. Cham: Springer International Publishing. Springer, Cham, pp. 397-406. https://doi.org/10.1007/978-3-030-32015-7_44
[37] Herman, E., Suciu, M.C. (2019). Towards a smart, inclusive and sustainable development. Investment in human capital and innovation. An empirical analysis. In Proceedings of the International Conference on Business Excellence. Sciendo, 13(1): 792-803. https://doi.org/10.2478/picbe-2019-0070
[38] Patra, A.K., Acharya, A. (2011). Regional disparity, infrastructure development and economic growth: An inter-state analysis. Research and Practice in Social Sciences, 6(2): 17-30.
[39] Faisal, A.M., Zuriyani, E., Ulni, A.Z.P. (2024). Analisis spasial konektivitas wilayah terhadap pusat pertumbuhan di kota pekanbaru. EL-JUGHRAFIYAH, 4(2): 204-214. http://doi.org/10.24014/jej.v4i2.32209
[40] Indraningsih, K.S., Swastika, D.K. (2021). Akselerasi pembangunan pertanian wilayah tertinggal melalui penguatan kapasitas petani dan kelompok tani. In Forum Penelitian Agro Ekonomi, 39(2): 147-164. http://doi.org/10.21082/fae.v39n2.2021.147-164
[41] Rahmatullah, A.R., Dewi, D.I.K., Nurmasari, C.D.T. (2022). Integrasi antar transportasi umum di kota semarang. Jurnal Pengembangan Kota, 10(1): 36-46. https://doi.org/10.14710/jpk.10.1.36-46
[42] Firdatin, A., Gifary, N.A. (2021). Equitable regional infrastructure development as the government’s effort to reduce interregional social inequality in Indonesia. In Proceeding of the 1st International Conference on Social Sciences and Education (ICSSE 2021). https://icsse.ppkn.org/wp-content/uploads/2021/07/Aulia-Firdatin_Equitable-Regional-Infrastructure-Development-as-the-Governments-Effort-to-Reduce-Inter-Regional-Social-Inequality-in-Indonesia-Aulia-Firdatin.pdf.
[43] Rosyadi, M.I., Yulyanti, S. (2020). The effect of regional spillovers on economic growth in Pekanbaru city, Riau Province, Indonesia. International Journal of Economics Development Research, 3(1): 186-199. https://doi.org/10.37385/ijedr.v1i3.167
[44] Liu, Y., Liu, Y. (2021). Strategic objectives and regional orientation of urban-rural transformation in China. Urban-Rural Transformation Geography, 137-183. https://doi.org/10.1007/978-981-16-4835-9_5
[45] Rustiadi, E. (2018). Perencanaan dan pengembangan wilayah. Yayasan Pustaka Obor Indonesia.
[46] Ekosafitri, K.H., Rustiadi, E., Yulianda, F. (2017). Pengembangan wilayah pesisir pantai utara jawa tengah berdasarkan infrastruktur daerah: Studi kasus Kabupaten Jepara. Journal of Regional and Rural Development Planning (Jurnal Perencanaan Pembangunan Wilayah dan Perdesaan), 1(2): 145-157. https://doi.org/10.29244/jp2wd.2017.1.2.145-157
[47] Panuju, D.R., Rustiadi, E. (2013). Teknik analisis perencanaan pengembangan wilayah. Bogor: Lab. Pengembangan Wilayah, Departemen Ilmu Tanah dan Sumberdaya Lahan, Institut Pertanian Bogor.
[48] Rustiadi, E. 2000). Contiguous spatial classification a new approach on quantitative zoning method. Journal Geography Education, 43(8): 122-136.
[49] Kurnia, A.A., Rustiadi, E., Pravitasari, A.E. (2020). Characterizing industrial-dominated suburban formation using quantitative zoning method: The case of Bekasi regency, Indonesia. Sustainability, 12(19): 8094. https://doi.org/10.3390/su12198094
[50] Dobrescu, E.M., Dobre, E.M. (2014). Theories regarding the role of the growth poles in the economic integration. Procedia Economics and Finance, 8: 262-267. https://doi.org/10.1016/S2212-5671(14)00089-6
[51] Diniaty, D., Fauzi, A.M., Sunarti, T.C., Raharja, S., Helmi, F. (2024). Determination of superior commodities for the development of small and medium industries in Kampar Regency. Journal of Applied Engineering and Technological Science, 5(2): 995-1010. https://doi.org/10.37385/jaets.v5i2.4727
[52] Rustiadi, E., Pribadi, D.O., Pravitasari, A.E., Indraprahasta, G.S., Iman, L.S. (2015). Jabodetabek megacity: From city development toward urban complex management system. In Urban Development Challenges, Risks and Resilience in Asian Mega Cities. Springer, pp. 421-445. https://doi.org/10.1007/978-4-431-55043-3_22
[53] Mutiiria, O.M., Ju, Q., Dumor, K. (2020). Infrastructure and inclusive growth in sub-Saharan Africa: An empirical analysis. Progress in Development Studies, 20(3): 187-207. https://doi.org/10.1177/1464993420927507
[54] Sahoo, P., Dash, R.K. (2012). Economic growth in South Asia: Role of infrastructure. The Journal of International Trade & Economic Development, 21(2): 217-252. https://doi.org/10.1080/09638191003596994