Werenfridus Taena*![]() | Boanerges Putra Sipayung
| Boanerges Putra Sipayung![]() | Fried Markus Allung Blegur
| Fried Markus Allung Blegur![]() | Anggelina Delviana Klau
| Anggelina Delviana Klau![]()
© 2025 The authors. This article is published by IIETA and is licensed under the CC BY 4.0 license (http://creativecommons.org/licenses/by/4.0/).
OPEN ACCESS
The research focuses on the objectives of (1) to analyze the sustainable development index of farming based on the development dimension in dam service area on the Indonesia-Timor Leste border, (2) to analyze the influence of economic, social and ecological factors on sustainable development farming in dam service area on the Indonesia-Timor Leste border. The research uses a survey method. Primary data were obtained from 300 farmers who were determined randomly. Secondary data were obtained from the Food Crops and Horticulture Department, Central Statistics Agency, BMKG and other agencies. Data analysis using RAP Farm and PLS. The results of the RAP Farm analysis found that the sustainability index of farming in dam service area on the border country was moderate sustainable. Then, the results of the PLS analysis also found that economic factors significantly, influence sustainability, while social and ecological factors do not significantly influence sustainability. Likewise, production and income factors have an impact on sustainability, while equity and reduction of greenhouse gas emissions are not sustainable. Therefore, agriculture policies in dam service area are needed that guarantee linkages between development dimensions so that sustainable economic growth, income distribution and reduced gas emissions can be achieved simultaneously; and to expand the study of impacts across time and across countries.
sustainable development status, farming, dam service area, Indonesia-Timor Leste border
The new development paradigm has changed the perspective of development, which is more directed toward sustainable growth and equity [1]. Infrastructure development is an important aspect of spurring economic growth because it has an impact on expanding access, creating new jobs, and increasing income in a sustainable manner. The development of agricultural infrastructure has an impact on the emergence of new economic growth locations, so that other regions will also grow and develop simultaneously according to the potential of their respective regions, including ecological potential. However, reality shows that there is a trade-off between socio-economic and ecological development goals, where Scherer et al. [2] found that the impact of economic development occurs on ecological components such as land, water and carbon; so that integrative policies are needed to achieve sustainable development goals.
Fauzi [3] is of the view that the pillars of sustainable development include economic, social, and ecological environments that are interconnected and must develop in a balanced manner. Purvis et al. [4] stated efforts to align economic, social and ecological through the concept of sustainability. The United Nation has established the Sustainable Development Goals (SDG's) which were subsequently ratified in Indonesia through [5] concerning the Elaboration of Sustainable Development Goals. The pillars of sustainable development according to the SDG's include social, economic, and ecological environments as well as governance.
Agricultural infrastructure development generally has a positive impact on socio-economic components such as economic growth and income equality; as found by Taena et al. [6]. However, sometimes agricultural infrastructure development does not consider the ecological environmental components, so it tends to cause environmental problems. Rozikin [7] found that infrastructure development increases per capita income in a region, but causes negative impacts such as a decrease in ecological quality in the form of shrinking natural resources, the emergence of social inequality, and depends on several factors that can affect the sustainability of agricultural businesses, namely water quality and quantity, carbon emissions produced in farming, the amount of organic material used in farming, and rainfall.
The same view was also expressed by Johns-Putra [8] that economic development results in land conversion resulting in erosion and degradation of water resources. Furthermore, development also has an impact on carbon emissions which fluctuate greatly depending on climate, soil and hydrological factors. According to Epron et al. [9], there are two critical factors of the biophysical environment that fluctuate, but have a major influence on CO2 emissions, namely temperature and soil moisture. Davidson and Janssens [10] stated that soil temperature and moisture conditions are influenced by solar radiation, rainfall, and groundwater levels whose conditions change over time.
According to Westgate et al. [11], new habitats will be formed after the dam is built as experienced in Southeast Australia; so, a policy is needed that integrates dam construction policies with land use planning and agricultural production as Pisaniello and Tingey-Holyoak [12]. The development of agricultural infrastructure (especially the Rotiklot Dam) in Belu Regency, NTT Province, which directly borders the neighboring country of Timor Leste, is a manifestation of government policy to meet agricultural water needs, thereby increasing agricultural production. Taena et al. [6] stated that the development of the Rotiklot Dam increased agricultural production and farmer income in the border area. Taena et al. [13] also found that farmer income inequality decreased from medium (GR = 0.44) to low (GR = 0.28) after farmers used water from the Rotiklot Dam for agricultural purposes. However, the ecological aspect, which is one of the pillars of sustainable development, has not been studied.
Basiago [14] stated that the pillars of sustainable development include economic, social and ecological pillars; which were later introduced as a green economy, and the main sector that implements it is the agricultural sector. The challenge for sustainable agriculture in the border areas of Indonesia and Timor Leste is economic growth for all in environmental conditions that support sustainability. The conditions of the border areas are more complex because the boundaries of the ecological functional areas are different from the boundaries of the state administrative areas. The findings of Taena et al. [15] prove that extensive agricultural activities in the Indonesian region have caused environmental impacts not only in the Indonesian region, but also in the Timor Leste region because they are in the same ecological functional area. Increasing agricultural production and income distribution needs to be supported by ecological conditions in the dam service area in a sustainable manner because dam construction changes community agricultural activities; as well as the findings of Pisaniello and Tingey-Holyoak [12] and Lund et al. [16] that dam construction changes land use patterns and the selection of agricultural commodities.
Taena et al. [6] conducted an analysis of the impact of dam construction on production and income; which was continued by analyzing the impact of dam development on the economic (growth) and social (equity). The state of the art of this study compared to previous studies is that the research is expanded by analyzing ecological factors and analyzing the sustainable development status of economic, social and ecological in dam service area. Therefore, this study aims (1) to analyze the sustainable development index of farming based on of the development dimension in dam service area on the Indonesia-Timor Leste border, (2) to analyze the influence of economic, social and ecological factors on sustainable development farming in dam service area on the Indonesia-Timor Leste border area.
2.1 Research locations
The research was carried out in April-August 2024 in the dam service area on the border of Indonesia and Timor Leste, especially Kakuluk Mesak District, Belu Regency, East Nusa Tenggara Province. A map of the research location is shown in Figure 1. Kakuluk Mesak District is one of the priority locations for the development of the border areas of Indonesia and Timor Leste [17].
Figure 1. Map of research location
Source: INA geoportal
2.2 Data collection
The data used is primary data and secondary data. Secondary data were obtained from the Public Works and Public Housing Service, Food Crops and Horticulture Department, Central Statistics Agency, BMKG and other agencies. Primary data was obtained through interviews and observations. The population is 4,500 people in Kakuluk Mesak Subdistrict. Samples were taken in stages, first, determining sample villages purposively with consideration of villages that have routinely used irrigation water from the Rotiklot Dam so that Fatuketi Village was selected; second, Farmer samples were taken randomly as many as 300 respondents. The data collected were updated data on social, economic, production, income and equality factors. In addition, new data collected includes ecological factors, gas emissions and sustainability. Economic, social and ecological factors are determining factors of production, income and sustainability. In line with Evdokimova and Kuzubov [18] who stated that synergy between economic, social and ecological dimensions is a prerequisite for achieving optimum profit.
2.3 Data analysis
The first objective is to analyze the sustainability of agricultural farming using a multidimensional scaling (MDS) approach called the RAP-Farm (The Rapid Appraisal of the Status of Farming) method [19]. The Rap-Farm approach was modified from the Rapfish (Rapid Assessment Techniques for Fisheries) program developed by the Fisheries Center, University of British Columbia [20]. The MDS method is a statistical analysis technique that transforms each dimension and multidimensional dimension into the sustainability of farming. The use of MDS analysis has various advantages such as simplicity, easy assessment, fast and relatively low costs [21]. Determination of the sustainability index for each dimension is divided into four categories [20], as in Table 1.
The second objective analyzed using the Structure Equation Model Partial Least Square (SEM-PLS). Calculations were carried out using SmartPLS software [22]. Production is reflected by planting area (Pr1), seeds (Pr2), fertilizer (Pr3), number of workers (Pr4), farming experience (Pr5). Income, which is an economic indicator of development goals, is reflected in farming revenues (I1], commodity selling costs (I2), seed costs (I3), pesticide costs (I4), fertilizer costs (I5). Social is reflected in motivation (FS1), farmer group activity (FS2), cooperation (FS3), social control (FS4), and the ability to access information (FS5). Economic factors are reflected in the variable costs of farming (FE1), land area (FE2), fixed costs of farming (FE3), length of education (FE4), increased investment in farming (FE5). Ecology is reflected in the amount of carbon emissions produced in farming (Ek1), the amount of organic material used in farming (Ek2), farmers' perceptions regarding weather conditions (Ek3), farmers' perceptions regarding water quality and quantity (Ek4). Equity, which is the social goal of development, is reflected in the possible number of farmers of income level (E1), the difference in income from previous farming (E2), the difference in capital from previous farming capital (E3), the difference in planting area from previous farming (E4). The reduction in gas emissions is reflected by the release of CO2 gas (Pg1), the release of CH4 gas (Pg2), the release of N2O gas (Pg3). Sustainability is reflected in food security (S1), fertilizer independence (S2), farmer independence (S3), increasing the planting period (S4). The data analysis framework is shown in Figure 2.
Table 1. Sustainability farming status categories based on RAP-Farm index
|
Index Value |
Category |
|
0 – 25 |
Not Sustainable |
|
26 – 49 |
Less Sustainable |
|
50 – 75 |
Moderate Sustainable |
|
76 – 100 |
Very Sustainable |
Figure 2. Flowchart of data analysis
3.1 Results of analysis of sustainable development index of farming in dam service area
3.1.1 Economic dimension of sustainable development index of farming in dam service area
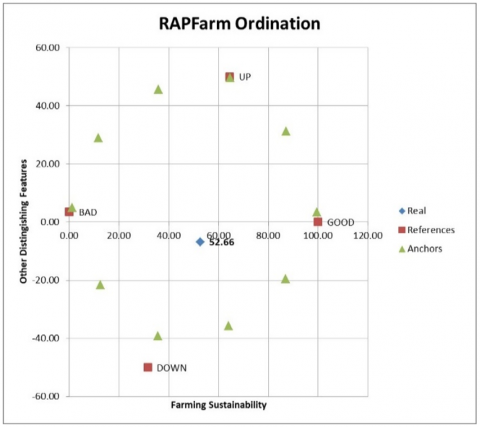
Attributes that are estimated to have an influence on the level of sustainability in the economic dimension consist of food security, cooperation, fertilizer independence and farmer independence. Fertilizer independently determines production and income. In line with Khajuria et al. [23] who stated that the economic dimension is related to production factors, production and sustainable income and their distribution. The results of the MDS analysis carried out using RAP-Farm show that the economic conditions of the farming in dam service area in the Indonesia-Timor Leste border region have an economic dimension sustainability index value of 52.66%. Based on the sustainability index classification, it shows that the economic conditions of farming in dam service area in the Indonesia-Timor Leste border region are included in the moderately sustainable category. The results of the MDS analysis using RAP-Farm are shown in Figure 3.
Based on the results of the leverage analysis of attributes in the economic dimension, it was found that the attribute that had the highest sustainability sensitive value to sustainability is investment in agriculture (6.01), followed by variable costs (3.44), fixed costs (1.98), land area (1.68) and the last is the length of education attribute (1.22) as shown in Figure 4. Efforts to improve the sustainability of the economic dimension are more easily realized through increasing agricultural investment and increasing variable costs. Better investment makes it easier for farmers to adopt agricultural technological innovations, thereby increasing agricultural income and sustainable economic development. In line with Lund et al. [16] and Sukayat et al. [24] who stated that investment in education has a significant influence on agricultural innovation, thereby ensuring sustainable agriculture and adaptation of economic development; and Bi et al. [25] stated that subsidized agricultural production costs also determine sustainable agriculture.
Figure 3. Economic dimension sustainability index of farming in dam service area
Figure 4. Leverage of economic attributes
3.1.2 Social dimension of sustainable development index of farming in the dam service area
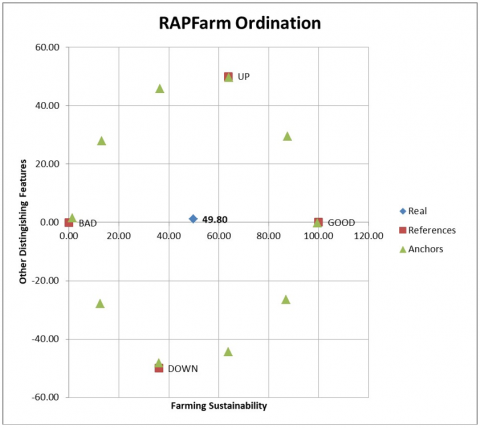
The social dimension attributes that are thought to have an influence on the level of sustainability include farmer group activities, motivation and the ability to access information. These attributes increase social capital which, Heravi et al. [26] determine the sustainability of social aspects of development in developing countries. The results of the MDS analysis using RAP-Farm on farming in the dam service area on the border of Indonesia and Timor Leste show a social dimension sustainability index value of 49.80% (Figure 5); which shows that the social conditions of farming in dam service area on border area of Indonesia-Timor Leste are less sustainable.
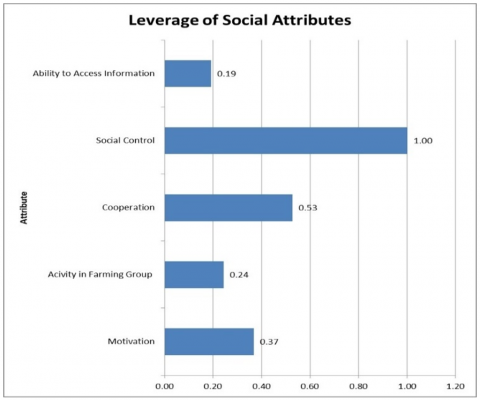
Based on the results of the leverage analysis of attributes in the social dimension as shown in Figure 6, it was found that attributes were sensitive to the sustainability index of the social dimension, namely social control (1.00), cooperation (0.53), motivation (0.37), activeness of farmer groups (0.24), and the ability to access information (0.19). The sustainability status of the social dimension will increase if it is able to increase the attributes of social control and cooperation; because social control and cooperation are important for designing integrated policies that include land conversion for dam, development of dam, and equitable water use; as is good practice implemented in other countries as stated by Pisaniello and Tingey-Holyoak [12].
3.1.3 Ecological dimension of the sustainable development index of farming in dam service area
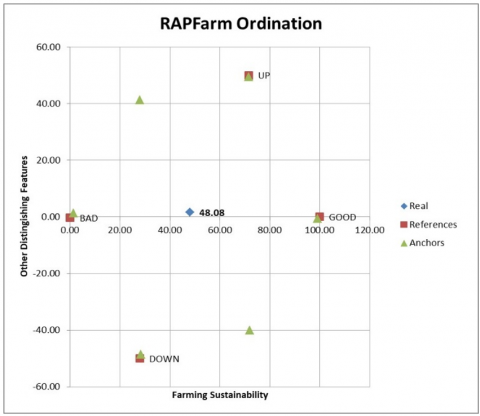
Attributes that can influence survival rates in the ecological dimension consist of water quality and quantity, weather conditions, and organic material using in farming. Climatic conditions determine the comparative advantage of a region and have an impact on the sustainability dimension, as Tiwari and Tiwari [27] also found that comparative and competitive advantages in ecological conditions can reduce the impact on the environment. The results of the MDS analysis carried out with RAPFARM in the border area of Indonesia and Timor Leste show that the index value of the ecological dimension is 48.08% (Figure 7), which is in the less sustainable category.
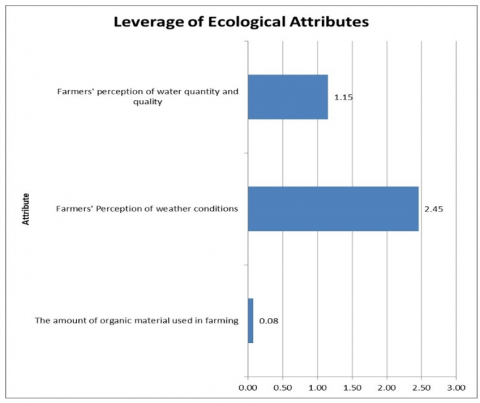
The results of the attribute leverage analysis on the ecological dimension in Figure 8 showed that the attribute that has the highest sensitivity to sustainability is farmer perception of weather conditions, which is 2.45 and the attribute of farmer perception on water quality and quantity is 1.15 and finally the attribute of the amount of organic material used in farming is only 0.08. These results indicate the weather changes and water quantity are priorities in efforts to improve the sustainability status of the ecological dimension. New habitats in the dam service area have begun to form due to the increase in water quantity marked by the extensification and intensification of agriculture including the frequency of planting to two planting seasons; which shows the dependence of agricultural efforts on irrigation water from the dam, in addition to rainwater (rain-fed rice fields). Baba and Hack [28] stated that stakeholder perceptions and assessments of dam ecosystem services are useful for improving dam management. Therefore, water management is needed for sustainable productive needs, as found by Blanco et al. [29] that water use design allows for sustainable water use, as well as the integration of agriculture and conservation [11, 30].
Figure 5. Social dimension sustainability index of farming in dam service area
Figure 6. Leverage of social attributes
Figure 7. Ecology dimension sustainability index of farming in dam service area
Figure 8. Leverage of ecological attributes
3.1.4 Multi-dimensional analysis of sustainable development index of farming in dam service area
Agricultural development in the dam service area on the border areas of Indonesia and Timor Leste has a fairly sustainable status with a sustainability index value of 50.18%. The fairly sustainable status is reflected in the average sustainability index value of each development dimension which respectively, includes the economic dimension (52.66%), while the social dimension (49.80%) and ecology (48.08). Efforts to improve the development dimensions (economic, social and ecological) simultaneously, especially improvements to the sensitive attributes of each dimension including improvements in agricultural cultivation technology will affect the sustainability of farming that utilizes irrigation water from the dam; Because the farming in the border area generally less technology, as also found by Simamora et al. [31]. Hui et al. [32] stated that rice cultivation technology using the SRI method can improve the sustainability of economic, social and ecological dimensions. Apart from that, there is a need to improve sensitive attributes that influence the index values of economic, social and ecological dimensions. The sustainability index values are as listed in Table 2 and Figure 9.
Table 2. The sustainable development index of farming in dam service area on the Indonesia-Timor Leste border region
|
Sustainability Dimension |
Index |
Category |
|
Economy |
52.66% |
Moderate Sustainable |
|
Social |
49.80% |
Less Sustainable |
|
Ecology |
48.08% |
Less Sustainable |
|
Average |
50.18% |
Moderate Sustainable |
Figure 9. Spider web diagram of the sustainable development index of farming in dam service area on the Indonesia-Timor Leste border area
3.2 Analysis of economic, social and ecological factors that influence of sustainable farming in dam service area
3.2.1 Validity and reliability test
a. Convergent validity
The convergent validity test aims to show that each indicator represents the latent variable. The results of the convergent validity test show an outer loading value is > 0.7, which means that each indicator is valid in representing the latent variable. Each indicator used in latent variable representation using SEM PLS is valid if it has an outer loading value > 0.7 [22, 33]. The Valid indicators for each variable are shown in Table 3.
b. Reliability test
Composite reliability aims to measure the consistency and stability of each variable in measuring a concept or model used. The model used in the research has a composite reliability value of > 0.7 for each variable, so the model used is reliable [33, 34]. The results of the reliability analysis are shown in Table 4.
Table 3. Convergent validity results
|
Variable |
Indicator |
Outer Loading Value |
Information |
|
Equity |
Increasing Planting Area |
1.00 |
Valid |
|
Ecological Factor |
Weather Perception |
1.00 |
Valid |
|
Economic Factor |
Variable cost |
0.967 |
Valid |
|
Increased Investment |
0.96 |
Valid |
|
|
Social Factor |
Farmer Group Activity |
0.828 |
Valid |
|
Collaboration Ability |
0.864 |
Valid |
|
|
Social Control |
0.836 |
Valid |
|
|
Income |
Business Revenue |
0.911 |
Valid |
|
Commodity Selling Costs |
0.792 |
Valid |
|
|
Seed Costs |
0.901 |
Valid |
|
|
Fertilizer Costs |
0.867 |
Valid |
|
|
Gas Release |
Amount of CO2 Gas |
0.99 |
Valid |
|
Amount of CH4 Gas |
0.90 |
Valid |
|
|
Product |
Amount of Seed |
0.894 |
Valid |
|
Amount of fertilizer |
0.925 |
Valid |
|
|
Sustainability |
Food Security |
1.00 |
Valid |
Table 4. Reliability test results
|
Variable |
Composite Reliability |
Information |
|
Equity |
1.00 |
Reliable |
|
Ecology |
1.00 |
Reliable |
|
Economic Factor |
0.96 |
Reliable |
|
Social Factor |
0.88 |
Reliable |
|
Income |
0.93 |
Reliable |
|
Gas Release |
0.99 |
Reliable |
|
Production |
0.91 |
Reliable |
|
Sustainability |
1.00 |
Reliable |
3.2.2 Model of goodness test
The results of the analysis show that the variables of production, income, gas emissions, equity and sustainability have predictive power due to the contribution of each indicator. The R-square value aims to describe the size of the construct variable describing the latent variable [35]. Production variable (R² = 0.826). This value indicates that 82.6% of the variability in production can be explained by the factors in the model. The income variable (R² = 0.929) means that 92.9% of the variability can be explained, which shows that the model has very strong income prediction capabilities. Gas emission release variable (R² = 0.865). This variable is explained by 86.5%, which shows that the factors in the model are able to substantially predict the release of gas emissions. The equity and sustainability variables have an R2 of 0.013 and 0.138 which explains 1.3% of the construct variable explaining the equity variable and 13.8% of the construct variable explaining the sustainability variable.
F-square measures the influence of a latent variable on other variables in the model. Economic factors make a very significant contribution to production (F² = 4.729). The F-square value confirms that economic factors are the main drivers in the model, especially those related to production. Social and Ecological Factors only have a small influence on various other variables, especially those related to equity and Gas Emission release, with an F-square value below 0.15 indicating that the influence of ecological factors in this model is still weak for social factors and very weak for ecological factors. Income has a moderate influence on Production (F² = 1.496) and Gas Emissions (F² = 0.629) indicating the important role of income in influencing the production process and its impact on emissions. Latan and Ramli [36] stated that if the f square value is 0.02, it means that the model has a very small influence, and the influence has small if the value is <0.15. The model has a moderate effect if the value is 0.15 until 0.34, and has a large effect if the value is ≥ 0.35.
The Q2 value measures the predictive ability of a model [37] stated the Q2 value greater than zero indicates good predictive relevance. All Q2 values of the variables used in this model are greater than zero, which states that this model has good predictive relevance. The model used in this research has very strong predictive capabilities in terms of production, income and equity. Economic factors proved to be the main driver in influencing production and income, while social and ecological factors had little influence (Table 5).
Table 5. Model of goodness test results
|
R2 and Q2 |
|||||
|
Variable |
R2 |
Q2 |
|
|
|
|
Production |
0.826 |
0.672 |
|
|
|
|
Income |
0.929 |
0.688 |
|
|
|
|
Gas Emission Release |
0.865 |
0.02 |
|
|
|
|
Equity |
0.013 |
0.857 |
|
|
|
|
Sustainability |
0.138 |
0.12 |
|
|
|
|
F2 |
|||||
|
Laten Variable |
Production |
Income |
Equity |
Gas Emission Release |
Sustainable |
|
Social Factor |
0.013 |
0.06 |
0.07 |
- |
- |
|
Ecology |
0.012 |
- |
- |
0.013 |
- |
|
Economic Factor |
4.729 |
0.1 |
0.07 |
0.085 |
- |
|
Production |
- |
1.496 |
0.08 |
0.629 |
0.05 |
|
Income |
- |
- |
- |
- |
0.043 |
|
Equity |
- |
- |
- |
- |
0.03 |
|
Gas Emission Release |
- |
- |
- |
- |
0.01 |
3.2.3 Path analysis of social, economic and ecological factors that influence on sustainable farming in dam service area on Indonesia-Timor Leste border
The results of the SEM PLS analysis found that some variables had no significant effect and some variables had a significant effect on the sustainability of farming in dam service area on the Indonesia-Timor Leste border. The influence is direct and indirect, which is obtained through the path coefficient and p-value, in line with opinion [38]. The analysis of direct and indirect effects is useful for building an efficient, equitable and sustainable water distribution system, as well as the findings of Plamonia et al. [39] that it is very important to build sustainable water supply and cost-efficient management. The variables that have a significant effect and did not have a significant effect on the sustainability of farming in dam service area on the border areas of Indonesia and Timor Leste are shown in Table 6 and Table 7.
Table 6. Sustainability indicators that are significant to sustainable development of farming in dam service area on Indonesia-Timor Leste border
|
No. |
Dimension |
Significant |
|
I |
Economy -> Income |
0.0000a |
|
|
Economy -> Gas Emision Release |
0.0000a |
|
|
Economy -> Production |
0.0000a |
|
|
Economy -> Sustainable_ |
0.0000a |
|
|
Economy -> Production-> Equity |
0.0520 |
|
|
Economy -> Production -> Income |
0.0000a |
|
|
Economy -> Production -> Sustainable_ |
0.0700a |
|
|
Economy -> Production -> Income-> Sustainable_ |
0.0000a |
|
|
Economy -> Production -> Gas Emission Release |
0.0000a |
|
|
Economy -> Income-> Sustainable_ |
0.0020a |
|
II |
Social -> Income |
0.2380 |
|
|
Social -> Income |
0.1680 |
|
III |
Ecology -> Income |
0.1210 |
|
|
Ecology -> Production |
0.1150 |
|
|
Ecology -> Sustainable_ |
0.2180 |
|
|
Ecology -> Production -> Gas Emission Release |
0.1180 |
|
|
Ecology -> Production-> Income -> Sustainable_ |
0.1650 |
|
IV |
Production -> Equity |
0.0510 |
|
|
Production -> Income |
0.0000a |
|
|
Production -> Gas Emission Release |
0.0000a |
|
|
Production -> Sustainable_ |
0.0000a |
|
|
Production -> Income -> Sustainable_ |
0.0000a |
|
V |
Pendapatan -> Sustainable_ |
0.0000a |
Table 7. Sustainability indicators that are not significant towards sustainable development of farming in dam service area on Indonesia-Timor Leste border
|
No. |
Dimension |
P-Values |
|
I |
Economy -> Equity |
0.9410 |
|
|
Economy -> Emissions -> Sustainable_ |
0.5610 |
|
|
Economy -> Equity -> Sustainable_ |
0.4380 |
|
|
Economy -> Production -> Equity -> Sustainable_ |
0.5270 |
|
|
Economy -> Production -> Emissions -> Sustainable_ |
0.5650 |
|
II |
Social -> Emissions |
0.2690 |
|
|
Social -> Production |
0.2670 |
|
|
Social -> Sustainable_ |
0.3510 |
|
|
Social -> Equity -> Sustainable_ |
0.6090 |
|
|
Social -> Production -> Income -> Sustainable_ |
0.3320 |
|
|
Social -> Production -> Equity |
0.3930 |
|
|
Social -> Production -> Emissions -> Sustainable_ |
0.6450 |
|
|
Social -> Production -> Equity -> Sustainable_ |
0.6720 |
|
|
Social -> Production -> Income |
0.2780 |
|
|
Social -> Income -> Sustainable_ |
0.3390 |
|
|
Social -> Production -> Emissions |
0.2690 |
|
|
Social -> Production -> Sustainable_ |
0.3950 |
|
III |
Ecology -> Equity |
0.2660 |
|
|
Ecology -> Emission Release |
0.2650 |
|
|
Ecology -> Production -> Equity |
0.2660 |
|
|
Ecology -> Emission Release -> Sustainable_ |
0.9300 |
|
|
Ecology -> Production -> Income |
0.1210 |
|
|
Ecology -> Production -> Equity -> Sustainable_ |
0.6090 |
|
|
Ecology -> Production -> Equity -> Sustainable_ |
0.6270 |
|
|
Ecology -> Production -> Emission Release -> Sustainable_ |
0.2700 |
|
IV |
Production -> Equity -> Sustainable_ |
0.5270 |
|
|
Production -> Gas Emission Release -> Sustainable_ |
0.5650 |
|
V |
Equity -> Sustainable |
0.4180 |
|
VI |
Gas Emission Release -> Sustainable |
0.5590 |
a. The Influence of economic factors on sustainable farming in dam service area on the State Borders
Economic factors reflected by variable costs and increased farming investment have a positive and significant effect on the sustainability directly and indirectly (through production and income). Variable costs consisting of the use of the number of seeds, use of fertilizer, and labor; followed by increased investment by farmers in the use of agricultural tools and machinery have an impact on increasing agricultural production and farmer income, but also have an impact on increasing greenhouse gas emissions released. The reason is because farmers in the dam service area in the border region do not yet have independence in the use of fertilizers and the use of fossil energy from agricultural tools. Increasing investment in agriculture is correlated with the release of greenhouse gas emissions, as found [40]. In line with Genstwa and Zmyślona [41], which states that the reduction in greenhouse gas emissions is supported by fertilizer independence and the use of agricultural tools and machines that use renewable energy.
b. The Influence of social factors on the sustainable farming in dam service area on the State Borders
Social variables which are reflected in motivation, farmer group activity, cooperation, social control, and the ability to access information have a positive and significant effect on income and equality, while they do not have a significant effect on sustainability. The increase in social factors that have been attached to farmers in dam service area on the Border Region increases farm income fairly evenly. The development of farmer groups also becomes a vehicle and process for exchanging information as well as becoming a social network within and between farmer groups. The institutional development of farmers also brings changes in behavior to increase their income. Farmer institutions (farmer groups) function as a forum for the learning process, a vehicle for cooperation, a unit providing production facilities and infrastructure, a production unit, a processing and marketing unit, and a supporting services unit. Apart from that, farmer institutions are also a vehicle for social capital for farmers on an ongoing basis. Previous findings [42] also explained that social and economic factors in farming can increase farmers' productivity and income. Social factors do not have an effect through mediation as shown in Table 7, which indicates that farmer’s social capital practiced through mutual cooperation is slowly disappearing because farmers are starting to be individualistic and less concerned about collective welfare.
c. The Influence of ecological factors on the sustainable farming in dam service area on State Borders
Ecological variables are reflected in the amount of organic matter used in farming, farmers' perceptions of weather conditions, farmers' perceptions of water quality and quantity have a positive and insignificant effect on the sustainability directly or indirectly (through production and income). Ecological factors also have no significant effect (at α=10%) on the release of gas emissions. The widespread use of chemicals and intensive use of land for farming have long-term consequences for environmental damage. The application of environmentally friendly agriculture in farming through controlling the use of chemical inputs, and substitution with natural inputs prevents plant damage, increases soil and plant nutrition so that it has a good impact on increasing production and household income of farmers. Previous findings [43] showed that farmers' knowledge about ecology can increase farmer household income in a sustainable manner.
d. The Influence of production factors on the sustainable farming in dam service area on State Borders
Production variables reflected by the number of seeds and the amount of fertilizer have a positive and significant effect on the sustainability directly and indirectly (through income). Production factors also have a significant effect on income, income distribution, and the release of gas emissions. Farmers in border areas are traditional farmers who increase agricultural production by increasing the area planted (extensification) which has an impact on increasing income and income equality, but also has implications for increasing gas emissions due to increased use of inappropriate fertilizer doses. This is in accordance with Czyżewski and Michałowska [44] who found that there is a correlation between increased production and increased greenhouse gas releases.
e. The Influence of income factors, equity, and gas emission releases on the sustainable farming in dam service area on National Borders.
Income has a significant direct effect on sustainability; while equalization, and the release of gas emissions do not have a significant effect on the sustainability of farming in dam service area on state borders. Farmers' income increases as a result of the use of irrigation water from the Dam, which has implications for sustainable farming in border areas, but the impact of equalizing income and reducing greenhouse gas emissions is not sustainable. Chamas et al. [45] stated that economic efficiency, equity and the environment are the basis for consideration in the allocation of water resources for agriculture.
Therefore, efforts are needed that can optimize growth and equalize income as well as reduce greenhouse gas emissions simultaneously through interactions between social, economic, and ecological factors using formative models or dynamic models. Aarts and Drenthen [46] stated that policy transformation is needed that interacts with socio-ecological components to realize sustainable development. In addition, studies are needed related to increasing community participation in realizing sustainable development over time and analyzing cross-regional and even cross-country impacts.
The sustainability status of farming in dam service area on the border of Indonesia and Timor Leste is moderately sustainable. Factors that have a significant influence on the sustainability of farming are economic factors, while social and ecological factors have an influence on sustainability but are not significant. Therefore, agriculture policies in the service area of the dam are needed to optimize the dimensions of development and guarantee linkages between development dimensions so that sustainable economic growth, income distribution and reduced gas emissions can be achieved simultaneously; and to expand the study of impacts across time and across countries.
Directorate General of Higher Education Research and Technology Ministry of Education and Culture, Indonesia under the basic research scheme (No: 100/E5/PG.02.00.PL/2024).
[1] Rustiadi, E., Saefulhakim, S., Panuyu, D.R. (2009). Perencanaan dan Pengembangan Wilayah. Jakarta: Yayasan Pustaka Obor Indonesia.
[2] Scherer, L., Behrens, P., De Koning, A., Heijungs, R., Sprecher, B., Tukker, A. (2018). Trade-offs between social and environmental Sustainable Development Goals. Environmental Science & Policy, 90: 65-72. https://doi.org/10.1016/j.envsci.2018.10.002
[3] Fauzi, A. (2019). Teknik Analisis Keberlanjutan. Gramedia Pustaka Utama.
[4] Purvis, B., Mao, Y., Robinson, D. (2019). Three pillars of sustainability: In search of conceptual origins. Sustainability Science, 14: 681-695. https://doi.org/10.1007/s11625-018-0627-5
[5] Presiden RI. Peraturan Presiden RI. No. 111 Tahun 2022. Kementeri Sekr Negara RI. 2022. https://peraturan.bpk.go.id/Details/227039/perpres-no-111-tahun-2022.
[6] Taena, W., Sipayung, B.P., Blegur, F.M.A., Klau, A.D. (2023). Impact of agricultural infrastructure development on inequality and optimization equality of farmers’ income in Indonesia-Timor Leste border area. Asian Journal of Agriculture and Rural Development, 13(4): 269-276. https://doi.org/10.55493/5005.v13i4.4933
[7] Rozikin, M. (2012). Analisis pelaksanaan pembangunan berkelanjutan di Kota Batu. JRP (Jurnal Review Politik), 2(2): 219-243. https://doi.org/10.15642/jrp.2012.2.2.219-243
[8] Johns-Putra, A. (2016). Climate change in literature and literary studies: From cli-fi, climate change theater and ecopoetry to ecocriticism and climate change criticism. Wiley Interdisciplinary Reviews: Climate Change, 7(2): 266-282. https://doi.org/10.1002/wcc.385
[9] Epron, D., Farque, L., Lucot, É., Badot, P.M. (1999). Soil CO2 efflux in a beech forest: Dependence on soil temperature and soil water content. Annals of Forest Science, 56(3): 221-226. https://doi.org/10.1051/forest:19990304
[10] Davidson, E.A., Janssens, I.A. (2006). Temperature sensitivity of soil carbon decomposition and feedbacks to climate change. Nature, 440(7081): 165-173. https://doi.org/10.1038/nature04514
[11] Westgate, M.J., Crane, C., Smith, D., O’Malley, C., Siegrist, A., Florance, D., Lang, E., Crane, M., Hingee, K., Scheele, B.C., Lindenmayer, D.B. (2022). Improved management of farm dams increases vegetation cover, water quality, and macroinvertebrate biodiversity. Ecology and Evolution, 12(3): e8636. https://doi.org/10.1002/ece3.8636
[12] Pisaniello, J.D., Tingey-Holyoak, J.L. (2024). Farm dams and the need for integrated water storage safety, equity and land-use policy: Comparative case study evidence from Australia. Journal of Cleaner Production, 476: 143707. https://doi.org/10.1016/j.jclepro.2024.143707
[13] Taena, W., Blegur, F.M.A., Sipayung, B.P., Klau, A.D. (2023). Income optimization by utilizing rotiklot dam irrigation and marginal agricultural land in border area. In 3rd International Conference on Agriculture (ICA 2022), pp. 48-59. https://doi.org/10.2991/978-94-6463-168-5_7
[14] Basiago, A.D. (1998). Economic, social, and environmental sustainability in development theory and urban planning practice. Environmentalist, 19(2): 145-161. https://doi.org/10.1023/A:1006697118620
[15] Taena, W., Kolopaking, L.M., Barus, B., Boer, R., Juanda, B. (2018). The implication of spatial ecology dependence on spatial arrangement in boundary area. Jurnal Manajemen Hutan Tropika, 24(1): 1-9. https://doi.org/10.7226/jtfm.4.1.12
[16] Lund, A.J., Lopez-Carr, D., Sokolow, S.H., Rohr, J.R., De Leo, G.A. (2021). Agricultural innovations to reduce the health impacts of dams. Sustainability, 13(4): 1869. https://doi.org/10.3390/su13041869
[17] Peraturan Presiden (PERPRES) Nomor 179 Tahun 2014 tentang Rencana Tata Ruang Kawasan Perbatasan Negara di Provinsi Nusa Tenggara Timur. (2014). https://peraturan.bpk.go.id/Details/41698/perpres-no-179-tahun-2014.
[18] Evdokimova, M., Kuzubov, S. (2021). Non-financial reporting and the cost of capital in BRICS countries. Higher School of Economics Research Paper No. WP BRP, 83.
[19] Saida, S. (2011). Analisis keberlanjutan usahatani hortikultura sayuran pada lahan berlereng di hulu DAS Jeneberang, Sulawesi Selatan. Jurnal Matematika Sains dan Teknologi, 12(2): 101-112. https://doi:10.33830/jmst.v12i2.550.2011
[20] Fauzi, A. (2005). Pemodelan Sumber Daya Perikanan dan Kelautan Untuk. Analisis Kebijakan. Jakarta: Gramedia Pustaka Utama.
[21] Pitcher, T.J., Preikshot, D. (2001). RAPFISH: A rapid appraisal technique to evaluate the sustainability status of fisheries. Fisheries Research, 49(3): 255-270. https://doi.org/10.1016/S0165-7836(00)00205-8
[22] Hair Jr, J.F., Hult, G.T.M., Ringle, C.M., Sarstedt, M., Danks, N.P., Ray, S. (2021). An introduction to structural equation modeling. In: Partial Least Squares Structural Equation Modeling (PLS-SEM) Using R. Classroom Companion: Business. Springer, Cham. https://doi.org/10.1007/978-3-030-80519-7_1
[23] Khajuria, A., Matsui, T., Machimura, T., Morioka, T. (2009). Promoting sustainability with ecological, economic and social dimensions in developing countries. Chinese Journal of Population Resources and Environment, 7(4): 15-18. https://doi.org/10.1080/10042857.2009.10684947
[24] Sukayat, Y., Setiawan, I., Suharfaputra, U., Kurnia, G. (2023). Determining factors for farmers to engage in sustainable agricultural practices: A case from Indonesia. Sustainability, 15(13): 10548. https://doi.org/10.3390/su151310548
[25] Bi, A.Z., Umesh, K.B., Abdul, B.M., Sivakuma, D., Srikanth, P. (2024). Economic and environmental sustainability of agriculture production at the crop level. Global Journal of Environmental Science & Management (GJESM), 10(3): 1433-1456. https://doi.org/10.22034/gjesm.2024.03.29
[26] Heravi, G., Fathi, M., Faeghi, S. (2017). Multi-criteria group decision-making method for optimal selection of sustainable industrial building options focused on petrochemical projects. Journal of Cleaner Production, 142: 2999-3013. https://doi.org/10.1016/j.jclepro.2016.10.168
[27] Tiwari, R.K., Tiwari, J.K. (2020). Prioritisation of attributes of green leanness and agility to achieve sustainable strategic advantages in Indian automotive SMEs environment. International Journal of Industrial and Systems Engineering, 36(3): 316-338. https://doi.org/10.1504/IJISE.2020.110931
[28] Baba, C.A.K., Hack, J. (2019). Economic valuation of ecosystem services for the sustainable management of agropastoral dams. A case study of the Sakabansi dam, northern Benin. Ecological Indicators, 107: 105648. https://doi.org/10.1016/j.ecolind.2019.105648
[29] Blanco, C.C., Caro, F., Corbett, C.J. (2020). Do carbon abatement opportunities become less profitable over time? A global firm-level perspective using CDP data. Energy Policy, 138: 111252. https://doi.org/10.1016/j.enpol.2020.111252
[30] Littlefair, M., Scheele, B.C., Westgate, M., Lindenmayer, D. (2024). The ecological and biodiversity conservation values of farm dams: A systematic review. PLOS One, 19(5): e0303504. http://doi.org/10.1371/journal.pone.0303504
[31] Simamora, T., Rofiq, M.N., Hutahaean, L., Sio, S., Hutapea, R., Irawan, D., Suryani, Diastuti, R., Thiyas, U.N., Correia, B.A., Correia, L.T. (2024). Sustainability index for eco-friendly cattle farming in dry climate regions. Global Journal of Environmental Science & Management (GJESM), 10(SI): 279-30. https://doi.org/10.22034/GJESM.2024.SI.18
[32] Hui, Z., Li, H., Elamer, A.A. (2024). Financing sustainability: How environmental disclosures shape bank lending decisions in emerging markets. Corporate Social Responsibility and Environmental Management, 31(5): 3940-3967. https://doi.org/10.1002/csr.2789
[33] Chin, W.W. (2010). How to write up and report PLS analyses. In: Esposito Vinzi, V., Chin, W., Henseler, J., Wang, H. (eds) Handbook of Partial Least Squares. Springer Handbooks of Computational Statistics. Springer, Berlin, Heidelberg. https://doi.org/10.1007/978-3-540-32827-8_29
[34] Hair, J.F., Sarstedt, M., Ringle, C.M. (2019). Rethinking some of the rethinking of partial least squares. European Journal of Marketing, 53(4): 566-584. https://doi.org/10.1108/EJM-10-2018-0665
[35] Ghazali, P.L., Rohim, R.A.A., Jalil, K.A., Ahmad, W. M.A.W., Ismail, N.H., Razak, R.A., Arifin, J., Zain, E.N.M. (2022). Statistical validation methods for lactobacillus SP growth: A dental application. Journal of Algebraic Statistics, 13(3): 5131-5137. https:doi//publishoa.com
[36] Latan, H., Ramli, N.A. (2013). The results of partial least squares-structural equation modelling analyses (PLS-SEM). SSRN Electronic Journal. http://doi.org/10.2139/ssrn.2364191
[37] Hair Jr, J.F., Matthews, L.M., Matthews, R.L., Sarstedt, M. (2017). PLS-SEM or CB-SEM: Updated guidelines on which method to use. International Journal of Multivariate Data Analysis, 1(2): 107-123. https://doi.org/10.1504/IJMDA.2017.087624
[38] Sharma, P.N., Liengaard, B.D., Hair, J.F., Sarstedt, M., Ringle, C.M. (2022). Predictive model assessment and selection in composite-based modeling using PLS-SEM: extensions and guidelines for using CVPAT. European Journal of Marketing, 57(6): 1662-1677. https://doi.org/10.1108/EJM-08-2020-0636
[39] Plamonia, N., Dewa, R.P., Jayanti, M., Riyadi, A., Rahayu, B., Diyono, Sahwan, F.L., Chandra, H., Sulistiawan, I.N., Sudiana, N., Hidayat, N., Prasetiyadi, Tilottama, R.D., Irawanto, R., Wahyono, S., Suprapto, Juniati, A.T., Prasidha, I.N.T. (2025). Sustainable water distribution design for Indonesia's new capital, Nusantara: Integrating eco-design and economic principles. International Journal of Sustainable Development and Planning, 20(2): 537-554. https://doi.org/10.18280/ijsdp.200207
[40] Kastratović, R. (2019). Impact of foreign direct investment on greenhouse gas emissions in agriculture of developing countries. Australian Journal of Agricultural and Resource Economics, 63(3): 620-642. https://doi.org/10.1111/1467-8489.12309
[41] Genstwa, N., Zmyślona, J. (2023). Greenhouse gas emissions efficiency in Polish agriculture. Agriculture, 14(1): 56. https://doi.org/10.3390/agriculture14010056
[42] Das, S., Mondal, P. (2021). Socio-economic factors affecting agricultural production and income in Bangladesh. Journal of Agricultural Socio-Economics (JASE), 2(2): 56-63. https://doi.org/10.33474/jase.v2i2.10856
[43] Chen, S., Duan, P., Yu, X. (2022). Ecological aspiration and the income of farmers aroused by Grain for Green Project. Frontiers in Ecology and Evolution, 10: 961490. https://doi.org/10.3389/fevo.2022.961490
[44] Czyżewski, A., Michałowska, M. (2022). The impact of agriculture on greenhouse gas emissions in the visegrad group countries after the world economic crisis of 2008. Comparative Study of the Researched Countries. Energies, 15(6): 2268. https://doi.org/10.3390/en15062268
[45] Chamas, Z., Abou Najm, M., Al-Hindi, M., Yassine, A., Khattar, R. (2021). Sustainable resource optimization under water-energy-food-carbon nexus. Journal of Cleaner Production, 278: 123894. https://doi.org/10.1016/j.jclepro.2020.123894
[46] Aarts, N., Drenthen, M. (2020). Socio-ecological interactions and sustainable development—Introduction to a special issue. Sustainability, 12(17): 6967. https://doi.org/10.3390/su12176967