Youmanli Enok Ferdinand Combary*![]() | Bernard Tossou Atchrimi | Marie Anita Temgoua Zemo
| Bernard Tossou Atchrimi | Marie Anita Temgoua Zemo![]()
© 2025 The authors. This article is published by IIETA and is licensed under the CC BY 4.0 license (http://creativecommons.org/licenses/by/4.0/).
OPEN ACCESS
Cities in developing countries are particularly vulnerable to natural resource degradation, as urban development is often unplanned, and even when it is, it does not take biodiversity into account. Yet biodiversity is crucial to the construction and transformation of sustainable cities in Africa. Integrating ecological connectivity into urban planning is an essential tool for conserving and enhancing biodiversity and improving the quality of ecosystem services for city dwellers. This study aimed to assess ecological connectivity using the landscape graph modeling approach to identify priority fragments and dispersal corridors for conservation in the city of Ouagadougou, based on their overall contribution to forest habitat quality and connectivity. The ecological network modeling methodology used was based on the landscape graph approach, using Graphab 3 and QGIS 3.38.2 software. Urban terrestrial mammals, a group of species sensitive to deforestation, were used as data for modelling. The main results reveal significant fragmentation of forest habitats, characterized by isolated habitat patches and a limited number of functional corridors. Local connectivity metrics calculations identified strategic habitats and essential corridors to be preserved. This spatial modeling research highlights the need to integrate conservation strategies into urban planning, particularly through the creation of corridor networks, with an emphasis on nature-based solutions for urban biodiversity.
spatial modeling, ecological connectivity, Graphab, connectivity metric, nature-based solutions
Biodiversity is threatened by habitat loss and fragmentation, which hinder the movement of animals across the landscapes [1]. Thus, protecting and restoring habitat quality and connectivity is essential but also challenging due to uncertainties associated with climate change, land-use changes such as land artificialization [2], and the development of transport networks [3]. In urban areas, forest habitats suffer significant losses and fragmentation due to rampant urbanization [4, 5]. According to Niebuhr et al. [6], the loss and fragmentation of these natural habitats limits the movement and stability of species due to altered environmental conditions and reduced dispersal ranges. Numerous studies, such as those by Toroitich et al. [7], Ayeni et al. [8], and Ren et al. [9], support this analysis, according to which the disappearance of animal and plant species is directly linked to fragmentation. Urban biodiversity can be a pillar of ecological resilience [10] and sustainable development [11]. They also play an important role in climate regulation and in the provision of ecosystem services.
The transformation of urban spaces plays a central role in the preservation of urban biodiversity. Therefore, the process of improving urban sustainability and resilience has received considerable attention. Recent developments in urban strategies have presented nature-based solutions (NbS) as a promising approaches to restore and preserve biodiversity [12, 13]. This is an opportunity for sustainable urban development [14-16]. The integration of ecological networks and landscape connectivity into planning is also crucial issue for the maintenance of this biodiversity.
In this context, ecological network modeling can be an interesting approach for conducting diagnoses, identifying priority areas, and prioritizing actions to implement NbS in cities. This enables us to understand, and explain but also to predict spatial phenomena and processes [17]. To this end, Opdam et al. [18] emphasized that the spatial concept of ecological networks enables biodiversity issues to be better integrated into territorial planning, particularly in highly anthropized areas. This model is supported by Clauzel [19], who explained that spatial modeling enables a schematic representation of processes linked to the movement of species in order to better understand the structure and functioning of ecological networks, as well as the impact of different factors on connectivity. In ecology field, Samways and Pryke [20] considered the ecological network as a coherent and interconnected network of natural and semi-natural environments, including habitat cores, buffer zones, and corridors, which enables the maintenance and restoration of ecological processes so as to conserve biodiversity and promote the sustainable use of natural resources. Ecological connectivity [21] is an indicator of ecological network quality, representing the degree of connection between various natural environments in terms of their landscapes, spatial distribution, and ecological functions [19]. Literature shows that there are multiple network-based modeling such as percolation theory [22, 23], circuit theory [24, 25], and graph theory [26]. However, in this study, we used a graph-theoretical approach for modeling. This study provides the first application of landscape graph modeling to assess and prioritize forest fragments and dispersal corridors in an urban setting, integrating habitat quality and connectivity metrics to guide conservation planning in data-scarce, rapidly urbanizing regions like Ouagadougou.
Graph-based modeling is a mathematical model of representation used in many fields, whose use in landscape ecology was formalized at the beginning of the 21st century by Urban and Keitt [28]. In a study of ecological networks, Clauzel [19] describes this approach as an abstract representation that makes it possible to visualize the overall structure of networks and the intensity of connections between nodes, while providing useful information to aid decision-making on conservation strategies. In addition, graph theory is distinguished by its flexibility of use, as it enables calculations to be carried out at patch or landscape level with a minimum of information [29]. To this end, there are various tools for using the graph-theoretical approach, such as Conefor [30] or Graphab [27]. While Conefor is better suited to connectivity metric calculations, Graphab offers an integrated environment for all modeling steps, from processing, to importing a landscape map, to calculating and mapping connectivity metrics. This is why it was used in this ecological modeling study. Developed within the ThéMA laboratory (Université de Franche-Comté-CNRS), Graphab is subject to ongoing development to integrate specific features and correct limitations and thus improve its performance. The current version is Graphab 3.0 (2024). It is integrated into the R software environment with the graph4lg package [31] and has developed a QGIS plugin [32]. A literature review of studies that have used Graphab software in ecological modeling based on landscape graphs has been listed and summarized according to fields, themes and study objectives (Table 1).
Table 1. Graphab's use in graph-theoretic modeling according to existing scientific literature according to Foltête et al. [27]
|
Study Fields & Aimed |
Focus Topic |
|
Ecological studies |
Effect of landscape connectivity on biological responses:
|
|
Biodiversity preservation |
|
|
Biological conservation |
|
|
Ecological compensation/ mitigation |
|
|
Urban planning |
|
Although the use of Graphab has been the subject of numerous ecological modeling studies, it is easy to see that its use is much more concentrated in geographical contexts in Europe, Asia, and North and South America. Few modeling studies have been applied to landscape and urban planning in the African context, where the challenges of climate and biodiversity loss are persistent. Moreover, the continent's urbanization is characterized by strong anthropic pressure and uncontrolled spatial planning, which is sometimes limited in terms of urban ecology and biodiversity. In this context, ecological modelling could serve as a strategic tool for this study.
3.1 Study area
The study area was the city of Ouagadougou, the capital city of Burkina Faso. It is located in the central region of the country, between 12° 21′ 58″ north latitude and 1° 31′ 05″ west longitude. Ouagadougou is characterized by significant demographic and spatial dynamics, reflected in habitat fragmentation, a lack of ecological corridors, land pressure and a lack of green infrastructure. Over the past 15 years, its population has doubled from 1.5 to almost 3 million [33]. Twenty-seven percent of the urban expansion took place in informal settlements. The study area is in the Sahelian climatic zone, which is characterized by long dry periods and short rainy periods [34]. The city of Ouagadougou is vulnerable to the impacts of climate change, particularly flooding and heatwaves. These phenomena exacerbate the challenges associated with the degradation of urban ecosystems and loss of biodiversity.
3.2 Data acquisition and landscape mapping
Open-source Landsat 9 OLI-TIRS spatial resolution (30x30m) imagery data acquired from the USGS Earth Explorer site (https://earthexplorer.usgs.gov/), were used to build the land cover. This is a preliminary step and a fundamental basis for modeling. An unsupervised classification was performed using the Semi-Automatic Classification Plugin (SCP) in QGIS to classify the land cover. The evaluation of the accuracy of remote sensing image classification yielded an overall accuracy of 82.74% for all images [35] (Figure 1).
Figure 1. Study area and land cover mapping
The classification of the land cover map included a highly anthropized zone (built-up areas), and an area of urban forests, shrublands, grasslands, water bodies and bare soil. A highly anthropized zone represents a dense concentration of buildings, roads, and human infrastructure or, more generally, artificialized land where urban activities have fragmented the landscape. Forests are areas of dense woodland that are favorable for certain plants and animal species. Shrubs on forest edges or in semi-natural habitats, take the form of dense bushes. Meadows are large expanses of grass often used for grazing or cultivation. Water bodies included rivers and dams. Bare soil refers to an area devoid of vegetation that directly exposes the land surface to erosion and environmental degradation, in the absence of plant protection. The choice of land cover categorization is based on urban terrestrial mammals, the species group chosen for the study because of to their sensitivity to deforestation, but also as an indicator of ecological connectivity, green infrastructure quality, and habitat diversity [36]. However, although the presence of certain terrestrial mammals (rats and house mice) in urban environments can be indicative of negative signs of uncontrolled urbanization, in the sense that their proliferation can signal poor waste management and the absence of natural predators [37, 38], we assume that their presence is a positive sign for urban biodiversity [39]. This method defined a dispersal distance of 100–500 m. According to Feng and Himsworth [40], urban terrestrial mammals, such as rats, exhibit restricted home ranges in urban environments, typically ranging from 100 to 500 meters around food resources. This group of species considers the various elements that are favorable (e.g., urban forests and shrubs) and moderately favorable (e.g., meadows) to their movements, as well as those that are unfavorable (e.g., buildings, bare ground, and water). Habitat loss due to urbanization and deforestation, fragmentation of green spaces, pollution, and pesticides are the main factors that threaten species in urban environments.
The construction of a land-use map is crucial for the creation of a landscape graph [41]. Each classification on the land-use map was associated with a displacement resistance value reflecting the difficulty of crossing the environment for the species in question. An environment that is difficult (unfavorable) for urban terrestrial mammals to cross is assigned a high cost (e.g. bar soil 500), while an environment that is easy (favorable) to cross is assigned a low cost (e.g. shrubland 10). These values were based on a biological knowledge of urban terrestrial mammals, as outlined in the description of each land-use classification in Table 2. The graph-theoretic modelling approach also emphasizes that precise value selection is less important than the hierarchical ranking of land-use classification in relation to each other, considering their permeability. This explains our approach to using a geometric scale (1; 10; 100; 500), which clearly differentiates between environments that are easy and difficult to cross for species, as most studies tend to do [30].
Table 2. Environments with defined study costs by target species group (urban terrestrial mammals)
|
Land Use |
Description |
Area (ha) |
% Area |
Cost |
Type |
|
Urban Forest |
An optimal environment with dense plant cover, numerous perches and a high availability of insects. |
5,870 |
11.01 |
1 |
Optimum habitat |
|
Shrubland |
Forest edges or in semi-natural habitats, took the form of dense bushes. They are a good habitat for dispersal, as they provide refuges, perches and ecological corridors for movement. |
7,978 |
14.97 |
10 |
Favorable |
|
Grassland |
...Few vertical structures for climbing, but they can serve as a transition zone if they are close to shrubs or urban forests. |
7,194 |
13.50 |
100 |
Neutral |
|
Water body |
Unsuitable for dispersal, as the species group does not swim and avoids excessively humid areas. |
709 |
1.33 |
500 |
Unfavorable |
|
Bare soil |
an area devoid of vegetation, directly exposing the land surface. Few resources (shelters, prey, humidity) and high exposure to predators. |
7,658 |
14.37 |
500 |
Unfavorable |
|
Built-up |
Unfavorable due to lack of vegetation, pollution and physical barriers. |
23,894 |
44.83 |
500 |
Unfavorable |
3.3 Ecological habitat network modeling
3.3.1 Modeling steps
The patches were first defined based on a landscape map imported into Graphab; the patches were first defined. These nodes represent polygons of the urban forest habitat category, with a minimum surface area of 0.5 hectares. Next, links were defined according to knowledge of the ecology of the chosen taxon (Table 2). The lowest cost represents the environment most favorable to the taxon's movements, whereas the highest cost represents the environment that is most difficult to cross. The next step involved creating a set of links from which a landscape graph was created.
3.3.2 Landscape connectivity analysis
Habitat connectivity describes the properties of patches connected to neighboring patches. The calculation of connectivity metrics is a quantitative analysis that can be used to prioritize habitat patches and corridors. These metrics can be calculated on several scales. These are global metrics (metrics characterizing the entire graph), component metrics (internal connectivity of each component or sub-graph), and local metrics (connectivity of each graph element, node, or link). Local metrics were selected for this study. The importance of the latter was used to assess the structure and position of the reservoir within a network. Local metrics characterize connectivity at the level of each graph element (node and/or link). Their interest lies in being able to compare the level of connectivity of these elements to identify the most important habitat patches and/or corridors to preserve, that is, those with the highest connectivity values [19]. Here, the Interaction Flux (IF) and Betweenness Centrality Index (BC) are the local metrics chosen for ecological connectivity analysis. These metrics were weighed based on the patch quality and distance between patches. The local connectivity metrics were calculated using the following formula:
Eq. (1) shows the Interaction Flux (IF), which refers to the sum of the products of the focal spot's capacity with all other nodes weighted by their probability of interaction [42].
$I F_i=\sum_{j=1}^n a_i^\beta a_j^\beta e^{-\alpha d i j}$ (1)
Eq. (2) shows the Betweenness Centrality index (BC), which denotes the sum of the shortest paths through focal node i, each path weighted by the product of the capacities of the connected patches and their probability of interaction. Table 3 summarizes all parameter values used in the formulas.
$B C_i=\sum_i \sum_j a_i^\beta a_j^\beta e^{-\alpha d i j}$ (2)
3.3.3 Application to habitat patches creation
The creation of habitat patches helps to identify the most interesting sectors that connect the networks together and increase ecological connectivity. The method used by Foltête et al. [42] calculated a global metric to quantify the initial connectivity of the entire network and then assessed the potential contribution. Based on the landscape graph, the Probability of Connectivity (PC) was calculated [43] to identify the best locations for creation of five new habitat patches. Next, a grid with a cell size of 2,000 m was imposed over the study area was parameterized and the Graphab software algorithm finally tested each grid cell and identified the best locations for generating the maximum gain in connectivity. Eq. (3) shows the PC formula.
$P C=\frac{1}{A^2} \sum_{i=1}^n \sum_{j=1}^n a_i a_j e^{-\alpha d i j}$ (3)
Table 3. Summary of parameter values used in formulas
|
Mathematical Terms Used |
References |
|
A: Study area surface |
[44, 45] |
|
$\beta$: Exponent allowing capacity to be weighted more or less |
|
|
n: Number of nodes |
|
|
ai: Capacity of nodes i (usually its surface area) |
|
|
i and j: nodes |
|
|
dij: distance between nodes i and j |
|
|
$e^{-\alpha d_{i j}}$: Probability of movement between nodes |
Figure 2 summarizes the methodological approach used to conduct this study.
Figure 2. Methodology workflow
4.1 Diagnosis of the ecological habitat network
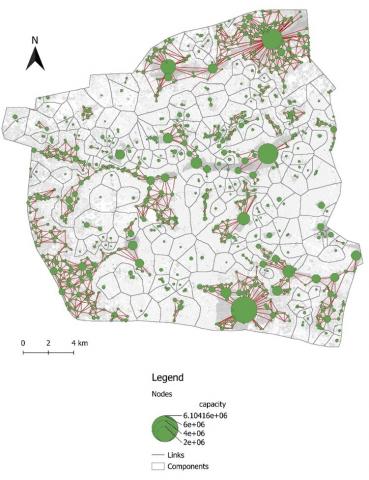
The cartographic representation of the results obtained from modeling in the city of Ouagadougou using the landscape graph approach shows the fragility of the network throughout the territory. This highlights areas where connectivity between habitats is at stake and the need to restore or preserve biodiversity in an urban environment. The graph represents the forest ecological network, whose habitat patches are at least 5000 m² in size and can move over a cumulative distance of 500 costs (Figure 3). Figure 4 shows the results of the representation of the nodes, links, and components of the graph. Analysis of this model revealed that habitats with high capacity, that is, biodiversity potential, are located in the south, north, and natural urban park. According to the landscape graph obtained, 999 nodes ranging from 0.54 to 610.42 hectares were identified. The diagnosis also identified 1,733 links and 178 components. In addition, there were several unconnected nodes in the study area. This is a non-connected graph. Furthermore, the graph shows a limited and unevenly distributed connectivity within the study area. Table 4 shows key statistics for diagnosing the ecological habitat network.
Figure 3. Landscape graph showing the forest ecological network in Ouagadougou
Figure 4. Landscape graph and habitat patches connected by links with the different components in Ouagadougou
Table 4. Key statistics for diagnosing the ecological habitat network
|
Key Elements |
Number |
|
Nodes |
999 |
|
Links |
1,733 |
|
Components |
178 |
4.2 Local connectivity metrics
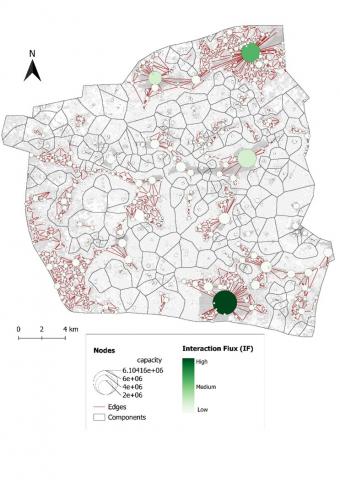
Local metrics were calculated to characterize connectivity at the level of each graph element (node and/or link). In this study, metrics were calculated to compare the level of connectivity and to identify the most important habitat zones (the highest connectivity values to be preserved). For the local Interaction Flux (IF) metric, the results obtained show large, highly connected patches that can host a large population of individuals. This is at the heart of the network. The graphical representation was organized into three classes of importance (low, medium, and high). In Figure 5, dark green (high) habitat patches have the highest interaction flux values and correspond to habitat patches that are of good quality, large in area, and connected to numerous other habitat patches that are of good quality. Small patches in light green had the lowest interaction flux values.
Figure 5. Interaction Flux (IF) metric
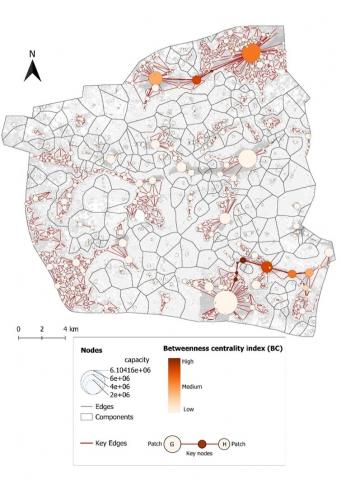
Figure 6. Betweenness Centrality index metric
The Betweenness Centrality index (BC) measures the number of routes passing through a given link or node, and highlights both key nodes and links that are considered obligatory passages. The results of calculating the Betweenness Centrality index (BC) also show a graphical representation of three classes of importance: weak, medium, and strong (Figure 6). The results also show that the corridors located in the northern and southern parts of the study area play a much more important role in the structure and functioning of the ecological network than in other areas of the city of Ouagadougou. Key links and nodes connect large, high-quality habitats to the north and south of the study area.
4.3 Priority areas for habitat creation
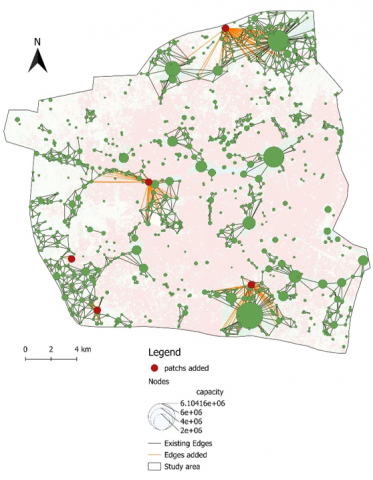
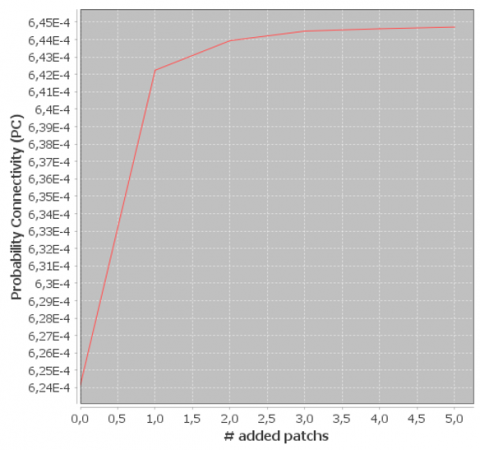
The algorithm used a grid-based systematic approach to test potential habitat patches across the study area, dividing the landscape into uniform cells where each represented a candidate patch location (Figure 7), For each cell, the algorithm simulated patch addition and computed its impact on overall landscape connectivity. After evaluating all candidate cells, it selected the location that provided the maximum connectivity gain, ensuring an optimized network structure. The simulation results showed the locations of the five habitat patches created in the order of importance (Figure 8). The first location selected by the model generated the most connectivity, increasing the overall connectivity from 6.24E-4 to 6.42E-4 (Figure 9). It was located south of the study area. The second-best location also connects the sub-network of the off-center west-south zone. The third location, in the center of the study area, reconnects with small networks and creates the most favorable short paths. The fourth location was in the same zone as the second one. The fifth-best location was located to the north and generated an increase in connectivity because it enabled habitats to be connected to each other with more flows and lower-cost paths.
The connectivity gain curve showed a rapid increase in connectivity when new habitat patches were added and then stabilized after a certain number of patches. The results also showed that after the addition of approximately three patches, the probability of connectivity (PC) appeared to reach a threshold and no longer increased significantly (Figure 9).
Figure 7. Set of test points for habitat creation with associated connectivity gain
Figure 8. Identifying and the five added patches
Figure 9. Increase curve for the selected metric associated with added patches
Connectivity analysis based on landscape graphs in Ouagadougou revealed significant fragmentation of forest habitats, characterized by isolated habitat patches and a limited number of functional corridors. This finding is in line with studies on the degradation of ecological networks in urban environments [46, 47]. The most important habitats, located to the south and north of the city and in the natural urban park, are essential biodiversity hubs. According to the metric approach to connectivity, these areas play a crucial role in maintaining species dispersal and local ecological stabilization [48, 49]. Fragmentation of the ecological network indicates an urgent need for restoration and creation of green corridors to improve connectivity. These findings are consistent with those of studies conducted in similar urban contexts such as Accra and Lagos, where rapid urban expansion reduced the connectivity of green spaces [50].
Regarding the analysis of connectivity metrics, the application of centrality and interaction flow indices enabled the identification of strategic habitats and essential corridors. The Betweenness Centrality index (BC) highlighted critical links that serve as obligatory passages for species dispersal, in line with Minor and Urban's [51] observations on fragmented ecological networks.
Regarding the probability of connectivity, the small increase (PC: 6.24E-4 to 6.42E-4) may have limited ecological significance given the low baseline values, though it could facilitate movement for highly mobile species in fragmented landscapes. Statistical significance does not necessarily imply functional connectivity, as species-specific responses and landscape context mediate actual impacts [52].
In terms of methodological relevance, the landscape graph approach offers several advantages for assessing the ecological connectivity in urban environments. This enables the quantification of spatial fragmentation and priority corridors to be identified at a lower cost, unlike movement resistance models, which require precise behavioral data on target species [53].
However, this approach has certain limitations, notably the simplification of complex ecological interactions and lack of empirical validation of the modeled corridors. The integration of individual simulation methods [52] strengthened the robustness of the results. Another limitation of the present study must be considered. These include the spatial resolution of the data (30m spatial resolution), which can influence habitat and corridor detection. In addition, using multi-year land cover data could improve the model by tracking temporal changes, identifying trends, and highlighting disturbances to connectivity [54]. Classification biases, such as spectral overlap between urban forests and shrubs, may require very high-resolution images (e.g. 1 pixel = 1 m²) to be addressed.
Furthermore, the lack of empirical validation for the identified corridors constitutes a significant methodological bias. Ecological monitoring and GPS analyses of target species can be used to assess the effectiveness of modeled corridors [55].
Finally, a multiscale approach combining graph modeling and individual simulations offers a more accurate view of connectivity dynamics in Ouagadougou.
Nevertheless, the trends observed in Ouagadougou mirror those identified in other African cities where rapid urban growth threatens ecological connectivity. For example, in large cities such as Nairobi in Kenya and Ibanda in Nigeria, as well as in smaller cities such as Gaborone and Windhoek, the respective capitals of Botswana and Namibia, Güneralp et al. [56] highlighted a drastic reduction in ecological corridors because of the impact of urbanization on biodiversity. These findings highlight the need to integrate conservation strategies into urban planning, notably by creating corridor networks and protecting existing biodiversity cores [57].
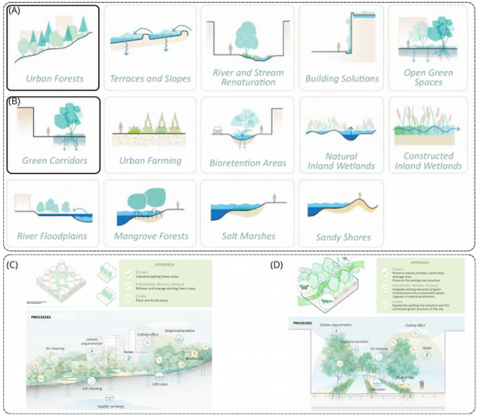
Nature-based solutions are an effective approach to restoring ecological connectivity in highly urbanized areas of Ouagadougou [12, 13, 58]. These solutions include establishing ecological corridors in the form of green and blue grids, greening urban infrastructure (green roofs and walls), and restoring degraded natural spaces [59, 60]. Applying these strategies improves the ecological permeability of the city while providing essential ecosystem services such as thermal regulation and pollutant filtration [14, 61-63]. Figure 10 shows the potential intervention areas and different categories suitable solutions depending on the level of urbanization. It highlights the most appropriate strategies for reconnecting habitats in high-density areas, including the development of micro-corridors (such as hedgerows or urban wildlife crossings) and the promotion of spontaneous vegetation in interstitial spaces. These targeted interventions, inspired by nature-based solutions (NbS), enable ecological continuities to be restored locally in fragmented landscapes. Larger-scale solutions, such as urban forest restoration and river renaturation, are more appropriate in the peri-urban areas of Ouagadougou where they recreate functional ecological networks.
Figure 10. Example of interventions to integrate nature-based solutions to strengthen connectivity in Ouagadougou: (A) and (B) represent NbS family (urban forests & green corridors) respectively; (C) and (D) are graphic representations
Source: World Bank, 2021
This study highlights the importance of a landscape graph approach for analyzing ecological connectivity in urban environments. The results revealed significant habitat fragmentation in Ouagadougou and identified key areas that require restoration and preservation to enhance connectivity.
The increase of PC represents a 2.89% improvement in connectivity. Integrating the identified corridors into urban planning and green space management is crucial for improving a city's ecological resilience. It is recommended that planners assign priority to the restoration of key habitat corridors in areas that are fragmented, such as by the expansion of green spaces along waterways. It is also imperative that municipal authorities of Ouagadougou incorporate connectivity metrics, such as PC, into urban tools to facilitate sustainable development and enhance biodiversity. Future research should validate the model results with field data on species movement, using GPS tracking. It would also be appropriate to test hybrid modeling approaches that combine circuit theory with path analysis at lower cost for greater accuracy. The application of these methods to other West African cities would expand our knowledge of the ecological connectivity dynamics in urban environments.
This work was supported by the World Bank through the Regional Center of Excellence on Sustainable Cities in Africa (CERViDA-DOUNEDON), (Grant number: IDA 5360 TG).
[1] Rayfield, B., Larocque, G., Lucet, V. (2021). Modélisation de la connectivité de l'habitat terrestre dans les basses-terres du Saint-Laurent selon différents scénarios de changements climatiques et d'occupation des sols. https://www.environnement.gouv.qc.ca/biodiversite/cadre-ecologique/modelisation-connectivite-basses-terres-saint-laurent.pdf.
[2] Madadi, H., Moradi, H., Soffianian, A., Salmanmahiny, A., Senn, J., Geneletti, D. (2017). Degradation of natural habitats by roads: Comparing land-take and noise effect zone. Environmental Impact Assessment Review, 65: 147-155. https://doi.org/10.1016/j.eiar.2017.05.003
[3] Tarabon, S., Godet, C., Coskun, T., Clauzel, C. (2022). Coupling spatial modeling with expert opinion approaches to restore multispecies connectivity of major transportation infrastructure. Landscape and Urban Planning, 221: 104371. https://doi.org/10.1016/j.landurbplan.2022.104371
[4] Chettry, V. (2023). A critical review of urban sprawl studies. Journal of Geovisualization and Spatial Analysis, 7(2): 28. https://doi.org/10.1007/s41651-023-00158-w
[5] Shao, Z., Sumari, N.S., Portnov, A., Ujoh, F., Musakwa, W., Mandela, P.J. (2020). Urban sprawl and its impact on sustainable urban development: A combination of remote sensing and social media data. Geo-spatial Information Science, 24(2): 241-255. https://doi.org/10.1080/10095020.2020.1787800
[6] Niebuhr, B.B.S., Wosniack, M.E., Santos, M.C., Raposo, E.P., Viswanathan, G.M., da Luz, M.G.E., Pie, M.R. (2015). Survival in patchy landscapes: The interplay between dispersal, habitat loss and fragmentation. Scientific Reports, 5(1): 11898. https://doi.org/10.1038/srep11898
[7] Toroitich, C., Njuguna, M., Karanja, D. (2022). Effects of urban wetland patch pattern on the biodiversity of aquatic birds in Nairobi, Kenya. Journal of Agriculture, Science and Technology, 21(1): 83-109. https://doi.org/10.4314/jagst.v21i1.8
[8] Ayeni, A.O., Aborisade, A.G., Onuminya, T.O., Soneye, A.S.O., Ogundipe, O.T. (2023). Urban development in Africa and impact on biodiversity. Current Landscape Ecology Reports, 8(2): 73-89. https://doi.org/10.1007/s40823-023-00086-x
[9] Ren, Q., He, C., Huang, Q., Zhang, D., Shi, P., Lu, W. (2023). Impacts of global urban expansion on natural habitats undermine the 2050 vision for biodiversity. Resources, Conservation and Recycling, 190: 106834. https://doi.org/10.1016/j.resconrec.2022.106834
[10] Wu, J., Wu, T. (2012). Ecological resilience as a foundation for urban design and sustainability. In Future City. Springer Netherlands, pp. 211-229. https://doi.org/10.1007/978-94-007-5341-9_10
[11] Cepeliauskaite, G., Stasiskiene, Z. (2020). The framework of the principles of sustainable urban ecosystems development and functioning. Sustainability, 12(2): 720. https://doi.org/10.3390/su12020720
[12] Clement, S. (2021). Nature-based solutions for urban biodiversity. In Nature-Based Solutions for More Sustainable Cities - A Framework Approach for Planning and Evaluation. Emerald Publishing Limited, pp. 33-45. https://doi.org/10.1108/978-1-80043-636-720211004
[13] Croeser, T., Bekessy, S.A., Garrard, G.E., Kirk, H. (2024). Nature-based solutions for urban biodiversity: Spatial targeting of retrofits can multiply ecological connectivity benefits. Landscape and Urban Planning, 251: 105169. https://doi.org/10.1016/j.landurbplan.2024.105169
[14] Tan, B.A., Gaw, L.Y.F., Masoudi, M., Richards, D.R. (2021). Nature-based solutions for urban sustainability: An ecosystem services assessment of plans for Singapore's first "forest town". Frontiers in Environmental Science, 9: 610155. https://doi.org/10.3389/fenvs.2021.610155
[15] McPhearson, T., Kabisch, N., Frantzeskaki, N. (2023). Nature-Based Solutions for Cities. Edward Elgar Publishing.
[16] Lemes de Oliveira, F. (2025). Nature in nature-based solutions in urban planning. Landscape and Urban Planning, 256: 105282. https://doi.org/10.1016/j.landurbplan.2024.105282
[17] Varenne, F. (2020). Modèle et modélisation. In Dictionnaire Critique de l'Anthropocène, pp. 556-559. https://hal.science/hal-02159152
[18] Opdam, P., Steingröver, E., van Rooij, S. (2006). Ecological networks: A spatial concept for multi-actor planning of sustainable landscapes. Landscape and Urban Planning, 75(3-4): 322-332. https://doi.org/10.1016/j.landurbplan.2005.02.015
[19] Clauzel, C. (2021). Réseaux écologiques et connectivité du paysage. Université Paris 1 - Panthéon Sorbonne. https://hal.science/tel-03480647/file/Volume1_HDR_Clauzel.pdf.
[20] Samways, M.J., Pryke, J.S. (2015). Large-scale ecological networks do work in an ecologically complex biodiversity hotspot. Ambio, 45(2): 161-172. https://doi.org/10.1007/s13280-015-0697-x
[21] Kirk, H., Soanes, K., Amati, M., Bekessy, S., Harrison, L., Parris, K., Ramalho, C., van de Ree, R., Threlfall, C. (2023). Ecological connectivity as a planning tool for the conservation of wildlife in cities. MethodsX, 10: 101989. https://doi.org/10.1016/j.mex.2022.101989
[22] Li, B.L. (2002). A theoretical framework of ecological phase transitions for characterizing tree-grass dynamics. Acta Biotheoretica, 50(3): 141-154. https://doi.org/10.1023/a:1016562208170
[23] Evans, J.S., Murphy, M.A., Holden, Z.A., Cushman, S.A. (2010). Modeling species distribution and change using random forest. In Predictive species and habitat modeling in landscape ecology. Springer New York, pp. 139-159. https://doi.org/10.1007/978-1-4419-7390-0_8
[24] Hanks, E.M., Hooten, M.B. (2013). Circuit theory and model-based inference for landscape connectivity. Journal of the American Statistical Association, 108(501): 22-33. https://doi.org/10.1080/01621459.2012.724647
[25] Song, L.L., Qin, M.Z. (2016). Identification of ecological corridors and its importance by integrating circuit theory. Chinese Journal of Applied Ecology, 27(10): 3344-3352. https://doi.org/10.13287/j.1001-9332.201610.035
[26] Préau, C., Grandjean, F., Sellier, Y., Gailledrat, M., Bertrand, R., Isselin-Nondedeu, F. (2020). Habitat patches for newts in the face of climate change: Local scale assessment combining niche modelling and graph theory. Scientific Reports, 10(1): 3570. https://doi.org/10.1038/s41598-020-60479-4
[27] Foltête, J.C., Vuidel, G., Savary, P., Clauzel, C., Sahraoui, Y., Girardet, X., Bourgeois, M. (2021). Graphab: An application for modeling and managing ecological habitat networks. Software Impacts, 8: 100065. https://doi.org/10.1016/j.simpa.2021.100065
[28] Urban, D., Keitt, T. (2001). Landscape connectivity: A graph-theoretic perspective. Ecology, 82(5): 1205-1218. https://doi.org/10.1890/0012-9658(2001)082[1205:LCAGTP]2.0.CO;2
[29] Correa Ayram, C.A., Mendoza, M.E., Etter, A., Salicrup, D.R.P. (2015). Habitat connectivity in biodiversity conservation. Progress in Physical Geography: Earth and Environment, 40(1): 7-37. https://doi.org/10.1177/0309133315598713
[30] Saura, S., Torné, J. (2009). Conefor Sensinode 2.2: A software package for quantifying the importance of habitat patches for landscape connectivity. Environmental Modelling & Software, 24(1): 135-139. https://doi.org/10.1016/j.envsoft.2008.05.005
[31] Savary, P., Foltête, J.C., Moal, H., Vuidel, G., Garnier, S. (2020). Graph4lg: A package for constructing and analysing graphs for landscape genetics in R. Methods in Ecology and Evolution, 12(3): 539-547. https://doi.org/10.1111/2041-210x.13530
[32] QGIS Development Team. (2025). Spatial without compromise: QGIS web site. https://www.qgis.org/.
[33] Centre d'Excellence sur l'Habitat. (2024). Rapport pays sur le logement et le development urbain au Burkina Faso. https://www.ceh-uemoa.org/wp-content/uploads/2025/01/2-1_Rapport-Pays_BURKINA-FASO.pdf.
[34] Basson, F., Zougmoré, F., Somda, J., Dipama, J.M., Wendpagnangdé Ilboudo, H. (2020). Analyse du plan national d'adaptation aux changements climatiques (PNA) du Burkina Faso et de sa capacité à atteindre ses objectifs. European Scientific Journal, 16(27): 149. https://doi.org/10.19044/esj.2020.v16n27p149
[35] Combary, Y.E.F., Zemo, M.A.T., Hemchi, H.M., Atchrimi, B.T. (2024). Monitoring and assessing of sustainable development in the urban area of Ouagadougou based on SDG 11.3.1 indicator and the city biodiversity index. Edelweiss Applied Science and Technology, 8(6): 1930-1943. https://doi.org/10.55214/25768484.v8i6.2363
[36] Gallo, T., Fidino, M., Lehrer, E.W., Magle, S.B. (2017). Mammal diversity and metacommunity dynamics in urban green spaces: Implications for urban wildlife conservation. Ecological Applications, 27(8): 2330-2341. https://doi.org/10.1002/eap.1611
[37] Akpatou, K.B., Bohoussou, K.H., Kadjo, B. (2018). Diversité et abondance des Rongeurs et Soricomorphes dans différents standings de la commune de Yopougon, Côte d'Ivoire. Journal of Animal and Plant Sciences, 37(1): 5942-5955.
[38] Bohoussou, K.H., Brou, N.A.M.J., Bogui, E.B., Akpatou, B.K., N'Goran, K.E., Acapovi-Yao, G.L. (2022). Biodiversité urbaine: micromammifères terrestres de la commune de Man, Ouest de la Côte d'Ivoire. International Journal of Biological and Chemical Sciences, 16(2): 641-652. https://doi.org/10.4314/ijbcs.v16i2.11
[39] Dondina, O., Tirozzi, P., Viviano, A., Mori, E., Orioli, V., Tommasi, N., Tanzi, A., Bazzoli, L., Caprio, E., Patetta, C., Pastore, M.C., Bani, L., Ancillotto, L. (2025). Spatial and habitat determinants of small-mammal biodiversity in urban green areas: Lessons for nature-based solutions. Urban Forestry & Urban Greening, 104: 128641. https://doi.org/10.1016/j.ufug.2024.128641
[40] Feng, A.Y.T., Himsworth, C.G. (2013). The secret life of the city rat: A review of the ecology of urban Norway and black rats (Rattus norvegicus and Rattus rattus). Urban Ecosystems, 17(1): 149-162. https://doi.org/10.1007/s11252-013-0305-4
[41] Tarabon, S., Calvet, C., Delbar, V., Dutoit, T., Isselin-Nondedeu, F. (2020). Integrating a landscape connectivity approach into mitigation hierarchy planning by anticipating urban dynamics. Landscape and Urban Planning, 202: 103871. https://doi.org/10.1016/j.landurbplan.2020.103871
[42] Foltête, J.C., Girardet, X., Clauzel, C. (2014). A methodological framework for the use of landscape graphs in land-use planning. Landscape and Urban Planning, 124: 140-150. https://doi.org/10.1016/j.landurbplan.2013.12.012
[43] Pascual-Hortal, L., Saura, S. (2007). Impact of spatial scale on the identification of critical habitat patches for the maintenance of landscape connectivity. Landscape and Urban Planning, 83(2-3): 176-186. https://doi.org/10.1016/j.landurbplan.2007.04.003
[44] Bodin, Ö., Saura, S. (2010). Ranking individual habitat patches as connectivity providers: Integrating network analysis and patch removal experiments. Ecological Modelling, 221(19): 2393-2405. https://doi.org/10.1016/j.ecolmodel.2010.06.017
[45] Foltête, J.C., Clauzel, C., Girardet, X., Tournant, P., Vuidel, G. (2012). La modélisation des réseaux écologiques par les graphes paysagers. Méthodes et outils. Revue Internationale de géOmatique, 22(4): 641-658. https://doi.org/10.3166/rig.22.641-658
[46] McRae, B.H., Dickson, B.G., Keitt, T.H., Shah, V.B. (2008). Using circuit theory to model connectivity in ecology, evolution, and conservation. Ecology, 89(10): 2712-2724. https://doi.org/10.1890/07-1861.1
[47] Saura, S., Rubio, L. (2010). A common currency for the different ways in which patches and links can contribute to habitat availability and connectivity in the landscape. Ecography, 33(3): 523-537. https://doi.org/10.1111/j.1600-0587.2009.05760.x
[48] Crooks, K.R., Sanjayan, M. (2006). Connectivity Conservation. Cambridge University Press.
[49] Mosquera-Guerra, F., Barreto, S., Moreno-Niño, N., González-Delgado, T.M., Armenteras-Pascual, D. (2024). Habitat connectivity of threatened ungulate species in a native savanna landscape of northern South America. Mammalian Biology, 104(3): 259-275. https://doi.org/10.1007/s42991-024-00404-8
[50] Nilon, C.H., Aronson, M.F.J., Cilliers, S.S., Dobbs, C., Frazee, L.J., Goddard, M.A., O'Neill, K.M., Roberts, D., Stander, E.K., Werner, P., Winter, M., Yocom, K.P. (2017). Planning for the future of urban biodiversity: A global review of city-scale initiatives. BioScience, 67(4): 332-342. https://doi.org/10.1093/biosci/bix012
[51] Minor, E.S., Urban, D.L. (2008). A graph-theory framework for evaluating landscape connectivity and conservation planning. Conservation Biology, 22(2): 297-307. https://doi.org/10.1111/j.1523-1739.2007.00871.x
[52] Zeller, K.A., McGarigal, K., Whiteley, A.R. (2012). Estimating landscape resistance to movement: A review. Landscape Ecology, 27(6): 777-797. https://doi.org/10.1007/s10980-012-9737-0
[53] Rayfield, B., Fortin, M.J., Fall, A. (2011). Connectivity for conservation: A framework to classify network measures. Ecology, 92(4): 847-858. https://doi.org/10.1890/09-2190.1
[54] Zhan, F., Liu, Z., Wang, B. (2023). Study on the spatiotemporal evolution of the "contraction-expansion" change of the boundary area between two green belts in Beijing based on a multi-index system. Land, 12(8): 1621. https://doi.org/10.3390/land12081621
[55] Haddad, N.M., Brudvig, L.A., Clobert, J., Davies, K.F., et al. (2015). Habitat fragmentation and its lasting impact on Earth's ecosystems. Science Advances, 1(2). https://doi.org/10.1126/sciadv.1500052
[56] Güneralp, B., Lwasa, S., Masundire, H., Parnell, S., Seto, K.C. (2017). Urbanization in Africa: Challenges and opportunities for conservation. Environmental Research Letters, 13(1): 015002. https://doi.org/10.1088/1748-9326/aa94fe
[57] Beninde, J., Veith, M., Hochkirch, A. (2015). Biodiversity in cities needs space: A meta-analysis of factors determining intraurban biodiversity variation. Ecology Letters, 18(6): 581-592. https://doi.org/10.1111/ele.12427
[58] Oliver, E., Marsters, L. (2022). Nature-based solutions in sub-Saharan Africa for climate and water resilience: A methodology for evaluating the regional status of investments in nature-based solutions from a scan of multilateral development bank portfolios. World Resources Institute. https://doi.org/10.46830/writn.22.00054
[59] Stanford, B., Ikyanan, K., Grossinger, R., Beller, E., Benjamin, M., Grenier, J. L., Bazo, M., Heller, N., Aronson, M., Felson, A., Groffman, P., Spotswood, E. (2023). Making nature's city. In Urban Biodiversity and Equity. Oxford University Press, pp. 251-266. https://doi.org/10.1093/oso/9780198877271.003.0014
[60] Alves Carvalho Nascimento, L. (2021). Nature-based solutions in environmental planning: Ecosystem-based adaptations, green infrastructures, and ecosystem services to promote diversity in urban landscapes. Dissertations and Theses. Paper 5843. https://doi.org/10.15760/etd.7714
[61] Kabisch, N., Korn, H., Stadler, J., Bonn, A. (2017). Nature-Based Solutions to Climate Change Adaptation in Urban Areas. Springer International Publishing. https://doi.org/10.1007/978-3-319-56091-5
[62] Kabisch, N., Frantzeskaki, N., Hansen, R. (2022). Principles for urban nature-based solutions. Ambio, 51(6): 1388-1401. https://doi.org/10.1007/s13280-021-01685-w
[63] World Bank. (2021). A catalogue of nature-based solutions for urban resilience. World Bank Group. https://www.gfdrr.org/en/publication/catalogue-nature-based-solutions-urban-resilience-0.