Farrukh Nawaz*![]() | Umer Iqbal
| Umer Iqbal![]() | Umar Kayani
| Umar Kayani![]()
© 2025 The authors. This article is published by IIETA and is licensed under the CC BY 4.0 license (http://creativecommons.org/licenses/by/4.0/).
OPEN ACCESS
Economic Policy Uncertainty (EPU) refers to the uncertainty surrounding government policies and their potential impact on the economy. This uncertainty arises from a lack of clarity regarding future policies related to fiscal measures, monetary policies, regulations, trade policies, and political events. Economic policy uncertainty typically leads firms to increase their cash holdings as a way to manage risk and maintain operational flexibility. Using the sample from the Nikkei 225 index listed non-financial firms in Japan, this paper examines the impact of EPU on corporate cash holding from 2003 to 2023 The paper finds a significant positive impact of the EPU on cash holding. Various robustness checks also confirm this baseline finding. This evidence is in line with the theory of liquidity preference provided by John Maynard Keynes.
cash holdings, theory liquidity preference, economic policy uncertainty, EPU shocks, Japanese firms, financial constraints
EPU is widely regarded as a significant risk factor for businesses, encompassing the unpredictability of fiscal, monetary, and regulatory policies that can affect the economic conditions within which firms operate. One commonly used measure of EPU is the Economic Policy Uncertainty Index (EPU Index), developed by Baker et al. [1], which monitors news-driven economic policy uncertainty across more than 20 countries. Changes in economic policies can introduce risks that firms need to manage, and this is especially relevant when it comes to decisions about cash holdings. The index of Economic Policy Uncertainty (EPU) has become a widely researched field since [1] introduced this uncertainty measure. Indeed, the EPU affects the firms' investments [2], asset performance [3] bank credits [4, 5] stock market return [6], and stock market volatility [7]. Following this legacy, this paper investigates the impact of the EPU on the cash holdings of non-financial firms listed in the Nikkei 225 index in Japan. At this stage, there are mixed empirical results for the impact of the EPU on corporate cash holdings in the previous literature [8, 9]. Japanese firms have historically faced significant economic challenges, including deflation, low interest rates, and policy uncertainty associated with fiscal and monetary policies. The long-standing economic stagnation in Japan, combined with frequent changes in government policies, has led many firms to adopt precautionary cash holding strategies. This paper uses Japan's news-based economic policy uncertainty (EPU) index, introduced by Saxegaard et al. [10]. The EPU index includes three factors: i) terms associated with policy uncertainty, ii) changes in tax code, and iii) disagreement of forecaster as a proxy for uncertainty. This paper investigates how EPU affects the corporate cash holdings of Japanese-listed non-financial firms due to their particular characteristics. First, Japan's Exchange Group (JPX) is the world's second-largest capitalised market. An increase in the EPU can lead to changes in corporate cash policies. Second, non-financial firms in Japan are considered among the most productive firms in industrial production. These firms require cash to run their business operation and fulfil global demand. Finally, Japan is an export-oriented country. The EPU can also hurt Japanese firms' revenues if there is a decline in global demand.
Keynes [11] indicated two motivations for cash holdings. First is the lower transaction cost to avoid liquidation of assets. Second is the maintenance of a buffer in a period of crisis. Corporate cash holding has significantly increased since the early 2000s [12]. Therefore, previous studies have explored determinants of corporate cash holdings. They found several factors are the driver of it, business organisation structure [13], tax incentives [14], and corporate governance [15]. However, the impact of business cycles on corporate cash holdings still needs to be examined. We observe that Japanese non-financial firms hold excessive cash when the EPU increases. Building upon [11] foundational liquidity preference theory, recent theoretical advancements emphasize firms’ precautionary liquidity management in response to financing frictions and uncertainty [16, 17]. Such contemporary theoretical insights complement and extend classical views by clarifying specific channels through which uncertainty drives cash accumulation. We address this research gap in the literature by investigating the impact of economic policy uncertainty on corporate cash holdings in a sample of Japanese non-financial firms. Japanese non-financial firms hold significantly higher cash reserves, approximately 13.1% of total assets compared to global and historical industry benchmarks (typically between 5–10% globally [18]), when EPU increases, suggesting cash accumulation beyond normative operational requirements.
This paper extends prior research [1, 19, 20] by explicitly analyzing the impact of Japan-specific EPU shocks derived from Saxegaard et al. [10] recent comprehensive news-based measure, covering an extended time frame (2003–2023). Unlike earlier studies, our analysis employs robust methodological checks including firm-size and market-to-book-based segregation of financially constrained (FC) and non-financially constrained (non-FC) firms, providing more granular insights into the role financial constraints play in the EPU-cash relationship.
The rest of the paper is organised as follows: Section 2 highlights the literature review. Section 3 explains the data and the model. Section 4 discusses the empirical findings and Section 5 concludes.
A number of empirical studies have been conducted to explore the relationship between EPU and corporate cash holdings. Baker et al. [1] examined the effect of EPU on corporate cash holdings using the EPU Index. They found a strong positive relationship between EPU and cash holdings, indicating that firms tend to accumulate more cash during periods of high policy uncertainty. The result was robust across different industries, suggesting that the precautionary motive is a central driver of cash accumulation in uncertain times. In a study by Mizuno and Kato [19], the relationship between EPU and corporate cash holdings in Japan was analyzed using a sample of firms listed on the Tokyo Stock Exchange (TSE). The study found that during periods of high EPU, Japanese firms significantly increased their cash holdings as a way to hedge against the potential risks of policy changes, regulatory shifts, and economic shocks. This finding is consistent with the precautionary motive, where firms prioritize liquidity to ensure financial stability during uncertain times.
Besides the precautionary motive, EPU could influence cash holdings through alternative mechanisms, including managerial risk aversion and signaling theory. High EPU might prompt risk-averse managers to accumulate cash as a defensive measure against potential disruptions in external financing markets [16]. Additionally, firms might hold excess cash to signal financial stability to stakeholders and mitigate concerns related to policy uncertainty-induced volatility [17]. Furthermore, Kato et al. [20] found that Japanese companies in industries highly affected by government policies, such as the automotive and manufacturing sectors, were particularly sensitive to increases in EPU, leading them to accumulate cash reserves. The study suggested that firms in these sectors viewed holding cash as a way to manage risks arising from regulatory uncertainties, such as changes in labor laws or environmental regulations. In another study, Chen et al. [21] focused on the role of cash holdings in China and how they were influenced by economic policy uncertainty. Their study confirmed that higher EPU led to increased cash holdings, especially in firms that were more vulnerable to regulatory and policy changes. The study highlighted that firms in industries subject to stricter regulations, such as finance and infrastructure, were particularly inclined to hold larger cash reserves in response to heightened uncertainty.
Almeida et al. [16] explored the relationship between cash holdings and external financing constraints in the presence of economic policy uncertainty. They found that firms with higher levels of financial constraints tended to increase their cash holdings during times of policy uncertainty. The study concluded that firms use cash as a tool to hedge against the uncertainty in external capital markets during periods of heightened EPU. Duchin et al. [17] examined how policy uncertainty influenced cash holdings during the global financial crisis. Their findings suggested that firms with more significant exposure to government regulations and political risk were more likely to increase cash reserves during times of heightened uncertainty. This was particularly true for firms in regulated industries, where the risk of sudden policy shifts was greater.
Baker et al. [1] examined the relationship between EPU and corporate cash holdings in South Korea. They found that during periods of political and economic uncertainty, firms increased cash holdings to protect themselves from potential negative impacts of policy changes. The study emphasized that firms with more growth opportunities or greater exposure to government regulations were particularly sensitive to EPU. Al-Najjar and Belghitar [22] extended the analysis of cash holdings by examining the impact of EPU on firms’ corporate governance. They found that firms with more concentrated ownership structures or stronger corporate governance mechanisms held more cash during times of uncertainty. The results suggested that managerial discretion and agency problems also play a role in cash holding decisions during periods of heightened policy uncertainty.
We use the data of the non-financial firms listed in the Nikkei 225 index in Japan from 2003 to 2023. We also exclude the extreme values from the top 1% and the bottom 99%. The dependent variable is the cash, and cash equivalents are divided by total assets to quantify the cash holdings ratio [18]. Following Dittmar and Mahrt-Smith [15], the ratio of cash over sales as a proxy of cash holdings is also used in the robustness check. Refer to Table 1 for details. Following Phan et al. [23], firm-level and macro-level control variables are also included. The firm-specific data are downloaded from the Bloomberg database, and macroeconomic data are obtained from the World Bank's World Development Indicators database. The EPU data in Japan is downloaded from Saxegaard et al. [10] and Baker et al. [1] from their website (www.policyuncertainty.com). Additionally, industry dummies (based on Nikkei 225’s industry classification) are included to control for heterogeneity across sectors regarding sensitivity to EPU. These controls ensure robustness in identifying EPU effects independent of industry-specific characteristics.
Our baseline regression model for the impact of the EPU on cash holdings is given as follows:
$\operatorname{Cash}_{\mathrm{i}, \mathrm{t}}=\alpha_0+\beta_1 E \mathrm{PU}_{\mathrm{i}, \mathrm{t}-1}+\beta_2 \mathrm{X}_{\mathrm{i}, \mathrm{t}}+\mathrm{v}_{\mathrm{i}, \mathrm{t}}+\varepsilon_{\mathrm{i}, \mathrm{t}}$ (1)
In Eq. (1), $E \mathrm{PU}_{\mathrm{i}, \mathrm{t}-1}$ is the primary variable of interest and represents the economic policy uncertainty in firm $i$ and time $t-1$. Cash ${ }_{\mathrm{i}, \mathrm{t}}$ is the dependent variable representing the cash holdings in firm $i$ and time $t$. $\mathrm{X}_{\mathrm{i}, \mathrm{t}}$ represents the control variables in firm $i$ and time $t-1 . \mathrm{v}_{\mathrm{i}, \mathrm{t}}$ captures the firm and time fixed-effects and $\varepsilon_{\mathrm{i}, \mathrm{t}}$ is the error term. According to the theory of liquidity preference by Keynes [11], the coefficient captured by $\beta 1$ should be positive and statistically significant.
We utilise [24] two-step System Generalised Methods of Moments (SGMM) approach to address possible endogeneity problems. The pooled regression results and the fixed-effects estimations are neglected since they will be biased and inefficient in the case of endogeneity [25].
We also address the possible reverse causality problem using the lagged EPU by one period, following previous papers [3]. To address instrument validity concerns, we report the Kleibergen-Paap F-statistic for instrument strength. All estimated first-stage F-statistics significantly exceed the recommended threshold of 10, confirming the adequacy and validity of our instruments.
Table 1. Variables description
|
Variable |
Symbol |
Measurement |
|
Dependent Variables Cash Holdings |
Cash $_{i, t}$ |
Cash & Cash Equivalents / Total Assets |
|
Cash Holdings |
Cash/Sales ${ }_{i, t}$ |
Cash & Cash Equivalents / Total Sales |
|
Main Variable of Interest Economic Policy Uncertainty |
$E P U_t$ |
EPU as the proxy of overall policy uncertainty |
|
Control Variables |
|
|
|
Firm Controls Working Capital |
$W C_{i, t}$ |
Current assets-current liabilities over total assets |
|
Cash Conversion Cycle |
$C C C_{i, t}$ |
CCC = DIO + DSO – DPO |
|
Market-to-book Ratio |
$M T B_{i, t}$ |
Market price/Book value in year t. |
|
Size (Size of Firm) |
$S I Z E_{i, t}$ |
Ln of total assets in year t. |
|
Leverage of Firm |
$L E V_{i, t}$ |
Debt over total assets of a company in year t. |
|
Capital Expenditures |
CAPEX $_{i, t}$ |
Capital expenditure/Total assets |
|
Cash Flow from Operations |
$C F O_{i, t}$ |
Cash flow from operations |
|
Research and Development |
$R \& D_{i, t}$ |
R&D expense/Sales |
|
Macroeconomic Controls Interest Rate |
Int $_t$ |
The annual average interest rate in a year t. |
|
nflation Rate |
Infl ${ }_t$ |
Changes in the Consumer Price Index (CPI) For Year t of each country. |
|
Exchange Rate |
$F X R_t$ |
Annual average of the foreign exchange rate of year t concerning US$. |
|
The Rule of Law |
$R U L E_t$ |
The rule of law in a country within year t. |
|
Regulatory Quality |
$R E G_t$ |
Regulatory quality in a country within year t. |
Table 2 documents the descriptive statistics of the variables used in this research, demonstrating that Japanese non-financial firms hold 13.1% cash against total assets on average.
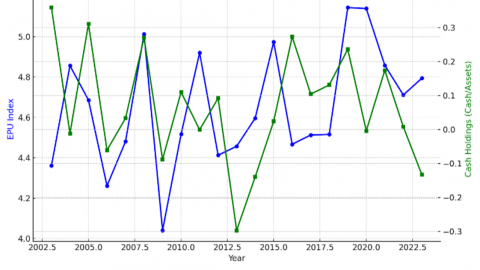
Figure 1 displays the annual trends in Japan’s economic policy uncertainty (EPU) and the average corporate cash holdings ratio (Cash/Assets) over the period 2003 to 2023. The figure visually illustrates the co-movement between EPU and cash holdings, particularly during global and domestic economic shocks (e.g., 2008 global financial crisis, 2011 earthquake, and 2020 COVID-19 pandemic). This pattern supports the hypothesis that firms increase cash reserves in response to heightened policy uncertainty, consistent with the precautionary motive.
Table 3 reports the results of the SGMM baseline regression model for all two proxies of cash holdings. In Columns 1 and 4, only firm controls are used in the regression. In Columns 2 and 5, macroeconomic factors are used. In Columns 3 and 6, we use both firm-specific and macroeconomic variables. We acknowledge borderline p-values of the Hansen J-test. To mitigate instrument proliferation and potential overfitting, we employed a collapsed instrument set following recommendations, substantially reducing the number of instruments and ensuring robust inference.
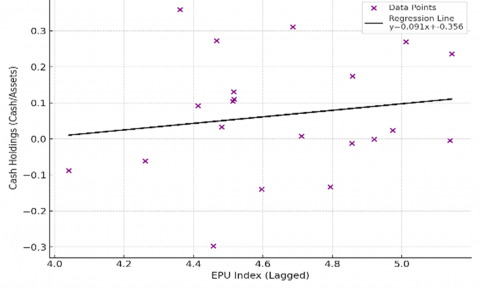
Figure 2 presents a scatterplot of lagged EPU values against average cash holdings (Cash/Assets), with a fitted regression line. The positive slope confirms a statistically and economically meaningful relationship between economic policy uncertainty and corporate liquidity buffers. This graphical evidence complements the regression analysis in Table 3, further validating that Japanese firms hold more cash as a direct response to increased EPU.
The estimated coefficients of the lagged EPU are positive, ranging from 0.010 to 0.029, and they are statistically significant at the 1% level. The results are consistent in both cash holdings proxies. Economically, our estimates imply that a one standard deviation increase in EPU 0.238 corresponds, on average, to a 0.24% to 0.69% increase in cash holdings relative to total assets. Given the average cash holdings ratio of 13.1% among Japanese firms, this impact is economically meaningful, highlighting corporate sensitivity to policy uncertainty.
These baseline results are consistent with Keynes's theory of liquidity preference, which states that firms hold more cash to curb the effect of the EPU. According to Iqbal et al. [3], financially constrained (FC) firms have more volatile investment behaviour since they do not have enough sources to invest in new projects. This issue decreases future cash inflows. Since these firms usually face boundaries to access credits from financial institutions, they tend to hold more cash reserves during times of uncertainty. Given this backdrop, following Phan et al. [23], we consider the firm size and market-to-book ratio measures to segregate sample firms into FC and non-FC firms and re-estimate Eq. (1). The results in Tables 4 and 5 indicate that the EPU still has a positive effect on cash holdings.
Table 2. Descriptive statistics
|
Variable |
Obs. |
Mean |
P25 |
Median |
P75 |
Std.Dev. |
Min |
Max |
|
Cash holdings |
2,763 |
0.131 |
0.052 |
0.089 |
0.160 |
0.153 |
0.006 |
2.571 |
|
Cash/Sales |
2,763 |
0.145 |
0.058 |
0.099 |
0.171 |
0.168 |
0.004 |
1.971 |
|
EPU |
2,932 |
4.619 |
4.536 |
4.594 |
4.845 |
0.238 |
4.190 |
4.974 |
|
WC |
2,763 |
0.181 |
0.045 |
0.149 |
0.285 |
0.220 |
-0.243 |
1.971 |
|
Capex |
2,762 |
-0.049 |
-0.062 |
-0.043 |
-0.028 |
0.030 |
-0.264 |
-0.002 |
|
Cfo |
2,762 |
0.083 |
0.049 |
0.074 |
0.104 |
0.060 |
-0.192 |
0.752 |
|
Size |
2,928 |
13.90 |
13.07 |
13.83 |
14.55 |
1.080 |
11.70 |
16.78 |
|
Lev |
2,932 |
21.39 |
1.111 |
20.49 |
35.03 |
18.17 |
0.000 |
64.62 |
|
MTB |
2,764 |
1.257 |
0.996 |
1.124 |
1.332 |
0.461 |
0.748 |
3.618 |
|
R&D |
2,764 |
3.159 |
0.510 |
2.135 |
3.986 |
3.930 |
0.000 |
20.09 |
|
CCC |
2,921 |
84.71 |
44.33 |
77.98 |
114.6 |
61.56 |
-54.74 |
301.9 |
|
Int |
2,932 |
0.394 |
0.300 |
0.300 |
0.671 |
0.301 |
0.000 |
1.217 |
|
Infl |
2,932 |
0.267 |
-0.117 |
0.060 |
0.790 |
0.906 |
-1.353 |
2.762 |
|
FXR |
2,740 |
-7.540 |
-9.709 |
0.000 |
6.199 |
29.20 |
-108.7 |
17.78 |
|
Rule |
2,932 |
1.385 |
1.312 |
1.357 |
1.518 |
0.118 |
1.196 |
1.602 |
|
Reg |
2,932 |
1.188 |
1.116 |
1.144 |
1.261 |
0.112 |
1.019 |
1.428 |
Table 3. Baseline regression: Effects of the EPU on cash holdings
|
Cash Holdings (Cash/asset) |
Cash Holdings (Cash/sales) |
|||||
|
Variable |
(1) |
2 |
(3) |
(1) |
2 |
(3) |
|
Cash Holdings t‒1 |
0.694*** |
0.914*** |
0.619*** |
|
|
|
|
Cash/Sale t‒1 |
(0.003) |
(0.026) |
(0.006) |
0.740*** |
0.955*** |
0.724*** |
|
|
|
|
|
(0.003) |
(0.041) |
(0.004) |
|
EPU t‒1 |
0.014*** |
0.010*** |
0.010*** |
0.014*** |
0.029*** |
0.025*** |
|
|
(0.000) |
(0.003) |
(0.001) |
(0.000) |
(0.004) |
(0.001) |
|
Firm Controls Included |
Yes |
No |
Yes |
Yes |
No |
Yes |
|
Macro Control Included |
No |
Yes |
Yes |
No |
Yes |
Yes |
|
Observations |
2,569 |
2,379 |
2,379 |
2,568 |
2,378 |
2,376 |
|
Number of firms |
192 |
192 |
192 |
192 |
192 |
192 |
|
Number of instruments |
183 |
77 |
176 |
183 |
76 |
176 |
|
AR2 p-value |
0.831 |
0.782 |
0.701 |
0.697 |
0.249 |
0.301 |
|
Hansen-J |
0.329 |
0.840 |
0.276 |
0.286 |
0.976 |
0.247 |
|
Difference in Hansen J |
0.998 |
0.233 |
0.932 |
0.998 |
0.954 |
0.985 |
|
F-stat p-value |
0.000 |
0.000 |
0.000 |
0.000 |
0.000 |
0.000 |
Notes: Robust standard errors in parentheses. *** p<0.01, ** p<0.05, * p<0.1.
Table 4. EPU, Financial constraints (firm size) and cash holdings
|
Variable |
Cash Holdings (Cash/Assets) |
Cash Holdings (Cash/Sales) |
Cash Holdings (Cash/Assets) |
Cash Holdings (Cash/Sales) |
||||||||
|
FC |
FC |
FC |
FC |
FC |
FC |
Non-FC |
Non-FC |
Non-FC |
Non-FC |
Non-FC |
Non-FC |
|
|
(1) |
(2) |
(3) |
(1) |
(2) |
(3) |
(1) |
(2) |
(3) |
(1) |
(2) |
(3) |
|
|
Cash Holdings t‒1 |
0.575*** |
0.675*** |
0.566*** |
|
|
|
0.651*** |
0.939*** |
0.557*** |
|
|
|
|
Cash/Sale t‒1 |
(0.000) |
(0.012) |
(0.009) |
0.688*** |
0.338*** |
0.720*** |
(0.032) |
(0.004) |
(0.102) |
0.691*** |
0.972*** |
0.568*** |
|
|
|
|
|
(0.001) |
(0.004) |
(0.004) |
|
|
|
(0.025) |
(0.003) |
(0.079) |
|
EPU t‒1 |
0.017*** |
0.010*** |
0.022*** |
0.023*** |
0.021*** |
0.044*** |
0.007*** |
0.000*** |
0.022** |
0.010*** |
0.004*** |
0.035*** |
|
|
(0.000) |
(0.002) |
(0.001) |
(0.000) |
(0.001) |
(0.001) |
(0.003) |
(0.000) |
(0.009) |
(0.004) |
(0.000) |
(0.009) |
|
Firm Controls Included |
Yes |
No |
Yes |
Yes |
No |
Yes |
Yes |
No |
Yes |
Yes |
No |
Yes |
|
Macro Control Included |
No |
Yes |
Yes |
No |
Yes |
Yes |
No |
Yes |
Yes |
No |
Yes |
Yes |
Notes: This table shows the regression results of EPU, FC, and Non-FC firm cash holdings. We segregate the firms based on firm size (total assets). Post-diagnostics of system-GMM are suppressed for brevity. Robust standard errors are in parentheses. *** p<0.01, ** p<0.05, * p<0.1.
Table 5. EPU, financial constraints (Market-to-book ratio), and cash holdings
|
Variable |
Cash Holdings (Cash/Assets) |
Cash Holdings (Cash/Sales) |
Cash Holdings (Cash/Assets) |
Cash Holdings (Cash/Sales) |
||||||||
|
FC |
FC |
FC |
FC |
FC |
FC |
Non-FC |
Non-FC |
Non-FC |
Non-FC |
Non-FC |
Non-FC |
|
|
(1) |
(2) |
(3) |
(1) |
(2) |
(3) |
(1) |
(2) |
(3) |
(1) |
(2) |
(3) |
|
|
Cash Holdings t‒1 |
0.041*** |
0.109*** |
0.159*** |
|
|
|
0.879*** |
0.709*** |
0.807*** |
|
|
|
|
Cash/Sale t‒1 |
(0.004) |
(0.027) |
(0.007) |
0.654*** |
0.587*** |
0.703*** |
(0.001) |
(0.066) |
(0.003) |
0.646*** |
0.600*** |
0.522*** |
|
|
|
|
|
(0.004) |
(0.048) |
(0.005) |
|
|
|
(0.001) |
(0.043) |
(0.003) |
|
EPU t‒1 |
0.036*** |
0.023*** |
0.031*** |
0.037*** |
0.011* |
0.038*** |
0.035*** |
0.019*** |
0.062*** |
0.041*** |
0.009** |
0.129*** |
|
|
(0.000) |
(0.006) |
(0.001) |
(0.001) |
(0.006) |
(0.001) |
(0.000) |
(0.005) |
(0.001) |
(0.000) |
(0.004) |
(0.001) |
|
Firm Controls Included |
Yes |
No |
Yes |
Yes |
No |
Yes |
Yes |
No |
Yes |
Yes |
No |
Yes |
|
Macro Control Included |
No |
Yes |
Yes |
No |
Yes |
Yes |
No |
Yes |
Yes |
No |
Yes |
Yes |
Notes: This table shows the regression results of EPU, FC, and Non-FC firm cash holdings. We segregate the firms based on the market-to-book ratio. Post-diagnostics of system-GMM are suppressed for brevity. Robust standard errors are in parentheses. *** p<0.01, ** p<0.05, * p<0.1.
Figure 1. Trends in EPU and cash holdings in Japan 2003-2023
Figure 2. Relationship between EPU and cash holdings
The estimated coefficients of lagged EPU are consistently positive, ranging from 0.009 to 0.041, and are statistically significant across all models, mostly at the 1% level, confirming a robust positive association between economic policy uncertainty and corporate cash holdings. This relationship holds across both proxies for cash holdings, Cash/Assets and Cash/Sales, further validating the baseline findings. These results align well with Keynes's liquidity preference theory, suggesting that firms accumulate cash as a buffer against heightened uncertainty. The analysis in Table 6 further incorporates the role of financial constraints, where firms are classified as financially constrained (FC) or non-financially constrained (Non-FC) based on their leverage levels. High-leverage firms are considered more constrained in accessing external finance and, thus, are expected to rely more on internal liquidity reserves. The results clearly show that FC firms, those with high leverage, respond more sensitively to increases in EPU. For instance, the EPU coefficients for FC firms range from 0.021 to 0.041, while the corresponding range for Non-FC firms is 0.005 to 0.055, with generally lower magnitudes and occasionally marginal levels of significance (e.g., 5% and 10%). These findings are consistent with the notion that constrained firms face greater uncertainty about future cash inflows and investment financing, leading them to hold more cash as a precautionary buffer.
Overall, the evidence in Table 6 underscores the amplifying effect of leverage-based financial constraints on the EPU–cash holdings relationship, reinforcing the importance of internal liquidity for firms with limited access to credit markets during uncertain policy periods. For an additional robustness check, the EPU measure in World Uncertainty Index provided by Ahir et al. [26] is used to explore the impact of uncertainty on the cash holdings in Japanese firms. Similarly, the regression results in Table 6 indicate the significant and positive effect of Ahir et al. [26] uncertainty index in Japan on the cash holdings of Japanese firms.
Table 7 presents regression results examining the moderating role of credit availability in the relationship between economic policy uncertainty and corporate cash holdings. Credit availability is proxied using the interest coverage ratio (ICR), a well-established indicator of a firm’s ability to meet its interest obligations and, by extension, its financial flexibility. The findings reveal that lagged EPU remains a significant and positive predictor of cash holdings across all model specifications. For financially constrained (FC) firms, those with low ICR, the EPU coefficients are particularly strong, ranging from 0.032 to 0.087, and are statistically significant at conventional levels. Notably, the FC firms exhibit higher EPU coefficients than their unconstrained counterparts, reaffirming the precautionary motive for cash accumulation under constrained credit conditions. By contrast, Non-FC firms, those with higher credit availability, still demonstrate a positive association between EPU and cash holdings, but the coefficients are generally smaller (e.g., 0.003 to 0.093) and in some cases only marginally significant (p < 0.05 or p < 0.10), such as the 0.003 coefficient for specification (2). These results indicate that access to external financing buffers the impact of policy uncertainty on liquidity needs.
Moreover, the consistency of findings across both cash proxies, Cash/Assets and Cash/Sales, enhances the robustness of the results. Taken together, the evidence in Table 7 confirms that credit-constrained firms (low ICR) adjust their cash policies more aggressively in response to policy uncertainty compared to firms with high credit availability, reinforcing the differential sensitivity of firms based on financing flexibility.
For an additional robustness check, the EPU measure in World Uncertainty Index provided by Ahir et al. [26] is used to explore the impact of uncertainty on the cash holdings in Japanese firms in Table 8. Similarly, the regression results in Table 8 indicate the significant and positive effect of Ahir et al. [26] uncertainty index in Japan on the cash holdings of Japanese firms.
Table 6. EPU, financial constraints (leverage), and cash holdings
|
Variable |
Cash Holdings (Cash/Assets) |
Cash Holdings (Cash/Sales) |
Cash Holdings (Cash/Assets) |
Cash Holdings (Cash/Sales) |
||||||||
|
FC |
FC |
FC |
FC |
FC |
FC |
Non-FC |
Non-FC |
Non-FC |
Non-FC |
Non-FC |
Non-FC |
|
|
(1) |
(2) |
(3) |
(1) |
(2) |
(3) |
(1) |
(2) |
(3) |
(1) |
(2) |
(3) |
|
|
Cash Holdings t‒1 |
0.039*** |
0.112*** |
0.145*** |
|
|
|
0.743*** |
0.879*** |
0.763*** |
|
|
|
|
Cash/Sale t‒1 |
(0.003) |
(0.007) |
(0.003) |
0.518*** |
0.481*** |
0.490*** |
(0.002) |
(0.050) |
(0.001) |
0.612*** |
0.578*** |
0.498*** |
|
|
|
|
|
(0.007) |
(0.043) |
(0.003) |
|
|
|
(0.002) |
(0.039) |
(0.005) |
|
EPU t‒1 |
0.029*** |
0.021*** |
0.037*** |
0.029*** |
0.009* |
0.041*** |
0.032*** |
0.015*** |
0.055*** |
0.049*** |
0.005** |
0.137*** |
|
|
(0.000) |
(0.002) |
(0.000) |
(0.001) |
(0.004) |
(0.007) |
(0.002) |
(0.003) |
(0.003) |
(0.001) |
(0.007) |
(0.002) |
|
Firm Controls Included |
Yes |
No |
Yes |
Yes |
No |
Yes |
Yes |
No |
Yes |
Yes |
No |
Yes |
|
Macro Control Included |
No |
Yes |
Yes |
No |
Yes |
Yes |
No |
Yes |
Yes |
No |
Yes |
Yes |
Notes: This table shows the regression results of EPU, FC, and Non-FC firm cash holdings. We segregate the firms based on the leverage. Post-diagnostics of system-GMM are suppressed for brevity. Robust standard errors are in parentheses. *** p<0.01, ** p<0.05, * p<0.1.
Table 7. EPU, financial constraints (credit availability), and cash holdings
|
Variable |
Cash Holdings (Cash/Assets) |
Cash Holdings (Cash/Sales) |
Cash Holdings (Cash/Assets) |
Cash Holdings (Cash/Sales) |
||||||||
|
FC |
FC |
FC |
FC |
FC |
FC |
Non-FC |
Non-FC |
Non-FC |
Non-FC |
Non-FC |
Non-FC |
|
|
(1) |
(2) |
(3) |
(1) |
(2) |
(3) |
(1) |
(2) |
(3) |
(1) |
(2) |
(3) |
|
|
Cash Holdings t‒1 |
0.846*** |
0.213*** |
0.353*** |
|
|
|
0.724*** |
0.984*** |
0.842*** |
|
|
|
|
Cash/Sale t‒1 |
(0.001) |
(0.007) |
(0.001) |
0.739*** |
0.435*** |
0.143*** |
(0.001) |
(0.009) |
(0.003) |
0.756*** |
0.487*** |
0.167*** |
|
|
|
|
|
(0.004) |
(0.001) |
(0.003) |
|
|
|
(0.001) |
(0.021) |
(0.001) |
|
EPU t‒1 |
0.087*** |
0.052*** |
0.046*** |
0.065*** |
0.032* |
0.085*** |
0.033*** |
0.052*** |
0.089*** |
0.035*** |
0.003** |
0.093*** |
|
|
(0.002) |
(0.008) |
(0.001) |
(0.001) |
(0.006) |
(0.001) |
(0.000) |
(0.000) |
(0.002) |
(0.000) |
(0.004) |
(0.001) |
|
Firm Controls Included |
Yes |
No |
Yes |
Yes |
No |
Yes |
Yes |
No |
Yes |
Yes |
No |
Yes |
|
Macro Control Included |
No |
Yes |
Yes |
No |
Yes |
Yes |
No |
Yes |
Yes |
No |
Yes |
Yes |
Notes: This table shows the regression results of EPU, FC, and Non-FC firm cash holdings. We segregate the firms based on the credit availability proxied as interest coverage ratio. Post-diagnostics of system-GMM are suppressed for brevity. Robust standard errors are in parentheses. *** p<0.01, ** p<0.05, * p<0.1.
Table 8. Effect of world uncertainty index on cash holdings
|
Variable |
Cash Holdings (Cash/asset) |
Cash Holdings (Cash/sales) |
||||
|
(1) |
(2) |
(3) |
(1) |
(2) |
(3) |
|
|
Cash Holdings t‒1 |
0.940*** |
0.836*** |
0.617*** |
|
|
|
|
Cash/Sale t‒1 |
(0.003) |
(0.031) |
(0.006) |
0.865*** |
0.668*** |
0.720*** |
|
|
|
|
|
(0.004) |
(0.027) |
(0.004) |
|
World Uncertainty Index t‒1 |
0.006*** |
0.025** |
0.016*** |
0.041*** |
0.127*** |
0.016*** |
|
|
(0.001) |
(0.011) |
(0.002) |
(0.001) |
(0.020) |
(0.002) |
|
Firm Controls Included |
Yes |
No |
Yes |
Yes |
No |
Yes |
|
Macro Control Included |
No |
Yes |
Yes |
No |
Yes |
Yes |
|
Observations |
2,569 |
2,379 |
2,377 |
2,568 |
2,378 |
2,376 |
|
Number of firms |
192 |
192 |
192 |
192 |
192 |
192 |
|
Number of instruments |
189 |
65 |
176 |
176 |
95 |
176 |
|
AR2 p-value |
0.125 |
0.823 |
0.717 |
0.994 |
0.161 |
0.267 |
|
Hansen-J |
0.350 |
0.341 |
0.280 |
0.232 |
0.711 |
0.288 |
|
Difference in Hansen J |
0.510 |
0.460 |
0.926 |
0.810 |
0.838 |
0.991 |
|
F-stat p-value |
0.000 |
0.000 |
0.000 |
0.000 |
0.000 |
0.000 |
Notes: Robust standard errors in parentheses. *** p<0.01, ** p<0.05, * p<0.1
This paper investigated the impact of economic and policy uncertainty on Japan's corporate cash holdings of listed non-financial firms. The paper found the significant and positive effect of the EPU on cash holdings. This baseline evidence is robust to implement various robustness checks. This evidence implies that firms increase their cash reserve as a precautionary motive. Increasing economic policy uncertainty may lead firms to postpone capital investment decisions, resulting in greater cash accumulation as firms await more stable conditions for project implementation. Therefore, as a financial regulator, the government can provide favourable policies to promote investments and encourage firms to invest in new projects rather than sitting on cash. It is important to note that our findings are limited to the listed non-financial firms in Japan. Future papers can focus on other developed countries to examine the impact of uncertainty shocks on cash holding. At this stage, it may be interesting to see the role of the COVID-19 pandemic in terms of the impact of uncertainty shocks on cash holding.
Our findings provide practical implications for corporate managers and policymakers in Japan. Managers should closely monitor EPU indicators to dynamically adjust cash management policies, optimizing liquidity positions without excessively restricting investments. Regulators might mitigate corporate uncertainty by ensuring transparency and predictability in fiscal and monetary policies, thereby encouraging productive investment rather than precautionary cash accumulation.
The authors extend their appreciation to the Arab Open University for funding this work through research fund No. (AOUKSA-524008).
[1] Baker, S.R., Bloom, N., Davis, S.J. (2016). Measuring economic policy uncertainty. The Quarterly Journal of Economics, 131(4): 1593-1636. https://doi.org/10.1093/qje/qjw024
[2] Wu, J., Zhang, J., Zhang, S., Zou, L. (2020). The economic policy uncertainty and firm investment in Australia. Applied Economics, 52(31): 3354-3378. https://doi.org/10.1080/00036846.2019.1710454
[3] Iqbal, U., Gan, C., Nadeem, M. (2020). Economic policy uncertainty and firm performance. Applied Economics Letters, 27(10): 765-770. https://doi.org/10.1080/13504851.2019.1645272
[4] Gozgor, G., Demir, E., Belas, J., Yesilyurt, S. (2019). Does economic uncertainty affect domestic credits? An empirical investigation. Journal of International Financial Markets, Institutions and Money, 63: 101147. https://doi.org/10.1016/j.intfin.2019.101147
[5] Hu, S., Gong, D. (2019). Economic policy uncertainty, prudential regulation and bank lending. Finance Research Letters, 29: 373-378. https://doi.org/10.1016/j.frl.2018.09.004
[6] Chiang, T.C. (2019). Economic policy uncertainty, risk and stock returns: Evidence from G7 stock markets. Finance Research Letters, 29: 41-49. https://doi.org/10.1016/j.frl.2019.03.018
[7] Liu, L., Zhang, T. (2015). Economic policy uncertainty and stock market volatility. Finance Research Letters, 15: 99-105. https://doi.org/10.1016/j.frl.2015.08.009
[8] Javadi, S., Mollagholamali, M., Nejadmalayeri, A., Al-Thaqeb, S. (2021). Corporate cash holdings, agency problems, and economic policy uncertainty. International Review of Financial Analysis, 77: 101859. https://doi.org/10.1016/j.irfa.2021.101859
[9] Ryosuke, F., Masazumi, H., Yukihiro, Y. (2021). Effects of economic policy uncertainty on corporate investment and strategic cash holdings: Evidence from Japan. Research Institute of Economy, Trade and Industry (RIETI) Discussion Paper Series, No. 21-E-069. Tokyo: RIETI.
[10] Arbatli, E.C., Davis, S.J., Ito, A., Miake, N. (2022). Policy uncertainty in Japan. Journal of the Japanese and International Economies, 64: 101192. http://doi.org/10.1016/j.jjie.2022.101192
[11] Keynes, J.M. (1937). The general theory of employment. The Quarterly Journal of Economics, 51(2): 209-223. https://doi.org/10.2307/1882087
[12] Amess, K., Banerji, S., Lampousis, A. (2015). Corporate cash holdings: Causes and consequences. International Review of Financial Analysis, 42: 421-433. https://doi.org/10.1016/j.irfa.2015.09.007
[13] Locorotondo, R., Dewaelheyns, N., Van Hulle, C. (2014). Cash holdings and business group membership. Journal of Business Research, 67(3): 316-323. https://doi.org/10.1016/j.jbusres.2013.01.019
[14] Foley, C.F., Hartzell, J.C., Titman, S., Twite, G. (2007). Why do firms hold so much cash? A tax-based explanation. Journal of Financial Economics, 86(3): 579-607. https://doi.org/10.1016/j.jfineco.2006.11.006
[15] Dittmar, A., Mahrt-Smith, J. (2007). Corporate governance and the value of cash holdings. Journal of Financial Economics, 83(3): 599-634. https://doi.org/10.1016/j.jfineco.2005.12.006
[16] Almeida, H., Campello, M., Weisbach, M. S. (2011). Corporate financial policies and the value of cash. Review of Financial Studies, 24(2): 679-723.
[17] Duchin, R., Ozbas, O., Sensoy, B.A. (2010). Costly external finance, corporate investment, and the subprime mortgage credit crisis. Journal of Financial Economics, 97(3): 418-435. http://doi.org/10.1016/j.jfineco.2009.12.008
[18] Opler, T., Pinkowitz, L., Stulz, R., Williamson, R. (1999). The determinants and implications of corporate cash holdings. Journal of Financial Economics, 52(1): 3-46. https://doi.org/10.1016/S0304-405X(99)00003-3
[19] Mizuno, T., Kato, R. (2019). Corporate cash holdings and economic policy uncertainty: Evidence from Japan. Asian Economic Policy Review, 14(3): 387-404.
[20] Kato, K., Yoshida, A., Saito, S. (2021). Industry-specific responses to policy uncertainty and corporate cash holdings in Japan. Journal of Corporate Finance, 68: 101850.
[21] Chen, C.R., Firth, M., Rui, O.M. (2016). Political uncertainty and corporate cash holdings: Evidence from China. Journal of Corporate Finance, 39: 254-278.
[22] Al-Najjar, B., Belghitar, Y. (2011). Corporate cash holdings and agency costs. Journal of Economics and Business, 63(3): 200-214.
[23] Phan, H.V., Nguyen, N.H., Nguyen, H.T., Hegde, S. (2019). Policy uncertainty and firm cash holdings. Journal of Business Research, 95: 71-82. https://doi.org/10.1016/j.jbusres.2018.10.001
[24] Blundell, R., Bond, S. (1998). Initial conditions and moment restrictions in dynamic panel data models. Journal of Econometrics, 87(1): 115-143. http://doi.org/10.1016/j.jeconom.2023.03.001
[25] Wintoki, M.B., Linck, J.S., Netter, J.M. (2012). Endogeneity and the dynamics of internal corporate governance. Journal of Financial Economics, 105(3): 581-606. https://doi.org/10.1016/j.jfineco.2012.03.005
[26] Ahir, H., Bloom, N., Furceri, D. (2022). The World Uncertainty Index. National Bureau of Economic Research (NBER) Working Paper, No. 29763. Cambridge, MA: NBER.