María Jaya-Montalvo*![]() | Alanis Jara-Vargas
| Alanis Jara-Vargas![]() | Erick Benavides-Jaramillo
| Erick Benavides-Jaramillo![]() | Edgar Berrezueta
| Edgar Berrezueta![]() | Fernando Morante-Carballo
| Fernando Morante-Carballo![]() | Paúl Carrión-Mero
| Paúl Carrión-Mero![]()
© 2025 The authors. This article is published by IIETA and is licensed under the CC BY 4.0 license (http://creativecommons.org/licenses/by/4.0/).
OPEN ACCESS
The search for groundwater has become a necessity because of the effects of climate change and the resulting water shortages. In rural areas, such as the "Pampa del Guasmo" (Yaguachi-Ecuador), freshwater is supplied by building shallow artisanal wells. Applying this practice sets challenges to complement the technical-scientific knowledge of aquifers, opening up the need to apply geophysical-hydrogeological techniques to characterize the terrain. The study aimed to identify areas with water saturation at greater depths using geoelectrical methods to determine suitable drilling sites that meet the community's water needs. The methodology includes: i) analysis of cartographic base information, ii) execution of electrical resistivity tomography (ERT) complemented with Multichannel Analysis of Surface Wave (MASW) + Microtremor Array Measurements (MAM) surface wave tests and rotary drilling, iii) preparation of geoelectrical profiles, correlation of geophysical-geoelectric and lithological information for the determination of potential groundwater zones. The results showed that the third layer with resistivities of 8.3-9.6 Ω.m in profile ERT-L1 and 10-15 Ω.m in profile ERT-L2 represent a semi-confined aquifer consisting of clayey-silty sand with the presence of gravel, located from 19 and 40 m depth, respectively. The application of geophysics is the key to identifying the potential for groundwater use, as corroborated by the drilling performed. Owing to the growing population in these sectors and the increased demand associated with lowering levels in excavated wells, the applied geophysics process verifies the need for deeper wells that must be managed concerning their use, environmental implications, and sustainability.
electrical resistivity tomography (ERT), aquifer, rotary drilling, seismic refraction, SDG 6
Human population growth and economic development have increased the global demand for freshwater by approximately 1% annually [1, 2]. Approximately 2.5% of the Earth's water is fresh, with groundwater accounting for 30.1% of the available freshwater [3] and plays a critical role in water resource management [4].
These underground reserves supply much of the world's population, support irrigated agriculture, and contribute to river baseflow, thereby maintaining aquatic ecosystems during drought [1].
The integration of lithological records and geophysical methods allows for the evaluation of the thickness and depth of groundwater [2], facilitating the characterization and description of the heterogeneity of surface and subsurface sediments in aquifers [3]. Geophysical studies are relevant in alluvial environments, where deposits can be identified by substantial lateral and vertical variations associated with fluvial dynamic processes [4]. Non-invasive geophysical techniques are easy to implement and represent an essential tool in hydrogeological research [5, 6] facilitating the identification of subsoil geological layers [7], which adds quantitative and qualitative analysis to the geometry of aquifers. One of the most widely used methods is electrical resistivity tomography (ERT), a multi-electrode technique to estimate subsoil geoelectrical properties that allows mapping of the vertical and lateral resistivity variation of the subsoil [8, 9]. The scope of ERT investigation is conditioned by the electrode configuration, electrode spacing, signal-to-noise ratio, and algorithm used for inversion [10]. In addition, the subsurface resistivity differs over a wide range and is determined by factors such as water content and interstitial spaces [11].
On the other hand, the Multichannel Analysis of Surface Waves (MASW) method allows for obtaining the stiffness of subsurface materials (i.e., cohesive or non-cohesive) based on seismic shear wave velocities (Vs) [4, 12]. In coastal areas, where sediments can be coarse and heterogeneous, MASW helps characterize the base of the aquifer and the transition to less permeable formations [13, 14].
In scientific literature, there are examples of combining geophysical methods to improve the subsurface interpretation because the ERT values depend on the type of material and its saturation [15]. Geophysical studies need to be complemented with additional information, such as data, to achieve a more accurate interpretation [16], for example, in the Kosti savannah (Sudan), which integrates electrical resistivity, seismic refraction, and gravity methods for groundwater projects [3]. Another case is the city of Adra in southern Spain, where the aquifer geometry was defined using geological information background and implementation of geophysical techniques (MASW and Ground Penetrating Radar (GPR)) [17]. Therefore, geoelectrical and geophysical techniques are adequate and reliable for conceptualizing a geological model for groundwater modelling [18].
Water scarcity is challenging in many countries, including Latin America [19]. In Ecuador, water is acquired from both underground (53.4%) and surface sources (46.6%) [20]. In rural communities, hydrogeological research facilitates the identification of ideal locations for drilling wells and planning strategies to ensure sustainable exploitation [21].
In rural areas, such as the "Pampa del Guasmo" (Yaguachi-Ecuador), the dependence on shallow artisanal wells reflects a lack of adequate hydrogeological studies and increases vulnerability to increasing water demand. The research gap lies in the absence of correlation and comparison of multiple methods in rural contexts, which limits informed decision-making.
Therefore, this study seeks to answer: How can integrated geophysical methods improve the selection of groundwater drilling sites in alluvial environments?
The main aim is to determine areas with greater water saturation by applying ERT methods complemented with MASW+MAM (Microtremor Array Measurements) information to establish feasible areas for drilling to meet the rural community's water needs. This approach seeks to contribute not only to the sustainable development of the region but also to the generation of knowledge that supports future research in similar contexts.
1.1 Study zone and hydrogeological setting
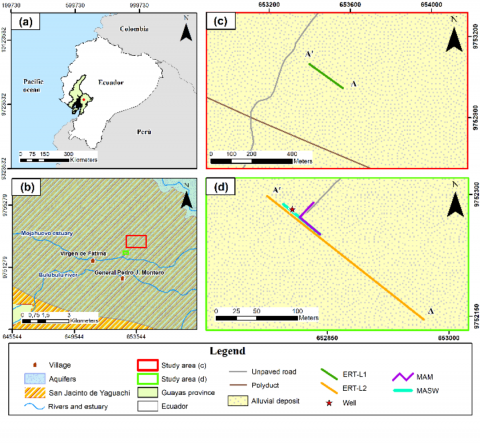
The study area is located on Ecuador's coast in the Yaguachi canton, Guayas province (Figure 1). The climate is semi-humid tropical mega thermal [22], with temperatures varying from 25 to 26℃. The average annual precipitation is between 800 and 1300 mm [23].
The "Pampa del Guasmo" area is bordered to the north by the Chimbo River and to the south by the Mojahuevo estuary and the Bulubulu River (Figure 1(b)). The surface currents of these water bodies run from east to west and flow into the Guayas River.
Figure 1. Location map (a) Guayas Province, Ecuador; (b) San Jacinto de Yaguachi canton; (c) Profile ERT-L1; (d) Profile ERT-L2, MASW, MAM and exploratory well
The geological units of the area comprise a basement of basaltic rocks corresponding to the Piñón Formation, which represents the ancient ocean floor. The Cretaceous Cayo Formation overlies this unit, made up of sandstones, graywackes, lutites, and, more commonly, argillites of gray, green, or tan color [24]. Finally, on top of these units are quaternary deposits that constitute the current soils [25]. These alluvial deposits form flat and wavy levels with meanders and abandoned channels composed of clays and silty clays. There are also marine clays from an estuarine environment, which have developed in flood zones typical of river system mouths, creating deltas from the sedimentation of clayey, silty and sandy materials [26].
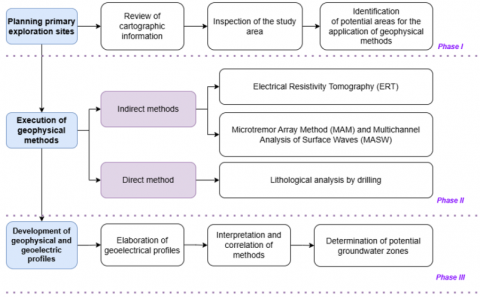
This study used geophysical techniques (geoelectric and complemented with refraction seismic data) as quantitative methods for exploring groundwater in a rural area. This geophysical information was compared, correlated, and interpreted qualitatively and quantitatively with the watershed's geological data and natural conditions. The procedure focuses on designing a correlation scheme that systematically integrates the available information to identify areas of interest for aquifers. The methodological process is summarized in Figure 2.
Figure 2. Methodological scheme applied for the delimitation of potential groundwater zones
2.1 Phase I: Planning primary exploration sites
Phase I includes reviewing topographic, geological, hydrological-hydrogeological, and geomorphological information available at the Military Geographic Institute (IGM) [27], reports from public institutions of the canton [28, 29], and scientific works that allow us to understand the context at a regional and local scale.
The data collected were corroborated in the field, leading to the execution of proposals for preliminary geophysical survey lines considering i) accessibility, ii) length, and iii) orientation to have a preferential direction towards the tributary rivers and streams that discharge into the Taura and Babahoyo Rivers. Once the preliminary geophysical prospecting lines were selected, a geophysical exploration campaign was planned for the points established in the study area (Table 1).
Table 1. Geographic coordinates of the ERT profiles
|
Profile |
Length (m) |
Spacing (m) |
Coordinates |
|
|
Initial |
Final |
|||
|
L1 |
200 |
5 |
X:653563.0 Y:9752945.0 |
X:653398.0 Y:9753064.1 |
|
L2 |
250 |
6 |
X:652969.4 Y:9752146.2 |
X: 652776.7 Y:9752298.0 |
2.2 Phase II: Execution of geophysical methods
2.2.1 Electrical resistivity tomography
The first ERT was the L1 profile with a SE-NW orientation, 200 m length, and 5 m spacing (Figure 1(c)). In the L1 profile, the Schlumberger and Wenner configurations were selected. Then, stainless steel electrodes were installed, verifying they were buried a little more than 2/3. A 12V battery and ABEM Terrameter LS equipment [30] were used. The L2 profile was constructed 1 km south of the L1 profile (Figure 1(d)). It had a SE-NW orientation, and the established electrode configuration was Wenner and Gradient, with a length of 250 m and 6 m spacing.
The Schlumberger method was selected in this study because it allows for better lateral resolution and greater penetration [31]. This contrasts with other configurations, such as the dipole-dipole array, where the signal is reduced because its electrodes are further apart, decreasing the depth capacity [32]. Additionally, the gradient array was applied for a good vertical resolution [33] and helped quickly process a higher data density [34]. The study also used the Wenner array because it has a better signal-to-noise ratio [35]; it is highly effective in horizontal structures and is a basis for all arrangement configurations [36].
2.2.2 MAM and MASW seismic methods
This study applied the MAM test, which allows the acquisition of shear wave velocity data using various two-dimensional instrumental arrangements, such as cross, L, triangle, or circle [37]. The configuration consisted of 12 seismic receivers (geophones) geometrically arranged at a 90-degree angle in an "L" shape (Figure 1(d)).
The MASW geophysical method used 12 linearly arranged geophones, maintaining the exact initial coordinate of the MAM test at one end of the geometrical array (Figure 1(d)). The data obtained from both methods were processed and combined using SeisImager software [38] and subsequently placed in Excel for better visualization. The combination of these MASW+MAM seismic methods allowed us to obtain S-wave velocity (Vs) profile based on changes in the dynamic properties of the materials [35]. The average evaluation depth ranged from 50 to 80 m, indirectly determining the subsurface stratigraphy at one point.
2.2.3 Lithological analysis by drilling
The absence of outcrops in the sector and the lack of information generated the need to conduct a 15 m exploratory drilling to correlate with the developed geophysical methods (Figure 1(d)). A pool with drilling mud was designed for circulation in the rods [39], favoring the lubrication of the drill bit and rotation [40]. The drilling equipment had a trailer-type machine with a 5 m chassis and an 8 m drilling tower, a 4.5 m kelly, 3" by 3 m long drilling rod and a 7" fin-type drill bit.
To obtain the cuttings, a mark was made on the drill rod every meter. These cuttings were then stored in plastic bags labelled with the sample number and depth. This process was repeated every meter for up to 15 m. The samples obtained from the drilling test were extracted for subsequent granulometric analysis. Although the ERT profile reaches depths of approximately 50 m, the borehole depth was strategically selected based on resistivity contrasts in the layers (Layer 1 and 2), allowing the validation of lithological transitions inferred from the ERT section and S-wave velocity profile. A 15 m drilling also represents a cost-effective solution that balances data quality and operational viability.
The first stage of granulometry was carried out based on the American Society for Testing and Materials ASTM C117 (2004) [41] standard, which determines the amount of fine material that passes through a No. 200 sieve (0.075 mm) by washing. The second stage was carried out based on the ASTM C136 (2006) [42] standard to obtain the distribution and size of the fine and coarse aggregates by sieving.
2.3 Phase III: Development of geophysical and geoelectric profiles
The data obtained from wave velocities, depth, and density are plotted in a table, and a graph of S-wave velocity in m/s vs. depth was obtained. This graph constitutes an indirect representation of the subsoil with stiffness values that vary along the soil profile [43, 44] and facilitates the drilling process's planning. To interpret the shear wave velocity vs. depth graph, Technical Standard E.030 [45] was used as a reference, classifying soil profiles into five types, as detailed in Table 2.
Table 2. Description and type of each profile according to the Technical Standard E0.30 (2016) [45]
|
Profile |
Type |
Description |
|
S0 |
Hard Rock |
Healthy rocks with |
|
S1 |
Very Rigid Rocks or Soils |
Rocks with different degrees of fracture, homogeneous massifs, and very rigid soils with |
|
S2 |
Intermediate Soils |
Moderately rigid soils with |
|
S3 |
Soft Soils |
Flexible soil with |
|
S4 |
Exceptional Conditions |
Exceptionally flexible soils and sites where the geological and/or topographic conditions are particularly unfavorable; a specific study of the site is required. |
AGI EarthImager™ 2D software [46] was used to invert the apparent resistivity data of the ERTs. The results were interpreted based on the resistivity range of Gunn et al. [47] and Reynolds [48] (Figure 3). Additionally, the damped least-squares inversion algorithm was used because it controls the relation between the data fit (Root Mean Square (RMS)) and the level of detail obtained in the profile [49].
Finally, the lithological and percentage particle size profile were obtained using the Strater 5 software, and the results of the geoelectrical pseudosections were correlated.
3.1 Results of applied geophysics
3.1.1 Resistivity sections
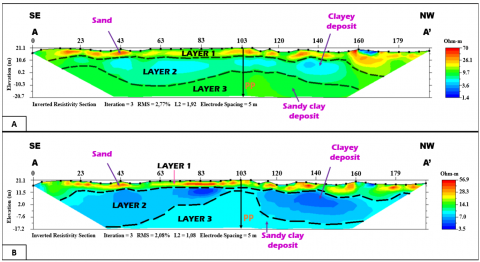
The ERT-L1 profile reached a depth of 40 m. The Schlumberger array obtained an RMS of 2.77%, and its resistivity limits range from 1.4 Ω.m to 70 Ω.m. The Wenner array presented an RMS of 2.08% with resistivity values from 3.5 Ω.m to 56.9 Ω.m (Figure 3).
Figure 3. ERT-L1 profile. (A) Schlumberger array, (B) Wenner array
In this profile, three layers were identified. The high resistivity values (10.5–70 Ω·m) in the upper layer (Layer 1) suggest the presence of sand lenses within a clayey sand environment with low moisture content. Its lower boundary is interpreted as the water table, located at approximately 9 m depth. Layer 2 has low resistivity values (around 4 Ω.m), which is interpreted as saturated clayey material with an inhomogeneous distribution. Its thickness was varied from 10 to 20 m. Layer 2 is associated with that observed in another study [50] that established a 1-10 Ω.m range for saturated clays. Layer 3 exhibited 11 Ω.m values associated with sandy material interbedded with clayey sediments. Owing to the overlying clay layer, it may be interpreted as a semi-confined aquifer. This layer is situated at depths ranging from 19 to 29 m and thus presents a variable thickness.
The Schlumberger array was more sensitive to lateral (horizontal) changes than the Wenner array. A comparison of these arrays is evident near 103 m in the profile length, making Layer 2 more noticeable. This agrees with the results of Basri et al. [51], who mentioned that the Schlumberger distribution is superior in detecting lateral resistivity inhomogeneity compared with Wenner.
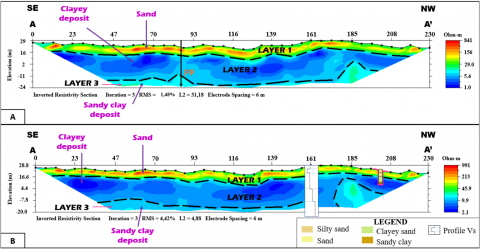
The ERT-L2 profile reached a depth of 50 m. The gradient array obtained an RMS of 1.48%, and its resistivity limits ranged from 1.0 Ω.m to 841 Ω.m. The Wenner array exhibited an RMS of 4.42%, with resistivity values ranging from 2.1 Ω.m to 991 Ω.m (Figure 4).
Figure 4. ERT-L2 profile (A) Gradient array, (B) Wenner array
In this profile, three layers similar to the ERT-L1 profile were identified with variations in the thickness of the layers; the high resistivity values (approximately between 150–990 Ω.m) distributed along the upper layer (layer 1) are interpreted as sand lenses in a sand clayey environment with low humidity, and its lower limit is associated with the water table at a depth of approximately 13 m (Figure 4A-B). Layer 2, with low resistivities (1-4 Ω.m), suggests a saturated clayey material distributed in large clay bodies and its thickness varies from 20 to 26 m. Layer 3, with values around 10 to 30 Ω.m is located at approximately 40 meters with an undefined thickness and is probably made up of silty clay sand with gravel saturated with fresh water, close to the values found by Galazoulas et al. [52] who attributes a range of 15-40 Ω.m for coarse-grained sediments saturated with fresh water. Because of the clay layer that covers it, it could be a semi-confined aquifer.
An investigation that sought to map the subsurface in an alluvial fan [53] identified a similar pattern, showing a gradation of resistivity that decreases with depth, with the difference that it establishes the surface layer as boulders and gravel (>100 Ω.m), followed by sand lenses, and consequently a thick layer with a high clay content.
3.1.2 Surface wave tests
Figure 5 shows the shear wave velocity profile. Four levels were evident along a depth of 55 m, reaching values of 610 m/s. The gradation of the S-wave velocities varied from 300 to 610 m/s, indicating that the material progressed from soft to very stiff soil, characteristic of a sedimentary environment.
Figure 5. Shear wave velocity profile
3.2 Interpretation and conceptual model of the aquifer system
3.2.1 Granulometric analysis
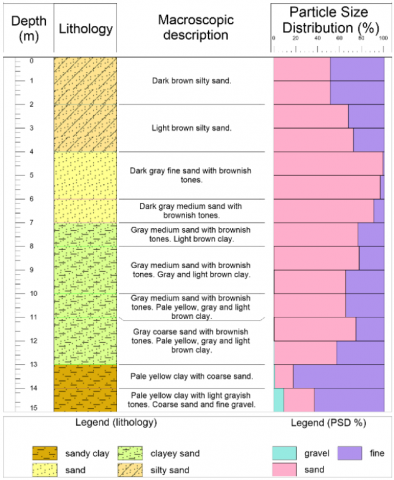
Figure 6 shows the macroscopic description and particle size distribution in each meter up to a depth of 15 m. In the first few meters, silty sand was identified with a gradient from dark to light brown; in the range from 4 to 7 m, the most significant amount of sand was found with a transition from fine to medium texture, where the highest peak was 96.32% between 4 and 5 m. From 7 m to 13 m, a transition from medium to coarse sand was evident with increased clay content. Finally, in the last two meters, a more significant proportion of clay was present with coarse sand, and the percentage of gravel reached 9.15% at 14 m.
Figure 6. Lithological profile based on granulometric analysis and macroscopic description
3.2.2 Correlation of geophysics with drilling data
The resistivity sections obtained were compared with the lithological information derived from drilling to validate the geophysical results. It was observed that the resistivity changes in the ERT-L1 and ERT-L2 profiles coincided with the lithological transitions detected in the drilling, evidencing the presence of a water table between 9 and 13 m depth.
The upper layer identified in the ERT profiles is characterized by high resistivity values of 26-70 Ω.m in profile L1 (Schlumberger configuration) and 156-841 Ω.m in profile L2 (Gradient configuration), which correspond to sandy strata detected in the first meters of the borehole. The intermediate layer of low resistivity coincides with the area of high proportion of clay identified in the borehole, confirming its impermeable character. The third layer, with slightly higher resistivity, is associated with gravel and silty clay sand, suggesting the existence of a semi-confined aquifer.
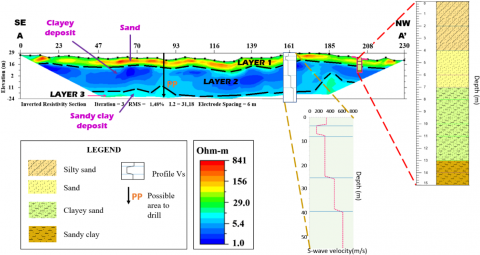
The ERT-L2 profile showed a strong correlation with the seismic methods and drilling because of the proximity of the studies (Figure 7). The MAM+MASW test showed a decrease in shear wave velocities between 3 and 8 m, which presented similarities in thickness and depth with the lithological profile from 4 to 7 m and the ERT-L2A profile between 3 and 6 m. The drop-in shear wave velocities (130 m/s) refer to soft soils with low stiffness and a tendency to deform under external loads. The lithological profile showed that in this depth range, medium to fine, clean, loose sands were found; the ERT-L2A profile showed resistivities of 213 to 991 Ω.m, corresponding to dry sandy soil. Based on the correlation of these methods, a dry, clean sandy stratum was confirmed between depths of 3 and 8 m.
Furthermore, the Gradient electrode array performed better than the Wenner array in superimposing the information, coinciding with the other applied methods (Figure 7). Thus, it is suggested that the gradient electrode configuration offers higher spatial resolution and penetration depth than the Wenner array [36].
Figure 7. Correlation of applied methods
The selection and integration of the methods used validate the results and highlight their importance for estimating aquifer zones in an alluvial environment (Table 3). For example, a study carried out in southwest Portugal [18] integrated the MASW and ERT to define an alluvial aquifer, obtaining favourable results when combining both methods. These methods were used to conceptualize geological models and model groundwater flow. This finding reinforces the reliability of the techniques used, validating their application in future studies of alluvial environments.
Table 3. Comparison of the information obtained from the methods used
|
Layer |
Depth (m) |
Interpretation |
Drilling Description |
|
|
ERT |
MASW/MAM |
|||
|
1 |
0-13 |
sand lenses in a sand clayey environment |
Soft Soils |
Silty sand and fine to coarse sand with some clay |
|
2 |
13-40 |
clayey-saturated material |
Intermediate Soils |
Clay with coarse sand and some gravel (up to 15 m) |
|
3 |
>40 |
silty clay sand with gravel saturated |
Rock or Very Rigid Soils |
Not reached |
3.2.3 Conceptual diagram of the aquifer system
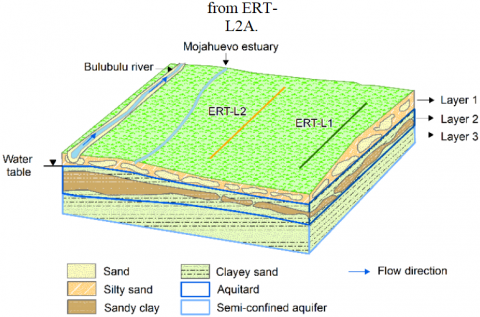
These results allowed us to define the two types of aquifers. An aquitard (layer 2) located between 9 and 13 m depth presents variable thicknesses and heterogeneous distribution, possibly due to the action of water when infiltrating the ground, washing the material from the first layer, and carrying the clayey material to this layer in a process known as eluviation. The semi-confined aquifer (layer 3) is located between 19 and 29 m in the ERT-L1 profile, and at 40 m in the ERT-L2 profile, it presents a variable thickness and is interpreted as a sand clayey material (Figure 8).
Figure 8. Conceptual diagram of the aquifer system
3.2.4 Limitations and future studies
This study allowed us to delimit aquifers in an alluvial environment by combining geophysical-geological tools and data validation with exploratory drilling, confirming the effectiveness of the geophysical methods used to identify potential groundwater zones. However, studies on water quality [54], such as physicochemical and biological parameters, are essential. These water analyses will allow us to evaluate and compare the current regulations for domestic and agricultural use.
In addition, it is recommended that 3D ERT modelling be carried out by developing additional 2D ERTs in the study area that allow detailed visualization of the aquifer's geometry, location of critical or vulnerable points to overexploitation and contamination, and delimitation of protection areas for its recharge.
3.2.5 Social and environmental implications of groundwater geophysical exploration
The drinking water supply in Ecuador covers 92% of the population and sanitation covers 86%. However, in the rural sector, the problem lies in the availability of this resource and its quality assurance [55], an aspect that relates to the Sixth Sustainable Development Goal which aims to ensure the availability and sustainable management of water and sanitation for all [56].
This study identified potential groundwater areas in the rural areas of the Ecuadorian coast, promoting improved water access to populations with significant needs for this resource. Guaranteeing equitable access to water for all communities [57] and providing water resource management and conservation training is vital.
Geophysical exploration is a noninvasive method that minimizes environmental impacts. Implementing strategies that ensure biodiversity conservation and sustainable management of water resources by applying available and applicable geophysical techniques is the path to the water sustainability.
This study identified water-saturated zones beginning at 9 m (ERT-L1) and 13 m (ERT-L2), overlying semi-confined aquifers at greater depths. The first aquifer level constitutes the water source for the rural community's artisanal wells. The third layer of ERT-L1 suggests the presence of saturated sandy clay deposits with freshwater at depths of approximately 18 and 28 m, considering thicker deposits feasible for future drilling.
The increase in resistivity gradation with depth suggests the possibility of identifying an aquifer with better characteristics at a depth of 50 m. These results confirm the importance of integrating multiple methods to reduce uncertainty and improve hydrogeological characterization. Therefore, this methodology can be adapted to similar alluvial environments for groundwater exploration.
In addition, this analysis recommends future drilling at a depth of 26 m at 103 m of the ERT-L1 investigation line and a depth of 60 m at 87 m of the ERT-L2 profile because of its continuity towards the semi-confined aquifer and its avoidance of excessively clayey soils. These findings contribute to the planning of strategic drilling aimed at meeting the water needs of rural communities in a sustainable and efficient manner.
We acknowledge the "Pampa del Guasmo" communities for helping with the geophysical campaign and providing support during fieldwork. Additionally, we acknowledge the research project titled "Registry of geological interest sites of Ecuador for sustainable development strategies" with institutional code CIPAT-004-2024 for its support and contributions to this study.
|
$\Omega$.m |
ohmio meter |
|
Vs |
shear wave velocity |
[1] Moeck, C., Collenteur, R.A., Berghuijs, W.R., Luijendijk, E., Gurdak, J.J. (2024). A global assessment of groundwater recharge response to infiltration variability at monthly to decadal timescales. Water Resources Research, 60(6): e2023WR035828. https://doi.org/10.1029/2023WR035828
[2] Gouasmia, M., Dhahri, F., Azaiez, H., Zidi, M.K., Soussi, M. (2023). Hydrogeological, geophysical, geochemical and statistical integrated techniques to assess a multilayered groundwater aquifer system in an arid region: The case of the Sbeitla aquifers in Central Tunisia. Environmental Earth Sciences, 82(13): 320. https://doi.org/10.1007/s12665-023-11021-y
[3] Van Overmeeren, R.A. (1981). A combination of electrical resistivity, seismic refraction, and gravity measurements for groundwater exploration in Sudan. Geophysics, 46(9): 1304-1313. https://doi.org/10.1190/1.1441269
[4] Kuang, X., Liu, J., Scanlon, B.R., Jiao, J.J., et al. (2024). The changing nature of groundwater in the global water cycle. Science, 383(6686): adf0630. https://doi.org/10.1126/science.adf0630
[5] Alabi, A.A., Popoola, O.I., Olurin, O.T., Ogungbe, A.S., Ogunkoya, O.A., Okediji, S.O. (2020). Assessment of groundwater potential and quality using geophysical and physicochemical methods in the basement terrain of Southwestern, Nigeria. Environmental Earth Sciences, 79: 1-13. https://doi.org/10.1007/s12665-020-09107-y
[6] Ismail, E., Alexakis, D.E., Heleika, M.A., Hashem, M., Ahmed, M.S., Hamdy, D., Ali, A. (2023). Applying geophysical and Hydrogeochemical methods to evaluate groundwater potential and quality in middle Egypt. Hydrology, 10(8): 173. https://doi.org/10.3390/hydrology10080173
[7] Carrión-Mero, P., Benalcazar, X., Ramos, N., Olaya, P., Sánchez-Zambrano, E., Solorzano, J., Jaya-Montalvo, M., Padilla-Cáceres, K., Jara-Vargas, A., Morante-Carballo, F. (2024). GIS application for groundwater information processing and sustainable use in rural communities. In ICAIW 2024: Workshops at the 7th International Conference on Applied Informatics 2024, Viña del Mar, Chile, pp. 101-115. https://ceur-ws.org/Vol-3795/icaiw_aiesd_6.pdf.
[8] Mondal, N.C. (2024). Insights of 2-D Electrical Resistivity Tomography (ERT) for palaeo-channels and multi-aquifer dispositions in a morphodynamic system of the Ganga basin. https://doi.org/10.21203/rs.3.rs-4200238/v1
[9] Nemer, Z., Khaldaoui, F., Benaissa, Z., Belaroui, A., Goumrasa, A., Akziz, D., Djeddi, M. (2023). A combined GIS, remote sensing, and geoelectrical method for groundwater prospect assessment and aquifer mapping in El-Hamiz Sub-watershed, Algiers, Algeria. Environmental Earth Sciences, 82(3): 93. https://doi.org/10.1007/s12665-023-10746-0
[10] Cardarelli, E., De Donno, G. (2019). Advances in electric resistivity tomography: Theory and case studies. In Innovation in Near-Surface Geophysics. Elsevier, Amsterdam, Netherlands, pp. 23-57. https://doi.org/10.1016/B978-0-12-812429-1.00002-7
[11] Zhang, G., Tu, F.Z., Tang, Y.S., Chen, X.C., Xie, K.L., Dai, S. (2023). Application of geophysical prospecting methods ERT and MASW in the landslide of Daofu County, China. Frontiers in Earth Science, 10: 1054394. https://doi.org/10.3389/feart.2022.1054394
[12] Rahimi, S., Wood, C.M., Coker, F., Moody, T., Bernhardt-Barry, M., Kouchaki, B.M. (2018). The combined use of MASW and resistivity surveys for levee assessment: A case study of the Melvin Price Reach of the Wood River Levee. Engineering Geology, 241: 11-24. https://doi.org/10.1016/j.enggeo.2018.05.009
[13] Grelle, G., Guadagno, F.M. (2009). Seismic refraction methodology for groundwater level determination:“Water seismic index”. Journal of Applied Geophysics, 68(3): 301-320. https://doi.org/10.1016/j.jappgeo.2009.02.001
[14] Foti, S., Hollender, F., Garofalo, F., Albarello, D., et al. (2018). Guidelines for the good practice of surface wave analysis: A product of the InterPACIFIC project. Bulletin of Earthquake Engineering, 16: 2367-2420. https://doi.org/10.1007/s10518-017-0206-7
[15] Rupesh, R., Tiwari, P., Sharma, S.P. (2024). Estimation of geotechnical parameters for coal exploration from quasi-3D electrical resistivity measurements. Minerals, 14(1): 102. https://doi.org/10.3390/min14010102
[16] Chu, D.P., Fu, J.M., Wan, B., Li, H., Li, L.L., Fang, F., Zhou, S.P. (2024). A multi-view ensemble machine learning approach for 3D modeling using geological and geophysical data. International Journal of Geographical Information Science, 38(12): 2599-2626. https://doi.org/10.1080/13658816.2024.2394228
[17] Alcalá, F.J., Martínez-Pagán, P., Paz, M.C., Navarro, M., Pérez-Cuevas, J., Domingo, F. (2021). Combining of MASW and GPR imaging and hydrogeological surveys for the groundwater resource evaluation in a coastal urban area in southern Spain. Applied Sciences, 11(7): 3154. https://doi.org/10.3390/app11073154
[18] Paz, M.C., Alcalá, F.J., Medeiros, A., Martínez-Pagán, P., Pérez-Cuevas, J., Ribeiro, L. (2020). Integrated MASW and ERT imaging for geological definition of an unconfined alluvial aquifer sustaining a coastal groundwater-dependent ecosystem in southwest Portugal. Applied Sciences, 10(17): 5905. https://doi.org/10.3390/app10175905
[19] Herrera-Franco, G., Morante-Carballo, F., Bravo-Montero, L., Valencia-Robles, J., Aguilar-Aguilar, M., Martos-Rosillo, S., Carrión-Mero, P. (2024). Water Sowing and Harvesting (WS&H) for Sustainable management in ecuador: A review. heritage, 7(7): 3696-3718. https://doi.org/10.3390/heritage7070175
[20] Carrión-Mero, P., Jaime, M., Calderón, L., Sánchez-Zambrano, E., Malavé-Hernández, J., Aguilar-Aguilar, M., Merchán-Sanmartín, B., Morante-Carballo, F., Espinel, R. (2024). Water use alternatives to proposal agricultural development in a semi-arid zone: Ayangue commune, Ecuador. International Journal of Sustainable Development and Planning, 19(10): 3793-3807. https://doi.org/10.18280/ijsdp.191009
[21] Carrión-Mero, P., Solórzano, J., Malavé-Hernández, J., Martínez-Angulo, J., Javier, M.F., Morante-Carballo, F. (2024). Mapping groundwater potential zones for sustainable agricultural development in Entre Ríos, Ecuador. International Journal of Design & Nature and Ecodynamics, 19(3): 817-830. https://doi.org/10.18280/ijdne.190312
[22] Pourrut, P. (1995). El agua en el Ecuador : Clima, precipitaciones, escorrentía. Quito: Colegio de Geógrafos del Ecuador. https://horizon.documentation.ird.fr/exl-doc/pleins_textes/pleins_textes_7/divers2/010014823.pdf.
[23] GAD Parroquial Rural Gral. Pedro J. Montero. (2015). Plan de desarrollo y ordenamiento territorial de la parroquia rural de Gral. Pedro J. Montero 2015-2025. https://ellaurel.gob.ec/media/pjmontero/pdot_archivos/pdot_2015-2025.pdf.
[24] Olsson, A.A. (1931). Contributions to the tertiary paleontology of Northern Peru: Part 4, the Peruvian Oligocene. Bulletins of American Paleontology, 17: 99-264.
[25] Tapia Aldas, J.C. (2012). Hydrologic modelling of an experimental area in the Guayas River basin to quantify liquid and solid flow production. Doctoral dissertation, Universidad Nacional de La Plata. https://doi.org/10.35537/10915/23364
[26] Asociación Municipalidad del Ecuador and GADM San Jacinto de Yaguachi. (2014). Plan de desarrollo y ordenamiento territorial del cantón San Jacinto de Yaguachi 2014-2019.
[27] IGM and GADM-San Jacinto de Yaguachi. (2020). Mapa de la geología estratigráfica del cantón San Jacinto de Yaguachi. Escala 1:70000. https://municipiodeyaguachi.gob.ec/wp-content/uploads/2021/05/11.-Geologia-Estratigr%C3%A1fica.pdf.
[28] GADM San Jacinto de Yaguachi. (2020). Plan de Desarrollo y Ordenamiento Territorial del Cantón San Jacinto de Yaguachi 2020-2024. https://municipiodeyaguachi.gob.ec/pdot-gad-yaguachi/
[29] GADP Rural de Yaguachi Viejo "Cone" (2015). Plan de Desarrollo y Ordenamiento Territorial Yaguachi Viejo CONE 2015-2025. https://yaguachiviejocone.gob.ec/media/yaguachiviejocone/pdot_archivos/PDOT_CONE_2019-2023.pdf.
[30] Guideline Geo. (2024). ABEM Terrameter LS 2. https://www.guidelinegeo.com/product/abem-terrameter-ls-2/.
[31] Al-Maktoumi, A., Abdalla, O., Kacimov, A., Zekri, S., Chen, M., Al-Hosni, T., Madani, K. (2021). Water resources in arid lands: Management and sustainability. In 2nd International Conference on Water Resources in Arid Areas, Muscat, Oman. https://doi.org/10.1007/978-3-030-67028-3
[32] Ohaegbuchu, H.E., Anyadiegwu, F.C., Odoh, P.O., Orji, F.C. (2019). Review of top notch electrode arrays for geoelectrical resistivity surveys. Journal of the Nigerian Society of Physical Sciences, 1(4): 147-155. https://doi.org/10.46481/jnsps.2019.34
[33] Hussein, M.A., Ali, M.Y., Hussein, H.A. (2023). Groundwater investigation through electrical resistivity tomography in the Galhareri district, Galgaduud region, Somalia: Insights into hydrogeological properties. Water, 15(18): 3317. https://doi.org/10.3390/w15183317
[34] Dahlin, T., Zhou, B. (2004). A numerical comparison of 2D resistivity imaging with 10 electrode arrays. Geophysical Prospecting, 52(5): 379-398. https://doi.org/10.1111/j.1365-2478.2004.00423.x
[35] Ali, M.A.H., Mewafy, F.M., Qian, W., Faruwa, A.R., Shebl, A., Dabaa, S., Saleem, H.A. (2024). Numerical simulation of geophysical models to detect mining tailings’ leachates within tailing storage facilities. Water, 16(5): 753. https://doi.org/10.3390/w16050753
[36] Bienibuor, A.K., Preko, K., Aning, A.A., Menyeh, A., Wemegah, D.D., Appiah, M.K., Gyilbag, A. (2025). Application of the electrical resistivity tomography (ERT) method in identifying high groundwater potential sites in the Atebubu municipality of Ghana. Discover Geoscience, 3(1): 14. https://doi.org/10.1007/s44288-025-00120-x
[37] Asten, M.W., Hayashi, K. (2018). Application of the spatial auto-correlation method for shear-wave velocity studies using ambient noise. Surveys in Geophysics, 39(4): 633-659. https://doi.org/10.1007/s10712-018-9474-2
[38] Geometrics. (2009). SeisImager/SWTM manual windows software for analysis of surface waves. Geometrics, Inc., pp 1-314.
[39] Sun, Y.F., Peng, X.B., Bi, G. (2024). Study on SN curve and fatigue limit of drill pipe in offshore short-radius sidetracking process. Processes, 12(9): 1828. https://doi.org/10.3390/pr12091828
[40] Guan, Z., Chen, T., Liao, H., Guan, Z., Chen, T., Liao, H. (2021). Drilling fluids. In Theory and Technology of Drilling Engineering. Springer. Singapore, pp. 173-204. https://doi.org/10.1007/978-981-15-9327-7_3
[41] C09 Committee. (2004). Test method for materials finer than 75-m (No. 200) sieve in mineral aggregates by washing. ASTM International. https://doi.org/10.1520/C0117-04
[42] C09 Committee. (2015). Test method for sieve analysis of fine and coarse aggregates. ASTM International. https://doi.org/10.1520/C0136-06
[43] Kennedy, C. (2024). Estimation of dynamic soil properties for geotechnical analysis in the Niger Delta using index testing and empirical correlations. Discover Geoscience, 2(1): 1-30. https://doi.org/10.1007/s44288-024-00092-4
[44] Akin, M.K., Kramer, S.L., Topal, T. (2011). Empirical correlations of shear wave velocity (Vs) and penetration resistance (SPT-N) for different soils in an earthquake-prone area (Erbaa-Turkey). Engineering Geology, 119(1-2): 1-17. https://doi.org/10.1016/j.enggeo.2011.01.007
[45] Alvitez Campos, Luisin Guillermo. (2017). Análisis Comparativo Entre Las Normas Técnicas E.030 Diseño Sismorresistente 2016 Y La Norma Técnica E.030 Diseño Sismorresistente 2006. http://repositorio.udch.edu.pe/handle/UDCH/145.
[46] Advanced Geosciences. AGI EarthImagerTM 2D. https://www.agiusa.com/agi-earthimager-2d.
[47] Gunn, D.A., Chambers, J.E., Uhlemann, S., Wilkinson, P.B., et al. (2015). Moisture monitoring in clay embankments using electrical resistivity tomography. Construction and Building Materials, 92: 82-94. https://doi.org/10.1016/j.conbuildmat.2014.06.007
[48] Reynolds, J.M. (2011). An Introduction to Applied and Environmental Geophysics. John Wiley & Sons, USA, pp. 1-2.
[49] Sullivan, P.L., Zhang, C., Behm, M., Zhang, F., Macpherson, G.L. (2020). Toward a new conceptual model for groundwater flow in merokarst systems: Insights from multiple geophysical approaches. Hydrological Processes, 34(24): 4697-4711. https://doi.org/10.1002/hyp.13898
[50] Nassim, H., Atmane, L., Lamine, H., Mouloud, H., Anes, M. (2024). Integrated geotechnical and electrical resistivity tomography to map the lithological variability involved and breaking surface evolution in landslide context: A case study of the Targa Ouzemour (Béjaia). Water, 16(5): 682. https://doi.org/10.3390/w16050682
[51] Basri, K., Wahab, N., Talib, M.K.A., Zainorabidin, A. (2019). Sub-surface profiling using electrical resistivity tomography (ERT) with complement from peat sampler. Civil Engineering and Architecture, 7(6A): 7-18. https://doi.org/10.13189/cea.2019.071402
[52] Galazoulas, E.C., Mertzanides, Y.C., Petalas, C.P., Kargiotis, E.K. (2015). Large scale electrical resistivity tomography survey correlated to hydrogeological data for mapping groundwater salinization: A case study from a multilayered coastal aquifer in Rhodope, Northeastern Greece. Environmental Processes, 2: 19-35. https://doi.org/10.1007/s40710-015-0061-y
[53] Gonzales Amaya, A., Dahlin, T., Barmen, G., Rosberg, J.E. (2016). Electrical resistivity tomography and induced polarization for mapping the subsurface of alluvial fans: A case study in Punata (Bolivia). Geosciences, 6(4): 51. https://doi.org/10.3390/geosciences6040051
[54] Carrión-Mero, P., Morante-Carballo, F., Briones-Bitar, J., Jaya-Montalvo, M., Sánchez-Zambrano, E., Solórzano, J., Malavé-Hernández, J., Toala, F.J.M., Proaño, J., Flor-Pineda, Á., Espinel, R. (2024). Water quality from natural sources for sustainable agricultural development strategies: Galapagos, ecuador. Water, 16(11): 1516. https://doi.org/10.3390/w16111516
[55] Martínez, A. (2019). The drinking water process regulation in Ecuador. Historic evolution and current reality. Evolución históRica y Realidad Actual, 1: 31-54. https://doi.org/10.14198/Sostenibilidad2019.1.03
[56] Naylor, K.A. (2023). Blueprint for acceleration: Sustainable development goal 6 synthesis report on water and sanitation. United Nations. https://doi.org/10.18356/9789210026444
[57] Carrión-Mero, P., Olaya, P., Sanango-Ochoa, L., Cano-Alvarado, F., Bravo-Montero, L., Solórzano, J., Morante-Carballo, F. (2023). Hydrogeological characterization of a coastal area for the groundwater exploitation. Hondo River micro-watershed, Santa Elena Ecuador. International Journal of Sustainable Development and Planning, 18(2): 401-410. https://doi.org/10.18280/ijsdp.180208