Surjono*![]() | Erland Raziqin Fatahillah
| Erland Raziqin Fatahillah![]() | Abdul Wahid Hasyim
| Abdul Wahid Hasyim![]() | Mustika Anggraeni
| Mustika Anggraeni![]() | Aurellia Parasti Jasmine
| Aurellia Parasti Jasmine![]() | Andik Isdianto
| Andik Isdianto![]()
© 2025 The authors. This article is published by IIETA and is licensed under the CC BY 4.0 license (http://creativecommons.org/licenses/by/4.0/).
OPEN ACCESS
This study aims to understand the influence of spatial suitability and standard of living on the quality of life of residents in the riverside settlement of Kotalama, Malang City, in the context of sustainable urban planning. The methodology applied involves the use of Geographic Information System (GIS)-based overlay analysis to evaluate land use suitability, as well as the use of multiple linear regression analysis to examine the relationship between the standard of living variables and community-reported perceptions of quality of life. The results show that increasing distance from the river, improving housing quality, and increasing asset ownership are significantly associated with improved quality of life. These results emphasize the importance of integrating spatial suitability and socio-economic factors into urban planning policies to support sustainable development. The implications of this study are highly relevant to the achievement of SDG 11 which targets the creation of inclusive, safe, resilient, and sustainable cities and communities. This study proposes that urban planning policies should prioritize improving housing quality and providing better access to infrastructure to improve quality of life, while reducing the risk of natural disasters such as floods and landslides.
community well-being, disaster risk assessment, flood mitigation, gis mapping, housing standards, socioeconomic integration, sustainable urban planning, urban resilience
Current urban policy and scientific research analyze urban growth based on the interaction of urbanization (intensive land use, population density) and social inequality in the environment [1] and well-being [2]. Land use and population growth drive urban development, increasing housing demand [3], often imbalanced with the supply. In Indonesia, housing is one of three basic needs, i.e., clothing, food, and shelter [4], that precede other basic needs such as affection, safety, self-esteem, and other well-being indicators [5]. Housing serves as a shelter and a place to fulfil various life needs, including socialization and reinforcing community values [6]. These three basic needs precede other basic needs, such as affection, safety, self-esteem, and other well-being indicators [7]. However, there is a mismatch between supply and demand [8] that results in an unresolved housing backlog and limited access to affordable shelters for low-income groups.
In the context of settlement location, spatial planning regulation is central to urban policy discussions [9]. The Indonesian Housing and Settlement Act defines settlements as part of the ecosystem, encompassing living areas and activities supporting the community's welfare. However, disadvantageous communities with less choice of shelter often violate land-use planning by living in unrecommended areas. These disadvantageous community groups find and form settlements in slum and squatter areas near the activities of economic sectors and industrialization [10]. Even though they live in such a location, they try to adapt to disaster-prone conditions and develop non-physical aspects of community life, such as social and cultural interactions among residents [11]. This phenomenon is particularly apparent in many parts of the Malang City area [12, 13], where these settlements are mainly located on riverbanks or railroad buffer zones near the city centre and access to main roads [14].
In Kotalama Sub-District, the riverbanks are occupied by houses built without following existing spatial planning regulations [15], which designate riverbanks as green areas to prevent the risk of flooding, landslides, and water pollution. Violations of this regulation persist in Kotalama [16]. This condition risks the community and environment, reducing the riverbank zone's natural function [17]. Singh et al. [18] claimed that uncertainty about their quality of life in the new location caused residents' resistance. Many residents consider their current housing adequate [19] and already feel a strong emotional and social connection in their settlement [20]. This situation highlights the importance of considering individual perceptions of quality of life, which includes physical health, psychological well-being, environmental conditions, and social relationships [21]. Therefore, the quality of life of residents living in disaster-prone areas with inadequate infrastructure is significant [22].
This study was designed to examine the interaction between land use suitability, standard of living, and perceived quality of life among residents living along the Kotalama Riverbank (Brantas and Amprong Rivers), in Kotalama Sub-District. By applying Geographic Information Systems (GIS)-based overlay methods and multiple linear regression analysis, this study tests two main hypotheses: (1) proximity to the river negatively affects quality of life due to increased disaster risk; and (2) higher levels of standard of living positively contribute to improved quality of life.
The relevance of this study is based on a literature review that states the importance of integration between urban planning policies and the socio-economic needs of residents. The results of this study are expected to provide a basis for developing policies that support the SDGs, especially Goal 11 in realizing inclusive, safe, resilient, and sustainable cities.
Therefore, this study not only provides an important contribution to the local context in addressing riverside settlement issues, but also enriches the global dialogue on sustainable urban planning strategies. Through an innovative methodological approach, this study proposes a new perspective on the dynamics between spatial planning, standard of living, and quality of life, as well as the implications of these findings in formulating more effective and inclusive urban policies.
2.1 Study area
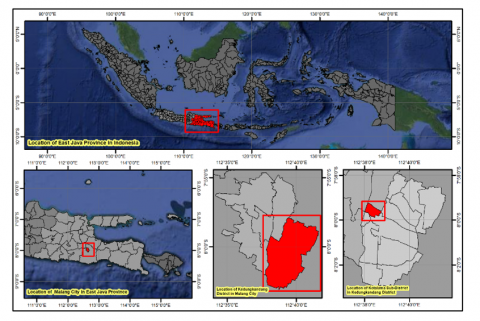
The study area for this research is Kotalama Sub-District, Kedungkandang District, Malang City, East Java Province, Indonesia (Figure 1), located in the southeastern part of the city. It comprises 11 RWs (neighbourhood groups) and 141 RTs (neighbourhood units).
Figure 1. Orientation of the administrative area of the study area in Kotalama Sub-District
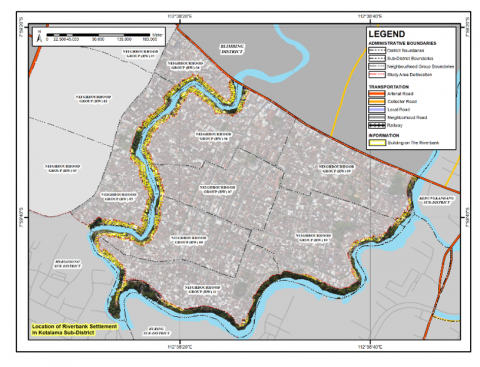
This area was selected based on its physical and administrative boundaries, focusing on the Brantas and Amprong Rivers. The riverbank boundaries are defined as 15 meters from both the left and right edges of the river channel, as outlined in the 2022-2042 Malang City Spatial Plan (RTRW) and the 2016-2036 Malang Southeast Urban Planning and Zoning Regulation (RDTR-PZ BWP). The delineated study area covers 10.5 hectares, encompassing 8 RWs, from RW 04 to RW 11 (Figure 2). This location is also characterized by dense informal settlements and high exposure to environmental hazards, making it a critical focus for spatial and socio-economic analysis.
Figure 2. The study area of riverbank settlement in Kotalama Sub-District
2.2 Data collection
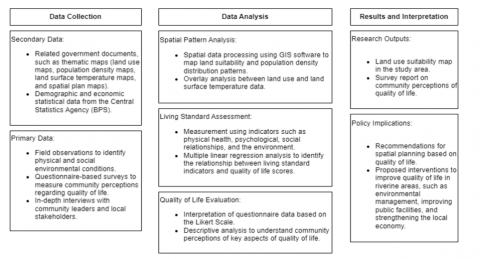
This study employed both secondary and primary data collection (Figure 3). A secondary survey at government institutions collected secondary data. The information obtained from these institutions includes the required spatial planning documents. Observation and distribution of questionnaires to respondents collected primary data. Observation obtained data on the alignment of spatial patterns, applying the Euclidean distance method, which calculated the distance between two objects based on the sum of the differences between those objects. The questionnaires for the respondents living on the riverbank of the Brantas and Amprong Rivers gathered data on the community's perceived living standards and quality of life.
Respondents were selected from 684 buildings located within 15 meters of the riverbanks in RW 04 to RW 11, areas identified as non-compliant with spatial planning regulations. Using Slovin’s formula with a 10% margin of error [23], a sample of 90 respondents was selected to proportionally represent each RW. The number of samples per RW was determined by dividing the number of non-compliant parcels in each RW by the total number of parcels across all RWs and then multiplying by the total sample size. The questionnaire gathered data on community perceptions of living standards and quality of life.
While this proportional method ensured representational balance, the use of purposive sampling may have introduced potential response bias, especially concerning self-reported quality-of-life data. This bias could stem from individual subjectivity or social desirability effects. Future studies are encouraged to adopt stratified sampling techniques based on socioeconomic classifications to capture more nuanced variations in quality of life experiences across different community groups.
Figure 3. Research framework
2.3 Spatial patterns (land-use) analysis
Urban land use is a complex process involving interactions of various factors, including natural or biophysical conditions, socioeconomic elements, infrastructure, accessibility, spatial planning policies, and environmental concerns [24]. The assessment measures how appropriate a specific land area is for a particular use [25]. Land-use suitability is affected by proximity to essential human needs (Table 1). The closeness of resident's houses to these driving factors can significantly influence land use decisions [26]. Accessibility to the river is not included in this study, as residents do not rely on rivers as a source of clean water.
Relevant spatial planning documents of Malang City determine a 15 meter buffer zone along riverbanks for environmental and risk prevention concerns. This requirement reduces the spatial suitability value as the proximity of buildings to rivers increases [27]. The following Table 1 explains the spatial suitability of each component indicator, providing a comprehensive view of each aspect. Based on frequency distribution for each class interval, the assessment uses a scale of 1 (very low) to 5 (very high), from low to high suitability.
The spatial suitability analysis was conducted using a GIS-based overlay method, incorporating five spatial indicators: proximity to riverbanks, arterial roads, government centres, commercial centres, and healthcare facilities. These variables were each assigned equal weight due to their shared importance in determining urban spatial functionality and accessibility.
Table 1. Description of spatial patterns suitability indicator
|
No. |
Variable |
Suitability Criteria |
Legal Basis and References |
|
1 |
Distance to River |
The closer to the riverbank, the lower the suitability score due to increased disaster risk. |
Minister of Public Works and Housing of the Republic of Indonesia Regulation No. 28/PRT/M/2015 (Minimum riverbank distance of 3 meters in urban areas) [17, 28]. |
|
2 |
Distance to Arterial Road |
The closer to arterial roads, the higher the suitability score due to improved accessibility. |
Law of the Republic of Indonesia No. 2 of 2022 on Roads (Arterial roads serve as major transportation routes) [29, 30]. |
|
3 |
Distance to Government Center |
The closer to government centres, the higher the suitability score as it facilitates access to services. |
Indonesian National Standard (SNI) 03-1733-2004 (Provision of government centres considers service radius coverage) [31]. |
|
4 |
Distance to Commercial Center |
The closer to commercial centres, the higher the suitability score as it supports social interaction. |
SNI 03-1733-2004 (Provision of commercial centres considers service radius for residents) [31, 32]. |
|
5 |
Distance to Healthcare Facility |
The closer to healthcare facilities, the higher the score for access to health services. |
SNI 03-1733-2004 (Provision of healthcare facilities with a minimum radius of 1 km for health posts, 1.5 km for auxiliary health centres, and 3 km for community health centres) [31, 33]. |
2.4 Living standards assessments
Living standards refer to the level of living considered as the minimum required to meet basic human needs and reflect the daily life patterns of society [34]. Sabina Alkire and Maria Emma Santos introduced the theory of living standards by publishing the Multidimensional Poverty Index (MPI) [35]. This publication identified three dimensions: health, education, and living standards [36]. In 2018, the SDGs [37] revised the living standards indicator within the MPI. Table 2 explains the living standards for each component indicator to provide a comprehensive view of its aspects. A scoring system of 1 (very bad) to 5 (very good) for each criterion fulfilment indicates the level of compliance from non-compliance to full compliance.
Table 2. Living standards indicators
|
No. |
Variable |
Criteria for Meeting Standards |
Legal Basis and References |
|
1 |
Cooking Fuel |
Acceptable cooking fuel types comprise 3kg LPG, 12kg LPG, natural gas, or electric power (induction). |
Minister of Energy and Mineral Resources of the Republic of Indonesia Regulation No. 28/2021 [38, 39]. |
|
2 |
Sanitation |
It has independent sanitation facilities (not shared) and uses septic tanks, soak pits, or piping systems. |
SNI 03-1733-2004 (Wastewater volume) [31]; Minister of Public Works and Housing of the Republic of Indonesia Regulation No. 29/PRT/M/2018 [40]. |
|
3 |
Drinking Water |
Has access to clean drinking water from wells, drilled wells, HIPPAM (Association of Drinking Water Users), or PDAM (Municipal Waterworks) within a 30-minute walk. |
Minister of Public Works of the Republic of Indonesia Regulation No. 18/PRT/M/2007 [41]; Minister of Public Works and Housing of the Republic of Indonesia Regulation No. 29/PRT/M/2018 [40]. |
|
4 |
Electricity |
Has access to electricity with a minimum power of 450 watts, increased to 900 watts, 1300 watts, or renewable energy. |
Minister of Housing and Urban Development of the Republic of Indonesia Regulation No. 22/Permen/M/2008 [42]; Presidential of the Republic of Indonesia Regulation No. 112/2022 [43]. |
|
5 |
Housing |
Housing materials comprise floors (vinyl, ceramic), roofs (zinc, asbestos, tiles), and walls (brick, concrete blocks). |
[44, 45]. |
|
6 |
Assets |
Asset ownership (at least one) comprises radio, TV, telephone, computer, motorcycle, or refrigerator. |
Types of Assets Included in the Non-Building Tangible Assets Group for Depreciation Purposes in the Regulation of the Minister of Finance of the Republic of Indonesia Number 96/PMK.03/2009 [46]. |
2.5 Quality of life evaluation
According to the World Health Organization (WHO), quality of life is the subjective assessment of an individual's position in life, influenced by cultural contexts and the values surrounding them. This assessment includes their perspectives on life goals, expectations, standards, and concerns [47]. Physical health, psychological conditions, levels of independence, social relationships, personal beliefs, and environmental interactions all influence quality of life. While often referred to as well-being [48], quality of life is more closely associated with an individual's subjective evaluation of their life, whereas well-being refers to the objective conditions of life that apply to populations in general. Quality of life or well-being consists of subjective components, including personal assessments using scales such as satisfaction or happiness, and objective components, which others can measure. The indicators below describes the quality of life in society across each element and dimension.
2.5.1 Physical health dimension
2.5.2 Psychological dimension
2.5.3 Social relationships dimension
2.5.4 Environment dimension
2.5.5 Assessment calculation
Quality of life assessment in this study was carried out using the WHOQOL-BREF, which produces four domain scores. These domain scores are scaled using a Likert scale of 1 (very bad) to 5 (very good) in a positive direction (i.e., higher scores indicate better quality of life). The calculation of the domain score used the average score for each item within a domain. The average score is then multiplied by 4 to align with the scores used in the WHOQOL-100 and subsequently converted to a 0-100 scale. The WHOQOL-100 guidelines [61] outlined the method for calculating the total score from individual questionnaires and the transformation of scores (Table 3) [47].
The calculation of the mean score used the results from the four domains, providing the data for assessing the community's quality of life. The Human Development Index (HDI) approach from the Statistics Central Body (BPS of Indonesia) interpreted the quality of life level, which classifies the assessment into four levels: poor (score < 60), moderate (60 ≤ score < 70), good (70 ≤ score < 80), and very good (score ≥ 80). The interval data presented the quality of life of the respondents.
Table 3. Quality of life assessment calculation
|
|
Calculation of Scores for Each Domain |
Questionnaire Result Score |
Transformation Score |
|
Physical Health |
1.1 + 1.2 + 1.3 + 1.4 + 1.5 + 1.6 + 1.7 |
= |
|
|
Psychological |
2.1 + 2.2 + 2.3 + 2.4 + 2.5 + 2.6 |
= |
|
|
Social Relationships |
3.1 + 3.2 + 3.3 |
= |
|
|
Environment |
4.1 + 4.2 + 4.3 + 4.4 + 4.5 + 4.6 + 4.7 + 4.8 |
= |
|
2.6 Relationship between spatial patterns suitability, living standards, and quality of life
Multiple linear regression analysis was selected in this study due to its suitability for assessing the direct relationships between independent variables and a single dependent variable (quality of life). Although structural equation modeling (SEM) could provide a more complex analysis of socio-environmental interactions, it typically requires a larger sample size and more intricate latent variable structures. Given the relatively modest sample size (n=90) and the study's focus on observable, measurable indicators, multiple linear regression offered a more parsimonious and statistically robust approach for this research context.
This regression analysis involves one or more independent variables and one dependent variable. Linear regression aims to model the linear relationship between the dependent and related independent variables. This analysis describes the relationship between variables with interval and ratio scales. The process involves constructing a linear equation that represents the relationship between two variables, known as the regression line. This line reflects the relationship between the two variables and illustrates the general pattern of the dependent variable (Y) concerning the independent or explanatory variable (X). In multiple linear regression, additional independent variables (X1, X2, ..., Xn) help accurately explain or predict the dependent variable (Y). The formula for multiple linear regression is as follows:
$\mathrm{Y}=a+b_1 X_1+b_2 X_2+b_n X_n$ (1)
Information:
Y = QoL (Dependent variable value prediction)
a = Constant term
b1 to bn = First to nth regression coefficients
X1 to Xn = First to nth independent variable coefficient
This analysis shows the extent of influence each variable has. Table 4 shows the research variables, which are analyzed using SPSS.
Table 4. Research variables
|
Variable |
Indicator |
|
Quality of Life (Yqol) |
Total score for physical health, psychological health, social relationships, and environment |
|
Distance to River (Xsp1) |
Distance (meters) between the building and the riverbank |
|
Distance to Arterial Road (Xsp2) |
Distance (meters) between the building and the national road |
|
Distance to Government Center (Xsp3) |
Distance (meters) between the building and the sub-district office |
|
Distance to Commercial Center (Xsp4) |
Distance (meters) between the building and the central market |
|
Distance to Health Facility (Xsp5) |
Distance (meters) between the building and the health centre |
|
Cooking Fuel (Xls1) |
Type of cooking fuel used |
|
Sanitation Condition (Xls2) |
Ownership of sanitation facilities per building |
|
Drinking Water (Xls3) |
Availability of drinking water access |
|
Electricity (Xls4) |
Availability of electricity access |
|
Housing Quality (Xls5) |
Material/components of floor, roof, and walls |
|
Asset ownership (Xls6) |
Information asset ownership, mobilization, and support system |
In this study, the output of this analysis will help understand how the alignment of the spatial patterns to land use regulation and the living standards influence the quality of life of the riverbank settlement. The analysis identifies the most influential factors related to spatial patterns and living standards in the study area. Based on the sample size with a desired margin of error of 10% and an accuracy level of 90%, the confidence level indicates that the interval contains valid parameter values. The accuracy level shows how close the predictions are to the actual values.
3.1 Spatial patterns suitability of Kotalama Riverbank Settlements, Malang City, Indonesia
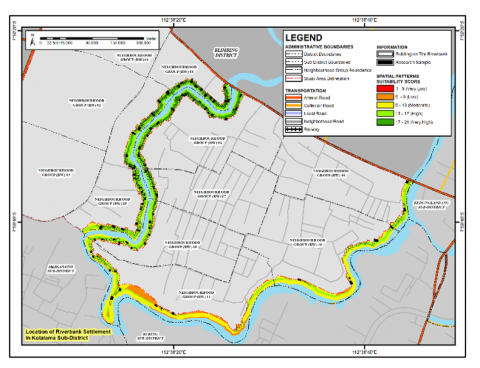
The "intersect" tool in GIS conducted an overlay analysis, integrating five key factors: proximity to the river, arterial roads, government centres, commercial centres, and health facilities. The study showed (Figure 4) that areas with lower suitability scores, indicating spatial mismatch, were mainly concentrated in RW 10 and RW 11 due to their distance from critical services such as government offices, commercial areas, and health facilities. The analysis also revealed that settlements directly adjacent to the riverbank exhibited lower spatial suitability than those further inland.
The formal spatial plan designed the riverbank area in Kotalama for various land uses, including constructing inspection roads and flood control infrastructure. However, the existing land use data revealed inconsistencies, as conversion into built areas occurred in some protected area zones. Specifically, 2.9 hectares (27.6%) of the land area diverges from the designated land use plan. This result suggests a gap in the implementation of spatial planning.
Figure 4. Spatial patterns suitability of riverbank settlement in Kotalama Sub-District map
Note: The spatial suitability scores range from 1 to 5, where 1 indicates very low suitability and 5 indicates very high suitability for residential development.
The spatial suitability scores are classified on a scale of 1 to 5, with 1 representing areas of very low residential suitability and 5 representing areas of very high residential suitability based on the weighted overlay analysis. The overlay analysis combined five factors using the Euclidean Distance tool in ArcGIS, which generated scores based on distances from buildings to critical features like the river, arterial roads, government offices, commercial centres, and health facilities. The results were categorized into five intervals ranging from 1 (very low) to 5 (very high), with the following factors analyzed:
This analysis, which combines geographic proximity to critical infrastructure with land use suitability, provides valuable insights into the spatial suitability and living standards in the Kotalama Riverbank Settlements. The findings highlight areas of concern, particularly regarding accessibility to health services and flood risks, while emphasizing the positive impacts of good connectivity to government and commercial centres on the local economy and governance.
3.2 Living standards of Kotalama Riverbank Settlements, Malang City, Indonesia
Living standards in Kotalama reveal critical aspects of daily life and the fulfilment of basic needs for the community around the Kotalama Riverbanks (Figure 5). Data indicate that most residents use LPG for cooking, with a small percentage utilizing natural gas in certain areas (RW 04). Sanitation infrastructure is mostly in place, with the majority having individual septic tanks, though a small portion relies on communal facilities. Access to drinking water is well-provided by the Local Water Enterprise (PDAM) network, and electricity is available in all households, with 80% using 450 watts and 20% using 900 watts.
Figure 5. Distribution of living standards assessments
Housing quality varies, with most homes having ceramic tile floors and tile roofs. However, some houses still use less suitable materials, such as having no flooring material and using zinc for roofing. All homes have brick walls, yet some do not have reinforced concrete frames.
Asset ownership is diverse, with most households having essential communication and transportation tools. These discrepancies suggest that most of the respondents have met their basic needs. However, access to resources and the safety of house construction need to improve. Addressing these issues would support community welfare, especially for those living along the Brantas and Amprong Riverbanks.
3.3 Quality of life of Kotalama Riverbank Settlements, Malang City, Indonesia
The findings of the community's perception revealed that residents living along the riverbank generally exhibit a good quality of life (Figure 6). Among all RWs, physical health and environmental dimensions were notably low.
Figure 6. Quality of life of riverbank settlement in Kotalama Sub-District map
The lowest scores in RW 04 and RW 09 were attributed to their proximity to major arterial roads. These neighbourhoods scored particularly low in environmental factors, indicating that although accessibility to services and facilities is high, the physical environment does not adequately support the quality of life. Notably, some houses do not meet housing standard criteria. Moreover, the poorly maintained environmental conditions could increase perceived risks to residents' safety and well-being. On the other hand, RW 07, RW 10, and RW 11 had the highest scores, attributed to their location in the central residential zones of Kotalama. These areas were firm in the social dimension, with an average length of residence exceeding 35 years. This finding shows that residents in these neighbourhoods experienced social bonding with strong emotional support from family and neighbours. The long-term commitment to these neighbourhoods likely fosters a sense of community and belonging, positively influencing individual happiness and overall quality of life.
The survey results indicated that most indicators fall within the "good" to "very good" categories. However, areas such as recreational opportunities, mobility, and management of discomfort and pain require further attention (Figure 7). Addressing these aspects would likely contribute to a further improvement in the quality of life for residents of Kotalama.
Figure 7. Distribution of community's quality of life evaluation
Improving these factors through targeted interventions, such as enhancing public spaces and accessibility, could provide a more sustainable solution than large-scale displacement. The findings of the quality of life analysis provide valuable insights that if the residents' quality of life is the ultimate objective of the development, then it can be suggested that relocation, as recommended by the Ministry of Housing and Public Works of The Republic of Indonesia Regulation No 2 of 2016 [62], is unnecessary.
3.4 Linear regression analysis
This study assesses how factors related to spatial conformity and living standards influence the quality of life. The analysis includes the following tests: the coefficient of determination, F-test (ANOVA), and T-test, to validate the extent and significance of these relationships.
3.4.1 Coefficient of determination (R Square)
This test determines how much the independent variables collectively explain the variance in the quality of life. Table 5 summarises the result.
The study's adjusted R-squared value of 0.442 indicates that spatial and socioeconomic factors collectively explain 44% of the variation in quality of life, while 56% is due to other variables. Key factors significantly affecting quality of life include proximity to the river, house quality, and asset ownership. Proximity to the river negatively impacts the quality of life, while improved house quality and asset ownership positively impact the quality of life.
Table 5. Model summary
|
R |
R Square |
Adjusted R Square |
Std. Error of the Estimate |
Durbin- Watson |
|
0.665 |
0.442 |
0.371 |
192.519 |
2.292 |
3.4.2 F-test (ANOVA)
The F-test assesses the joint significance of all independent variables in predicting quality of life. Table 6 shows the results:
Table 6. Anova test
|
Model |
Sum of Squares |
df |
|
Mean Square |
F |
Sig. |
|
Regression |
231.697 |
|
10 |
23.170 |
6.251 |
0.000 |
|
Residual |
292.803 |
|
79 |
3.706 |
|
|
|
Total |
524.500 |
|
89 |
|
|
|
With a significance value of p < 0.05 (0.000), the test indicates that the independent variables collectively significantly affect the quality of life. This result implies that spatial conformity and living standards contribute meaningfully to predicting quality of life.
3.4.3 T-test for individual variables
The T-test assesses the significance of each independent variable individually. Table 7 provides details on coefficients, significance levels, and multicollinearity diagnostics.
An F-test result of 0.000 confirms that the model's independent variables significantly impact the quality of life when assessed simultaneously. However, in the T-test, only proximity to the river, home quality, and asset ownership have a statistically significant partial impact on quality of life. Distance to river, housing quality, and asset ownership contribute significantly (p < 0.05) to quality of life. Positive coefficients for these variables suggest that greater values (e.g., increased distance from the river) correlate with higher quality of life, potentially due to reduced flood risk or discomfort from close river proximity. This finding aligns with previous studies emphasizing the negative externalities of riverbank settlements, particularly in terms of environmental and health risks. Besides, variables such as distance to arterial roads, distance to government centres, and electricity show no statistically significant relationship with the community's quality of life in the study area. This is understandable because the distance between the settlement, arterial roads, and government centres is relatively the same. Electricity is not a significant variable since all community houses are connected to an electricity power network. Each house also has its own sanitation.
Table 7. Coefficients
|
Variable |
B (Unstan-Dardized Coeff.) |
Std. Error |
t |
Sig. |
|
Constant |
64.754 |
4.329 |
14.959 |
0.000 |
|
Distance to river (Xsp1) |
0.047 |
0.007 |
6.400 |
0.000 |
|
Distance to an arterial road (Xsp2) |
-0.023 |
0.018 |
-1.274 |
0.206 |
|
Distance to government offices (Xsp3) |
-0.005 |
0.017 |
-0.312 |
0.756 |
|
Distance to trade centre (Xsp4) |
0.025 |
0.017 |
1.536 |
0.129 |
|
Distance to health facilities (Xsp5) |
0.027 |
0.021 |
1.337 |
0.185 |
|
Cooking fuel type (Xls1) |
0.000 |
0.042 |
-0.009 |
0.992 |
|
Sanitation condition (Xls2) |
0.023 |
0.037 |
0.616 |
0.540 |
|
Electricity (Xls4) |
-0.030 |
0.023 |
-1.278 |
0.205 |
|
Housing quality (Xls5) |
0.028 |
0.009 |
3.228 |
0.002 |
|
Asset ownership (Xls6) |
0.015 |
0.007 |
2.132 |
0.036 |
Regression coefficients indicate that a 1-unit increase in proximity to the river, home quality, or asset ownership leads to proportional changes in quality of life. Diagnostic tests confirm the model's assumptions of normality, absence of multicollinearity, and homoscedasticity. Model validation through a simulation reveals an average deviation of 4.32%, suggesting the regression model is a reliable predictor of quality of life.
3.4.4 Uniform service provision and its impact on variable significance
The variable reduction process identifies three significant variables from the initial eleven hypothesized variables. This was achieved through T-tests, which revealed that only variables distance to river, housing quality, and asset ownership had a statistically significant relationship with the dependent variable.
Meanwhile, other variables are insignificant because they can be caused by the following things based on field observations. The variable "distance" was found to have negligible variation within clusters, with differences of only several meters, which is considered practically insignificant in this context. Similarly, access-related variables were excluded as they demonstrated uniformity across the study area, reflecting consistent resource accessibility. These findings underscore the importance of focusing on variables with distinct impacts while recognizing the role of local conditions in shaping the results. The implications of this reduction highlight the need for tailored interventions that address the most influential factors, particularly in areas where homogeneity minimizes the effect of other variables.
Due to their uniformity across the study area, the regression analysis model did not include other variables, such as cooking fuel type, sanitation condition, and electricity. In terms of cooking fuel, all households utilize 3kg LPG gas cylinders, as the Indonesian government mandates, to support low-income families with subsidized gas. This ensures equal access to adequate cooking fuel for all residents, eliminating any significant variability or gap. Similarly, sanitation conditions were consistent, with all households using private septic tanks that meet standard requirements, indicating uniformly acceptable sanitation across the population. Every household is connected to the State-Owned Electricity Network (PLN of Indonesia) for electricity, fulfilling the government’s goal of providing affordable and reliable electricity access to low-income communities. This widespread availability leaves no discernible differences among the households in these variables.
On the other side, the variable of drinking water was also excluded from the regression analysis due to uniform access provided by the Regional Water Supply Company (PDAM of Indonesia). All households in the study area are connected to the PDAM network, ensuring an adequate and equitable clean water supply. This achievement aligns with the PDAM's objective to expand service accessibility, particularly for low-income populations. As a result, no significant gaps or differences in drinking water access were observed across the study area, further supporting its exclusion as a variable in the analysis.
The statistical insignificance of variables can be attributed to the limited variability in these conditions across the surveyed population. Since nearly all respondents had consistent access to these basic services, such as the existence of electricity and sanitation networks that have been connected and owned by every existing house, their influence on variations in perceived quality of life could not be effectively captured by the regression model. Nevertheless, the uniform provision of such basic utilities remains crucial for supporting overall living standards, even if their effect is not statistically distinguishable in this particular study context.
3.4.5 Model validation: Normality and homoscedasticity diagnostics
The regression model's validity and assumptions were assessed using graphical diagnostic tools, focusing on normality and homoscedasticity of residuals (Figure 8).
Figure 8. Normal P-P plot and scatterplot of regression
The Normal P-P Plot of Regression Standardized Residuals illustrates the distribution of residuals relative to the expected normal distribution. The points closely follow the diagonal line, with minor deviations, indicating that the residuals approximate a normal distribution. This supports the assumption of normality, which is critical for the reliability of statistical inferences in regression analysis.
The Scatterplot of Regression Standardized Residuals vs Predicted Values evaluates homoscedasticity or the constancy of residual variance across predicted values. The residuals appear randomly scattered around the horizontal axis (zero) without any discernible pattern. This randomness suggests that the assumption of homoscedasticity is satisfied, meaning that the variance of errors remains consistent regardless of the level of predicted values.
Together, these diagnostic results confirm that the regression model satisfies the key assumptions of normality and homoscedasticity, ensuring the robustness of the conclusions drawn from the analysis. This validates the model's ability to reliably capture the relationship between spatial conformity, living standards, and community quality of life.
3.4.6 Regression model
The regression model developed in this study aims to measure the influence of spatial conformity and living standards, such as housing quality and asset ownership, on community quality of life. The resulting linear regression model is as follows:
$\begin{gathered}Y \mathrm{qol}=63.574+0.047 X \mathrm{sp}_1+0.028 X \mathrm{ls}_5+0.015 X \mathrm{ls}_6\end{gathered}$ (2)
Interpretation of the Regression Model:
This regression model shows that spatial conformity and living standards regarding housing quality and asset ownership positively influence community quality of life. This finding conforms to the quality of life assessment at the previous processes, i.e., the community’s quality of life is at least in the "moderate" category, even if all independent variables’ scores are minimum. This finding is also interesting since the community perceives their quality of life as being ‘good’ to ‘very good’, although common perception considers their quality of life deprived.
3.5 Strategizing for urban resilience
Based on the regression analysis, strategizing for urban resilience can be developed to support Sustainable Policy Planning, aligning with the SDG 11: “Make cities and human settlements inclusive, safe, resilient, and sustainable.” The analysis indicates that enhancing spatial suitability and living standards, specifically through housing quality and asset ownership, positively impacts the quality of life. Therefore, policy planning should prioritize urban design and housing improvements that promote safe, accessible, and environmentally harmonious living spaces [63].
First, policymakers should strengthen zoning regulations to protect rivers and prevent urban sprawl [64]. Integrating green spaces and enhancing river accessibility can promote urban resilience, foster community well-being, and contribute to climate adaptation efforts, meeting SDG 11 targets for inclusive and sustainable urbanization [65].
Second, investment in housing quality is crucial. governments must invest in energy-efficient, disaster-resilient housing accessible to diverse socioeconomic groups [66]. Incentives for retrofitting older homes with sustainable materials and energy-efficient systems would support low-income families, improve public health, and reduce urban energy demands [67].
Third, enhancing asset ownership opportunities for low-income households can provide economic stability and promote social inclusion [68]. Asset-building programs, including homeownership grants and access to microfinance, can help families accumulate wealth, reduce inequality, and contribute to urban stability [69].
These policy recommendations are consistent with SDG 11, focusing on sustainable urban development that addresses urban life's economic, social, and environmental dimensions. Collectively, these initiatives can create more livable, resilient, and equitable cities, fostering a higher quality of life and supporting the broader SDGs.
This study finds that housing quality and asset ownership significantly influence quality of life, aligning with previous research on urban poverty and spatial planning. However, recent global studies emphasize the critical role of social capital and community cohesion in enhancing urban resilience and well-being. Research in Ho Chi Minh City, Vietnam, highlights how bridging and bonding social capital improve community problem-solving and resource access [70]. Similarly, Chen et al. [71] demonstrate that social cohesion and collective efficacy in Nanjing, China, significantly enhance resilience in flood-prone areas. Baldwin and King [72] based on case studies from 14 countries, argue that strong social networks often outweigh physical infrastructure in sustaining community resilience. In Bandung City, Indonesia, Setiawan and Ningtyas [73] found that while green spaces and housing conditions matter, robust social networks are pivotal in promoting community development and enhancing quality of life.
Beyond these findings, broader research on housing and quality of life reveals complex relationships between various physical and social factors. Housing quality and asset ownership significantly influence quality of life, particularly in riverbank settlements prone to flooding and lacking infrastructure [74]. Social capital also plays a role, with studies in Delhi and Tehran showing strong correlations between social capital indicators and quality of life, although the specific predictors vary between cities [75]. Housing affordability is closely linked to quality of life, with better affordability associated with higher quality education, healthcare, and stability [76]. The importance of cultural diversity, environmental conservation, and alternative building techniques in housing and urban design is also highlighted [77].
These findings underscore the multifaceted nature of quality of life in urban settings, emphasizing the need for comprehensive approaches to housing and community development that consider both physical and social factors. These differences suggest that although improvements in housing quality and asset ownership are essential, integrating strategies to strengthen social cohesion could provide a more comprehensive approach to improving quality of life and resilience in riverside settlements.
3.6 Policy context in integrating research findings into urban planning
This study provides important insights into the relationship between spatial suitability, living standards, and quality of life, which can be integrated into existing urban planning policies. By leveraging these findings, planning policies can be developed to focus not only on economic growth but also on the sustainability and resilience of urban communities.
3.6.1 Integration into urban spatial plans
The recommendations from this study should be considered as a critical component in developing or revising urban spatial plans. This integration covers several key aspects:
3.6.2 Financing policies
Advocating for specific budget allocations to support these policies is a vital step. Some financing strategies that can be adopted include:
By integrating the research recommendations into effective spatial planning and budget allocation, city governments worldwide can develop policies that not only support economic growth but also improve the quality of life, resilience, and sustainability of the urban environment. This approach will ensure that urban development is harmonious and inclusive, providing long-term benefits for the entire community. Such policies could serve as a model for global urban development strategies, encouraging cities around the world to adopt similar measures that prioritize sustainable and inclusive growth. This global perspective reinforces the relevance of our findings and demonstrates their applicability in diverse urban settings, thereby broadening the impact and significance of our study.
This study has examined the interaction between spatial suitability, standard of living, and quality of life in the riverside settlement of Kotalama, Malang City. Through linear regression analysis conducted, it was found that distance from the river, housing quality, and asset ownership have a significant positive relationship to improving quality of life. Specifically, the developed regression model shows that each unit increase in distance from the river (Xsp1) increases the quality of life score (Yqol) by 0.047 points, while improvements in housing quality (Xls5) and asset ownership (Xls6) increase the score by 0.028 and 0.015 points respectively.
These results underscore the importance of spatial planning that takes into account socio-economic and environmental factors to improve quality of life. The implementation of policy recommendations based on the results of this study supports the achievement of SDG 11, which focuses on building inclusive, safe, resilient, and sustainable cities and communities. Furthermore, this study highlights the importance of paying attention to environmental sustainability and resilience in dealing with natural risks such as floods and erosion.
However, there are limitations to this study including the limited geographic coverage and the potential for local variability not to be fully captured. Further research is needed to verify these findings in other locations and using methodologies that can integrate more environmental and social variables.
Future research directions could involve the development of more complex predictive models to assess the impact of urban planning policies on quality of life, including broader socioeconomic factors. This is important to provide a stronger basis for policymakers in designing effective and sustainable interventions.
This conclusion not only summarizes the results of the study but also highlights the practical applications of the findings in the broader context of urban planning. By addressing the limitations and suggestions for future research, this study makes an important contribution to the literature on sustainable urban planning and offers new insights for improving urban planning practices that support the SDG goals.
While this study provides valuable insights into the influence of spatial suitability and living standards on quality of life in riverbank settlements, certain limitations must be acknowledged. The research focused primarily on physical and economic variables, with limited incorporation of social dimensions such as community resilience and land tenure security. These factors are recognized as critical in shaping long-term urban sustainability and social well-being, particularly in informal or marginalized settlements. Future studies should integrate measures of community resilience, collective action capacity, and security of land tenure to develop a more comprehensive understanding of the dynamics influencing quality of life in similar urban contexts.
We want to thank all parties who have contributed to the preparation of this research. We want to thank Brawijaya University for supporting the implementation of this research project by providing financial grant support so that we can participate in Research Funding for Professors in 2024 (Grant No.: 16/UN10.F07/PN/2024).
[1] Uddin, B., Alhrabi, A., Wahid, J. (2023). Impacts of urban growth policy on loss of identity in expanding saudi cities: A case study of buraydah. International Journal of Sustainable Development and Planning, 18(10): 2975-2987. https://doi.org/10.18280/ijsdp.181001
[2] Lai, L., Zhang, S., Li, L., Zhu, D. (2024). Effects of human inequality and urbanization on ecological well-being performance: A system-gmm analysis. Heliyon, 10(13): e34040. https://doi.org/10.1016/j.heliyon.2024.e34040
[3] Turok, I., Scheba, A., Visagie, J. (2023). Rethinking urbanization and economic development: A synopsis. Environment and Urbanization, 35(2): 297-309. https://doi.org/10.1177/09562478231193829
[4] Ariyanto, E., Nugraha, M.K.R. (2024). Population vs. poverty level in the future in Indonesia: Holt’s linear trend method. International Journal of Sustainable Development and Planning, 19(7): 2763-2770. https://doi.org/10.18280/ijsdp.190733
[5] Martela, F. (2024). Being as having, loving, and doing: A theory of human well-being. Personality and Social Psychology Review, 28(4): 372-397. https://doi.org/10.1177/10888683241263634
[6] Usman, F., Wardhani, J.K., Sari, I.C., Chalim, S. (2023). Assessing trauma healing methods for volcanic disaster evacuees in Indonesia. Journal Européen Des Systèmes Automatisés, 56(6): 1019-1025. https://doi.org/10.18280/jesa.560612
[7] Kenrick, D.T., Griskevicius, V., Neuberg, S.L., Schaller, M. (2010). Renovating the pyramid of needs. Perspectives on Psychological Science, 5(3): 292-314. https://doi.org/10.1177/1745691610369469
[8] González-García, A., Palomo, I., González, J.A., López, C.A., Montes, C. (2020). Quantifying spatial supply-demand mismatches in ecosystem services provides insights for land-use planning. Land Use Policy, 94: 104493. https://doi.org/10.1016/j.landusepol.2020.104493
[9] Jones, P. (2017). Formalizing the informal: Understanding the position of informal settlements and slums in sustainable urbanization policies and strategies in Bandung, Indonesia. Sustainability, 9(8): 1436. https://doi.org/10.3390/su9081436
[10] Sushanti, I.R., Setijanti, P., Septanti, D. (2022). Economic activities in urban settlement public spaces: Behavior as an identity. Journal of Architecture & Environment, 21(2): 87-110. https://doi.org/10.12962/j2355262x.v21i2.a13582
[11] Fadjarajani, S., Zid, M., Shaari, M.Z., Meylani, V. (2023). Urban spatial management strategy: Transforming slums into tourist attractions in Bantarsari Bungursari village, Tasikmalaya district. International Journal of Sustainable Development and Planning, 18(11): 3459-3465. https://doi.org/10.18280/ijsdp.181111
[12] Isdianto, A., Hasyim, A.W., Sukojo, B.M., Alimuddin, I., Anggraini, I.A., Fatahillah, E.R. (2025). Integrating urban design with natural dynamics: Enhancing ecological resilience in Malang city over a decade. International Journal of Sustainable Development and Planning, 20(3): 1061-1075. https://doi.org/10.18280/ijsdp.200313
[13] Permana, M., Sitorus, S.R.P., Darmawan, D. (2021). Analysis of land use changes and their predictions using Markov-cellular automata in the peri-urban area of Malang City. Tataloka, 23(3): 307-319. https://doi.org/10.14710/tataloka.23.3.307-319
[14] Rofii, I. (2021). Land use change model in the peri-urban area of Malang city. Indonesian Journal of Spatial Planning, 2(1): 28. https://doi.org/10.26623/ijsp.v2i1.3153
[15] Widyarthara, A., Afdholy, A.R., Yuniar, A. (2023). Studying the effect of tourism revitalization program: Sustainable upgrading slums settlements of Malang, Indonesia. Paragraphs Environmental Design, 2023: 75-82. https://doi.org/10.59260/penvid.2023.75820923
[16] Cahyani, D., Widaningsih, L. (2019). Identification of the marginalized urban communities characteristics and preferences. KnE Social Sciences, 3(21): 178-192. https://doi.org/10.18502/kss.v3i21.4967
[17] Surjono, S., Zanuar, P., Rizqi, A. (2022). Cross-border strategies to respond the impact of climate change in the upstream Brantas watershed, Indonesia. Environment, Development and Sustainability, 24(12): 14393-14420. https://doi.org/10.1007/s10668-021-02000-z
[18] Singh, R., Tiwari, A.K., Singh, G.S. (2021). Managing riparian zones for river health improvement: An integrated approach. Landscape and Ecological Engineering, 17(2): 195-223. https://doi.org/10.1007/s11355-020-00436-5
[19] Akinola, A.O., Ibem, E.O., Opoko, A.P., Adekunle, E.O., Ene, V.O. (2024). Satisfaction with neighbourhood physical environment of the government staff housing schemes in Lagos state, Nigeria. International Journal of Sustainable Development and Planning, 19(11): 4441-4452. https://doi.org/10.18280/ijsdp.191131
[20] Ilovan, O., Markuszewska, I. (2022). Introduction: Place attachment – Theory and practice. GeoJournal Library, 2022: 1-29. https://doi.org/10.1007/978-3-031-09775-1_1
[21] Velazquez-Salazar, M., DelaTorre-Diaz, L. (2024). Sustainability and quality of life in marginalized areas: An impact evaluation of a community center in Santa Fe, Mexico. Sustainability, 16(18): 7894. https://doi.org/10.3390/su16187894
[22] Surjono, A.P., Jasmine, E.B., Kurniawan, K.E., Sari, E.R., Fatahillah, E.R. (2024). The influence of cultural heritage status on the quality of life of slum settlement community. Evolutionary Studies in Imaginative Culture, 8(2): 1054-1067. https://doi.org/10.70082/esiculture.vi.993
[23] Darma, R., Salman, D. (2024). Examining the effect of agribusiness actors' performance on the performance of Arabica coffee agribusiness subsystem in North Toraja Regency. International Journal of Sustainable Development and Planning, 19(4): 1471-1484. https://doi.org/10.18280/ijsdp.190424
[24] Gharbia, S., Alfatah, S.A., Gill, L., Johnston, P., Pilla, F. (2016). Land use scenarios and projections simulation using an integrated gis cellular automata algorithms. Modeling Earth Systems and Environment, 2: 1-20. https://doi.org/10.1007/s40808-016-0210-y
[25] Kuanyshbayeva, S., Rakhmetova, G., Abdullayev, I., Levichev, O., Levicheva, S., Aitkazina, M., Shichiyakh, R. (2025). Integrating spatial planning and land use administration for sustainable development. International Journal of Sustainable Development and Planning, 20(3): 1337-1343. https://doi.org/10.18280/ijsdp.200339
[26] Sadewo, M.N., Buchori, I. (2018). Simulation of land use changes due to the development of the Kendal Industrial Area (KIK) based on cellular automata. Majalah Geografi Indonesia, 32(2): 142. https://doi.org/10.22146/mgi.32272
[27] Alam, N., Saha, S., Gupta, S., Chatterjee, A. (2023). Settlement suitability analysis of a riverine floodplain in the perspective of gis-based multicriteria decision analysis. Environmental Science and Pollution Research, 30(24): 66002-66020. https://doi.org/10.1007/s11356-023-26985-4
[28] Ministry of Public Works and Public Housing of the Republic of Indonesia. (2015). Regulation No. 28/PRT/M/2015 concerning the determination of river boundary lines and lake boundary lines. https://peraturan.bpk.go.id/Details/159992/permen-pupr-no-28prtm2015-tahun-2015.
[29] Government of the Republic of Indonesia. (2022). Law No. 2 of 2022 concerning the second amendment to Law No. 38 of 2004 concerning roads. https://peraturan.bpk.go.id/Details/195878/uu-no-2-tahun-2022.
[30] Hujiyanto, H., Lakawa, I., Sufrianto, S., Muhsar, M. (2024). Analysis of the influence of the improvement of the Kendari City Ring Road on land sale value (Study on the BTS road section of Kendari City and South Konawe Regency). Sultra Civil Engineering Journal, 5(1): 186-195. https://doi.org/10.54297/sciej.v5i1.578
[31] National Standardization Agency of Indonesia. (2004). SNI 03-1733-2004: Procedures for planning urban housing environments. https://www.indonesia-geospasial.com/2020/06/download-sni-03-1733-2004-tata-cara.html.
[32] Barrena, E., Canca, D., Ortega, F.A., Piedra-de-la-Cuadra, R. (2020). Solidarity behaviour for optimizing the waste selective collection. International Journal of Sustainable Development and Planning, 15(2): 133-140. https://doi.org/10.18280/ijsdp.150202
[33] Rojas, P., Moya, C., Caballero, M., Márquez, W., Briones-Bitar, J., Morante-Carballo, F. (2023). Assessing and mitigating seismic risk for a hospital structure in Zaruma, Ecuador: A structural and regulatory evaluation. International Journal of Safety and Security Engineering, 13(4): 597-610. https://doi.org/10.18280/ijsse.130402
[34] Al-Baaj, D., Alsaatee, H. (2023). Quality assessment of residential complexes standards of satisfaction in Basra city of Iraq. International Journal of Sustainable Development and Planning, 18(7): 2233-2244. https://doi.org/10.18280/ijsdp.180728
[35] Alkire, S., Santos, M.E. (2014). Measuring acute poverty in the developing world: Robustness and scope of the multidimensional poverty index. World Development, 59: 251-274. https://doi.org/10.1016/j.worlddev.2014.01.026
[36] Budiantoro, S., Fanggidae, V., Saputra, W., Maftuchan, A., Puspa Artha, D.R. (2013). Multidimensional poverty index (MPI): Concept and measurement in Indonesia. Perkumpulan Prakarsa. https://theprakarsa.org/wp-content/uploads/2023/02/Multidimensional-Poverty-Index-MPI-Konsep-dan-Pengukurannya-di-Indonesia-2013.pdf.
[37] Alkire, S., Kanagaratnam, U., Suppa, N. (2021). Global multidimensional poverty index 2021: Unmasking disparities by ethnicity, caste and gender. United Nations Development Programme (UNDP) and Oxford Poverty and Human Development Initiative (OPHI). https://ophi.org.uk/multidimensional-poverty-index/.
[38] Ministry of Energy and Mineral Resources of the Republic of Indonesia. (2021). Regulation No. 28 of 2021 concerning amendments to Regulation No. 26 of 2009 on the provision and distribution of liquefied petroleum gas. https://www.peraturan.go.id.
[39] Rahmayanti, L., Rahmah, D.M., Larashati, L. (2021). Analysis of the utilization of oil and natural gas energy resources in Indonesia. Jurnal Sains Edukatika Indonesia (JSEI), 3(2): 9-16. https://jurnal.uns.ac.id/jsei/article/view/70898.
[40] Ministry of Public Works and Public Housing of the Republic of Indonesia. (2018). Regulation No. 29/PRT/M/2018 concerning technical standards for minimum service standards for public works and public housing. https://peraturan.bpk.go.id/Details/159743/permen-pupr-no-29prtm2018-tahun-2018.
[41] Ministry of Public Works and Public Housing of the Republic of Indonesia. (2007). Regulation No. 18 of 2007 concerning the implementation of the development of drinking water supply systems. https://peraturan.bpk.go.id/Details/285851/permen-pupr-no-18-tahun-2007.
[42] Ministry of Public Works and Public Housing of the Republic of Indonesia. (2008). Regulation No. 22 of 2008 concerning technical guidelines for procurement, registration, determination of status, occupancy, transfer of status and transfer of rights to state housing. https://peraturan.bpk.go.id/Details/285611/permen-pupr-no-22-tahun-2008.
[43] Government of the Republic of Indonesia. (2022). Presidential Regulation No. 112 of 2022 concerning the acceleration of renewable energy development for electricity supply. https://peraturan.bpk.go.id/Details/225308/perpres-no-112-tahun-2022.
[44] Tanubrata, M. (2019). Construction materials in the context of civil engineering. Jurnal Teknik Sipil, 11(2): 132-154. https://doi.org/10.28932/jts.v11i2.1407
[45] Panennungi, P., Pertiwi, N. (2018). Building materials science. Badan Penerbit Universitas Negeri Makassar. https://eprints.unm.ac.id/15334/1/Buku%20IBB.pdf.
[46] Ministry of Finance of the Republic of Indonesia. (2009). Regulation No. 96/PMK.03/2009 concerning types of assets included in the group of tangible non-building assets for depreciation purposes. https://perpajakan.ddtc.co.id/sumber-hukum/peraturan-pusat/peraturan-menteri-keuangan-96pmk-032009?bahasa=english.
[47] World Health Organization. (2012). WHOQOL: User manual (WHO/HIS/HSI Rev.2012.03). Programme on Mental Health. https://www.who.int/publications/i/item/WHO-HIS-HSI-Rev.2012.03.
[48] Theofilou, P. (2013). Quality of life: Definition and measurement. Europe’s Journal of Psychology, 9(1): 150-162. https://doi.org/10.5964/ejop.v9i1.337
[49] Alves-Guerreiro, J. (2000). Measuring health: A guide to rating scales and questionnaires. Physical Therapy Reviews, 5(3): 183-183. https://doi.org/10.1179/ptr.2000.5.3.183
[50] de Silva, J.P., Amadei, J.L. (2016). Influence of medical care in the quality of life (whoqol-100) of women living with systemic lupus erythematosus. Revista Brasileira De Reumatologia (English Edition), 56(3): 198-205. https://doi.org/10.1016/j.rbre.2015.08.017
[51] Wyrwich, K.W., Gross, C.R. (2008). Quality of life in clinical medicine. In Sleep and Quality of Life in Clinical Medicine. Humana Press, pp. 1-9. https://doi.org/10.1007/978-1-60327-343-5_1
[52] Tampubolon, D., Irsan, M., Harlen, H., Mardiana, M., Handoko, T. (2022). Preference of spatial mobility and reside in the suburbs Indonesia. International Journal of Sustainable Development and Planning, 17(5): 1479-1487. https://doi.org/10.18280/ijsdp.170512
[53] Skevington, S.M. (1998). Investigating the relationship between pain and discomfort and quality of life, using the WHOQOL. Pain, 76(3): 395-406. https://doi.org/10.1016/s0304-3959(98)00072-4
[54] Kume, Y., Makabe, S., Singha-Dong, N., Vajamun, P., Apikomonkon, H., Griffiths, J. (2017). Seasonal effects on the sleep–wake cycle, the rest–activity rhythm and quality of life for Japanese and Thai older people. Chronobiology International, 34(10): 1377-1387. https://doi.org/10.1080/07420528.2017.1372468
[55] Carneiro, L.L., Paz, M.D.G.T. (2021). Quality of Life at Work − Concepts, Models, and Measures. Assessing Organizational Behaviors, Springer, Cham, pp. 143-171. https://doi.org/10.1007/978-3-030-81311-6_7
[56] Ferreira, C., Trindade, I.A. (2014). Body image-related cognitive fusion as a main mediational process between body-related experiences and women’s quality of life. Eating and Weight Disorders - Studies on Anorexia, Bulimia and Obesity, 20(1): 91-97. https://doi.org/10.1007/s40519-014-0155-y
[57] Girzelska, J., Chomicki, L. (2021). The relationship between the experience of negative feelings and quality of life and the socio-demographical factors of patients treated for discopathy of the lumbar spine. Acta Neuropsychologica, 19(1): 93-104. https://doi.org/10.5604/01.3001.0014.7570
[58] Despita, C.W., Yuliani, K.F., Tanuwijaya, J. (2022). The influence of high performance work systems on community participation through feeling trusted and knowledge sharing behavior. J-Mas (Jurnal Manajemen Dan Sains), 7(1): 299. https://doi.org/10.33087/jmas.v7i1.398
[59] Rao, U.T., Noronha, J.A., Adiga, K.R. (2020). Effect of aerobic exercises on depressive symptoms, anxiety, self-esteem, and quality of life among adults with depression. Clinical Epidemiology and Global Health, 8(4): 1147-1151. https://doi.org/10.1016/j.cegh.2020.04.006
[60] WHOQoL SRPB Group. (2006). A cross-cultural study of spirituality, religion, and personal beliefs as components of quality of life. Social Science & Medicine, 62(6): 1486-1497. https://doi.org/10.1016/j.socscimed.2005.08.001
[61] Masthoff, E., Trompenaars, F.J., Heck, G.L.V., Hodiamont, P., Vries, J.D. (2005). Validation of the who quality of life assessment instrument (whoqol-100) in a population of Dutch adult psychiatric outpatients. European Psychiatry, 20(7): 465-473. https://doi.org/10.1016/j.eurpsy.2004.09.012
[62] Ministry of Public Works and Public Housing of the Republic of Indonesia. (2016). Regulation No. 02/PRT/M/2016 concerning improving the quality of slum housing and slum settlements. https://peraturan.bpk.go.id/Details/104644/permen-pupr-no-02prtm2016-tahun-2016.
[63] Atikawati, D., Harahab, N., Caesar, N.R., Puspitawati, D., Muflihulafi, D.A., Supriyadi, S., Wardana, N.K., Hakim, A.I., Fathah, A.L., Putri, B.M., Isdianto, A., Maskan, M., Utaminingsih, A. (2024). Political and ideological vulnerabilities in Indonesia's border with timor-leste to support state resilience and security: A study on Belu and Malaka regencies. International Journal of Sustainable Development and Planning, 19(6): 2319-2331. https://doi.org/10.18280/ijsdp.190630
[64] Delphin, S., Snyder, K.A., Tanner, S., Musálem, K., Marsh, S.E., Soto, J.R. (2022). Obstacles to the development of integrated land-use planning in developing countries: The case of Paraguay. Land, 11(8): 1339. https://doi.org/10.3390/land11081339
[65] Russo, A. (2024). Renaturing for urban wellbeing: A socioecological perspective on green space quality, accessibility, and inclusivity. Sustainability, 16(13): 5751. https://doi.org/10.3390/su16135751
[66] Ali, R.A., Muntaqa, A., Ahmed, H. (2024). Resilient architecture: A sustainable approach to rebuilding low-cost community shelters in flash flood-prone areas. Turkish Journal of Sense of Place and Urban Studies, 2(1): 1-18. https://doi.org/10.5281/zenodo.11092463
[67] Azimi, S., Hon, C.K., Tyvimaa, T., Skitmore, M. (2024). Adoption of energy-efficiency measures by Australian low-income households. Journal of Housing and the Built Environment, 39(2): 909-936. https://doi.org/10.1007/s10901-023-10104-3
[68] Marson, F., Eagly, P., Russell, O.M. (2023). Impact of social assistance programs on family economic welfare in urban environments: An analysis of equity and community engagement. Law and Economics, 17(3): 186-202. https://doi.org/10.35335/laweco.v17i3.44
[69] Shah, A. (2024). Impact of microfinance initiatives on poverty alleviation in Bangladesh. Journal of Poverty, Investment and Development, 9(1): 1-13. https://doi.org/10.47604/jpid.2583
[70] Nguyen, H.T., Nguyen, Q.L.H.T.T. (2024). Exploring the role of social capital in urban resilience for sustainable development: The case of ho chi Minh city in Vietnam. International Journal of Sustainable Development and Planning, 19(8): 3213-3223. https://doi.org/10.18280/ijsdp.190833
[71] Chen, Y., Liu, H., Lin, S., Wang, Y., Zhang, Q., Feng, L. (2024). The impact of social capital on community resilience: A comparative study of seven flood-prone communities in Nanjing, China. Land, 13(8): 1145. https://doi.org/10.3390/land13081145
[72] Baldwin, C., King, R. (2018). Social sustainability, climate resilience and community-based urban development: What about the people? Routledge. https://doi.org/10.4324/9781351103329
[73] Setiawan, C.T., Ningtyas, R. (2023). Urban well-being and community development: Investigating the relationship between built environments, social networks, and quality of life. West Science Social and Humanities Studies, 1(2): 53-62. https://doi.org/10.58812/wsshs.v1i02.188
[74] Aryanti, D., Ghani, M.Z.A., Nazmi, A., Yulianti, Y. (2024). Collective housing concept for riverside settlement; case study in Padang, Indonesia. Journal of Design and Built Environment, 4: 115-139. https://doi.org/10.22452/jdbe.sp2024.7
[75] Ounagh, N., Mohammad, O. (2011). A comparative study of social capital and quality of life in Delhi and Tehran. Journal of Social Welfare and Management, 1(1): 19-25.
[76] Bălan, S., Mustață, A.I., Ifrim, C. (2023). A diagnosis of the global quality of life. In 2023 24th International Conference on Control Systems and Computer Science (CSCS), Bucharest, Romania, pp. 625-632. https://doi.org/10.1109/CSCS59211.2023.00104
[77] García Mira, R., Uzzell, D.L., Real, J.E., Romay Martínez, J. (2017). Housing, Space and Quality of Life. Routledge. https://doi.org/10.4324/9781351156363
[78] Hasyim, A.W., Sukojo, B.M., Anggraini, I.A., Fatahillah, E.R., Isdianto, A. (2025). Urban heat island effect and sustainable planning: Analysis of land surface temperature and vegetation in Malang city. International Journal of Sustainable Development and Planning, 20(2): 683-697. https://doi.org/10.18280/ijsdp.200218
[79] Hasyim, A.W., Ari, I.R.D., Kurniawan, E.B., Kriswati, L., Wahid, M.N.I., Isdianto, A. (2024). Integrating object-based classification and multivariate analysis to evaluate flood vulnerability in unplanned settlements of Malang city, Indonesia. International Journal of Design & Nature and Ecodynamics, 19(5): 1611-1625. https://doi.org/10.18280/ijdne.190515
[80] Xu, T., Xie, Z., Zhao, F., Li, Y., Yang, S., Zhang, Y., Hou, Z. (2021). Assessing permeability controls and flood risks related to urban impervious surface expansion: A case study of the southern part of Kunming city, China. https://doi.org/10.21203/rs.3.rs-606230/v1
[81] Hemmati, M., Ellingwood, B.R., Mahmoud, H.N. (2020). The role of urban growth in resilience of communities under flood risk. Earth's Future, 8(3): e2019EF001382. https://doi.org/10.1029/2019ef001382
[82] Ajjur, S.B., Al-Ghamdi, S.G. (2022). Exploring urban growth–climate change–flood risk nexus in fast growing cities. Scientific Reports, 12(1): 12265. https://doi.org/10.1038/s41598-022-16475-x
[83] Wu, Z., Shen, Y., Wang, H. (2019). Assessing urban areas’ vulnerability to flood disaster based on text data: A case study in Zhengzhou city. Sustainability, 11(17): 4548. https://doi.org/10.3390/su11174548
[84] Miladan, N., Ariani, F., Pertiwi, S.N.I., Setiawan, R., Handayani, K.N. (2019). Land use vulnerability towards the flood risk in Surakarta City. In MATEC Web of Conferences, Banjarmasin, Indonesia, p. 01011. https://doi.org/10.1051/matecconf/201928001011
[85] Gore, R., Lynch, C.J., Jordan, C., Collins, A.J., Robinson, R.M., Fuller, G., Kandukuri, Y. (2022). Estimating the health effects of adding bicycle and pedestrian paths at the census tract level: Multiple model comparison. JMIR Public Health and Surveillance, 8(8): e37379. https://doi.org/10.2196/37379
[86] Liu, J., Kong, Y., Li, S., Wu, J. (2021). Sustainability assessment of port cities with a hybrid model-empirical evidence from China. Sustainable Cities and Society, 75: 103301. https://doi.org/10.1016/j.scs.2021.103301
[87] Francis, J., Giles-Corti, B., Wood, L., Knuiman, M. (2012). Creating sense of community: The role of public space. Journal of Environmental Psychology, 32(4): 401-409. https://doi.org/10.1016/j.jenvp.2012.07.002
[88] Zalloom, B. (2023). Assessing the transformation of the social role of public parks during the COVID-19 pandemic (The case study of King Husain Park in Amman). International Journal of Sustainable Development and Planning, 18(7): 2133-2141 https://doi.org/10.18280/ijsdp.180716
[89] Hassanain, M.A., Al-Suwaiti, I. (2024). Stakeholder assessment of design quality indicators for community centers: A Delphi approach. Property Management, 43(1): 15-42. https://doi.org/10.1108/pm-12-2023-0119
[90] Javid, M. (2019). Public and private infrastructure investment and economic growth in Pakistan: An aggregate and disaggregate analysis. Sustainability, 11(12): 3359. https://doi.org/10.3390/su11123359
[91] Monstadt, J., Schmidt, M. (2019). Urban resilience in the making? The governance of critical infrastructures in German cities. Urban Studies, 56(11): 2353-2371. https://doi.org/10.1177/0042098018808483
[92] Abdulaal, W.A. (2011). Public–private partnership in regenerating unplanned settlements in Jeddah. International Journal of Sustainable Development and Planning, 6(2): 181-194. https://doi.org/10.2495/sdp-v6-n2-181-194
[93] Buso, M., Greco, L. (2023). The optimality of public–private partnerships under financial and fiscal constraints. Journal of Economics & Management Strategy, 32(4): 856-881. https://doi.org/10.1111/jems.12520
[94] Zhang, L. (2025). The impact of esg performance on the financial performance of companies: Evidence from China's shanghai and Shenzhen a-share listed companies. Frontiers in Environmental Science, 13: 1507151. https://doi.org/10.3389/fenvs.2025.1507151
[95] Arimoro, A.E. (2021). Private sector investment in infrastructure in Sub-Saharan Africa post-COVID-19: The role of law. Public Works Management & Policy, 27(2): 108-126. https://doi.org/10.1177/1087724x211059531
[96] Delicado, A., Rowland, J., Fonseca, S., de Almeida, A.N., Schmidt, L., Ribeiro, A.S. (2017). Children in disaster risk reduction in Portugal: Policies, education, and (non) participation. International Journal of Disaster Risk Science, 8: 246-257. https://doi.org/10.1007/s13753-017-0138-5
[97] Tozier de La Poterie, A., Baudoin, M.A. (2015). From Yokohama to Sendai: Approaches to participation in international disaster risk reduction frameworks. International Journal of Disaster Risk Science, 6: 128-139. https://doi.org/10.1007/s13753-015-0053-6
[98] Fatica, S., Panzica, R. (2021). Green bonds as a tool against climate change? Business Strategy and the Environment, 30(5): 2688-2701. https://doi.org/10.2139/ssrn.3710020
[99] Liaw, K.T. (2020). Survey of green bond pricing and investment performance. Journal of Risk and Financial Management, 13(9): 193. https://doi.org/10.3390/jrfm13090193
[100] Huang, L., Cao, Y., Zhu, Y. (2023). Is there any recovery power for economic growth from green finance? Evidence from OECD member countries. Economic Change and Restructuring, 56(6): 3909-3926. https://doi.org/10.1007/s10644-022-09458-5
[101] Shah, S.S., Murodova, G., Khan, A. (2024). Achieving zero emission targets: The influence of green bonds on clean energy investment and environmental quality. Journal of Environmental Management, 364: 121485. https://doi.org/10.1016/j.jenvman.2024.121485
[102] Baştürk, M.F. (2024). Does green finance reduce carbon emissions? Global evidence based on system generalized method of moments. Sustainability, 16(18): 8210. https://doi.org/10.3390/su16188210