Adhitya Agri Putra | Agung Nur Probohudono* | Wahyu Widarjo | Eko Arief Sudaryono
© 2025 The authors. This article is published by IIETA and is licensed under the CC BY 4.0 license (http://creativecommons.org/licenses/by/4.0/).
OPEN ACCESS
This study examines the effect of low-carbon emissions on stock market participation in the LQ45 index of the Indonesian Stock Exchange. The research sample consists of 90 firms listed on the LQ45 index from 2023 to 2024. Low-carbon emissions are proxied by the inclusion of stocks in the LQ45 Low Carbon Leaders (LQ45LCL) index, while stock market participation is measured by trading volume. The hypothesis is tested using fixed-effect regression models at the company and industry levels. The results indicate that low-carbon emissions positively influence stock market participation, suggesting that firms with lower carbon footprints attract more investor engagement. Moreover, this effect is more pronounced in firms operating in industries with lower information asymmetry and non-environmentally sensitive sectors. This study contributes to the literature by expanding empirical evidence on the relationship between carbon emissions and stock market dynamics. Additionally, it provides novel insights into the Indonesian market, offering implications for investors, regulators, and policymakers aiming to promote sustainable investment practices.
low-carbon emission, stock market participation, index of LQ45
Climate change becomes an important issue in business activities [1]. Climate change problems include global warming, pollution, environmental damage, and carbon emissions [2, 3]. Indonesia commits to mitigating the climate change problems by involving in United Nations Framework Convention on Climate Change (UNFCCC) [4]. In the context of business, the Indonesian government provides the regulations of PP no. 98 2021 and PERMEN LHK no. 21 2022. The regulations arrange the economic value of the carbon emission and the reduction of greenhouse emissions. Since stakeholders including regulator give pressure on companies to reduce carbon emissions, companies consider running low-carbon businesses [5]. It happens because there is a demand for a low-carbon business that needs to be run in the long term without harming environmental and social aspects [6].
Low-carbon businesses can attract investors in the stock market to participate in stock investments that support low-carbon businesses. First, a low-carbon business can lead to green business. Green business provides higher companies’ performance by creating a new market segment of green products for green customers [7, 8], expenditure saving from energy efficiency [7-9], and reduction of cost of conflict between companies and regulators [8, 10]. In this case, higher companies' performance contributes to stock value and increases stock market participation. Second, a low-carbon business can lead companies to have a sustainable business. Sustainable business is important to ensure that companies are still profitable in the future. In this case, sustainable business can also predict future stock returns [11, 12]. Besides future stock returns, the sustainable business also helps companies to provide more cash flow and earnings in the future [13]. Third, low-carbon businesses can bring more potential for dividends. Since low-carbon business helps companies get better performance, including generating more earnings [14], there is potential for bigger dividends for investors [15, 16]. Rahman [17] reports that, based on a survey by Katadata Insight Center, there are 66.1% of Indonesian investors tend to invest in companies with green businesses. PricewaterhouseCoopers [18] also reports that most investments with green businesses attract more investors in the ASEAN stock market. Some studies find that green business leads to positive reactions from stock market reactions [12, 19-21]. Based on signaling theory, the benefits of green business that come from low-carbon business and the growth of investment in green business are the signal of low-carbon companies' quality and leads low-carbon emission to attract more stock market participant, including investors, to participate in low carbon-based stock investment.
This research aims to examine the effect of low-carbon emissions on stock market participation on the stock index of the Indonesian Stock Exchange LQ45. There are some considerations why this research examines the companies that are listed on the index of LQ45. First, stocks of LQ45 are the most liquid stocks on the Indonesian Stocks Exchange. Liquid stocks refer to stock that is traded frequently where investors can easily sell or buy the stock with lower costs since the tradeable stocks are available [22]. Stock liquidity leads to stock market participation since the availability of tradeable stock allows investors to participate more in stock investment [23, 24]. Second, the Indonesian Stock Exchange, recently, publishes the index of LQ45 Low-Carbon Leader (hereafter LQ45LCL). The index of LQ45LCL refers to the stock index where the companies reduce weighted average carbon intensity by 50% compared to the LQ45 (parent index) and exclude coal production companies [25]. In this case, LQ45 is the base of carbon emission evaluation used by the Indonesian Stock Exchange.
This research contributes to extending previous studies that relate to carbon emissions and the stock market. Some studies examine the effect of carbon emissions on the market return and investors' perceptions. Bolton and Kacperczyk [26] find that carbon emission increase stock risk and leads to a higher return. Shi et al. [27] and Alsaifi et al. [6] find that carbon emission reduction is perceived as good news by investors. In this case, this research examines whether low-carbon emission increases stock market participation since there are findings between stock market attributes and carbon emission [6, 26, 27]. This research also contributes to providing new evidence in Indonesia. This research can be considered by the Indonesian Stock Exchange or Financial Service Authority since there will be a launch of the carbon market in Indonesia in 2023. This research provides evidence of whether carbon emissions can affect investors to participate in investments that relate to carbon.
2.1 Signaling theory
Signaling theory suggests the condition where companies publish particular information to give a signal about companies’ quality and performance to external parties [28, 29]. The main objective of information signaling is to reduce information asymmetry between companies and external parties. As one of the external parties, investors need to know the companies' quality to make an investment decision [30]. On the other hand, companies need to give a signal to investors because companies have a quality that has to be informed to investors [31].
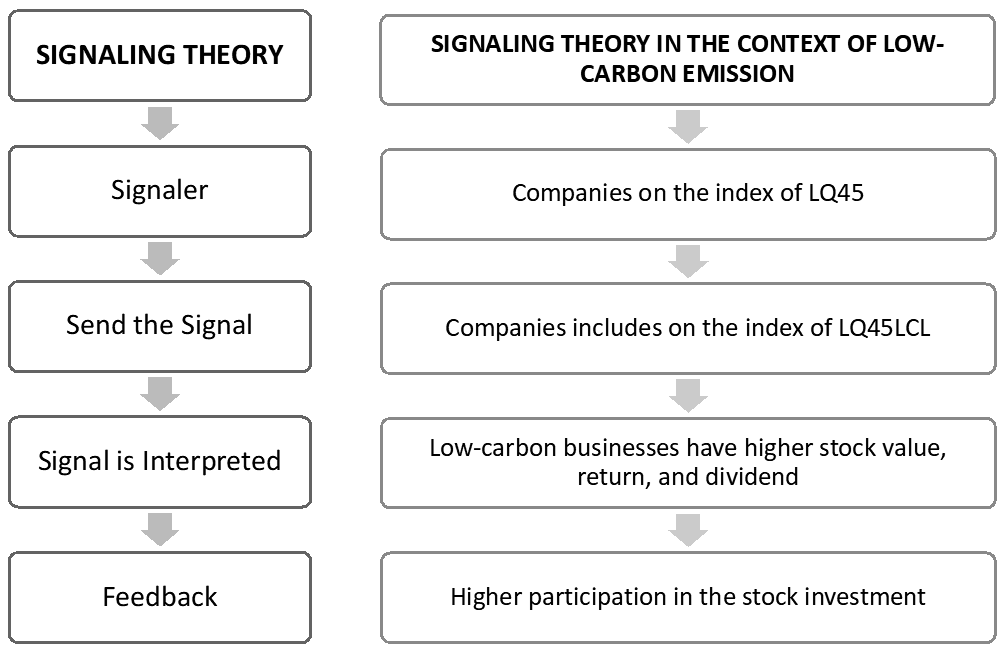
Connelly et al. [31] explain the steps of information signaling. First, there is a company that has specific qualities as a signaler. Second, the signaler sends the signal. Third, there are information users as signal receivers. Receivers will observe and interpret the signal. Fourth, receivers will give their reaction and send feedback to the signaler. In the context of low-carbon emissions, companies give a signal to investors that investors need to invest in the companies' stock since companies have benefits of green business that lead to sustainability. The concept of signaling theory in low-carbon emission can be seen in Figure 1.
Figure 1. Signaling theory in the context of carbon emission
Based on Figure 1, the signalers are the companies that are listed on the index of LQ45. Signalers give a signal that, among all listed companies on the index of LQ45, signalers have the quality to reduce carbon emission by entering the index of LQ45LCL. As a signal, the index of LQ45LCL is interpreted by stock market participants. Stock market participants evaluate listed companies on the index of LQ45LCL have better carbon reduction performance. The Indonesian Stock Exchange assesses and evaluates the effectiveness of companies listed on the index of LQ45LCL to reduce carbon emissions compared to other companies on the index of LQ45. Stock market participants will give feedback by making an investment decision. The investment decision is an indicator of stock market participation.
2.2 Carbon emission
Some studies find that climate change keeps contributing to temperature increases and global warming [32-34]. One of the causes of climate change is the existence of greenhouse emissions [35]. Greenhouse emission contributes to generating carbon emissions [36].
Carbon emission refers to the release of carbon gas into the atmosphere. Carbon gas comes from people's activities such as the burning process of fuels, coals, etc. Carbon emission also comes from business activities. Carbon emission happens since the industrial revolution in the 1750s in developed countries [37]. Lamb et al. [38] explain that the biggest contributors to carbon emissions come from fossil fuel and energy/electricity use where most emissions are carbon dioxides (CO2). Financial Service Authority [39] also confirms that the top contributor to carbon emissions in Indonesia is the energy industry. Lamb et al. [38] report that, globally, carbon emission keeps grow from 1990-2018 [40]. In 2022, based on data from Energy Institute, total CO2 emissions in the world is 34.37 billion tons which becomes the biggest amount in history [40].
Indonesia is the top 6 largest CO2 emission contributor in 2022 with 692 million tons [40]. In this case, Indonesia needs to manage carbon emissions from companies by issuing related regulations. The Indonesian government provides the regulations of PP no. 98 2021 and PERMEN LHK no. 21 2022. The regulations arrange the economic value of the carbon emission and the reduction of greenhouse emissions. Financial Service Authority also assesses companies’ performance to reduce carbon emissions by issuing a stock index of LQ45LCL. The index of LQ45LCL refers to the stock index where the companies reduce weighted average carbon intensity by 50% compared to the LQ45 (parent index) and exclude coal production companies [25].
The main issue of carbon emissions is the effort to reduce carbon emissions and minimize the risk of climate change. There are 3 scopes of carbon emission. First, scope 1 refers to the emissions that come directly from owned or controlled sources. Second, scope 2 refers to the emission that comes indirectly from the generation of purchased energy. Third, scope 3 refers to the emissions that come indirectly from the value chain of the company [41]. In the case of the index of LQ45LCL, the carbon emission evaluation includes scopes of 1 and 2.
Bolton and Kacperczyk [26] examine whether carbon risk is valued by investors in the US stock market. The result shows that higher carbon risk leads to higher returns. Bolton and Kacperczyk [26] explain that there is a possibility that investors ignore the risk of climate change in the future and still invest in stocks with higher carbon emissions.
Shi et al. [27] examine China’s carbon emission rights price, energy prices, macroeconomic level, and weather conditions. The result shows that carbon emission rights price is determined by historical price and gives impact on crude oil. Furthermore, there is no relationship between carbon emission rights price and weather conditions.
Alsaifi et al. [6] examine the effect of carbon disclosure on market responses on the London Stock Exchange. The result finds that the market reacts negatively to carbon disclosure. Furthermore, Alsaifi et al. [6] find that positive reaction to carbon disclosure during the crisis period.
2.3 Hypothesis development
Carbon emission that comes from companies' business activities becomes a consideration for investors to make an investment decision. Carbon emission becomes an indicator that business cares for the society and environment which leads to business sustainability. In this case, companies’ performance to reduce carbon emission attract stock market participants, including investors, to invest more in the companies with low-carbon emission.
There are some arguments for why low-carbon emission increases stock market participation. First, low-carbon business is an indicator of green business. The green business provides higher companies' performance by creating a new market segment of green products for green customers [7, 8], expenditure saving from energy efficiency [7-9], and reduction of cost of conflict between companies and regulators [8, 10]. Costs reduction and potential market segment can improve companies' performance which leads to higher stock value and increased stock market participation. Jha and Samudra [42] find that asset value attracts investor participation to invest in higher value assets to create investors’ wealth.
Second, low-carbon practices support long-term business sustainability, which enhances future profitability, stock returns [11, 12], and the generation of cash flows and earnings [13]. Ioannou and Serafeim [43] find that business sustainability becomes stock analysts' recommendation for investment since business sustainability creates long-term returns. Stock analysts' recommendations will be a driver to make higher stock market participation.
Third, low-carbon businesses tend to deliver stronger performance and higher earnings [14], increasing the potential for greater dividend payouts to investors [15, 16]. Higher return on dividends leads investors to participate more in stock investment.
Several studies report that green business initiatives generate positive stock market reactions (e.g., [12, 19-21]). In line with signaling theory, the benefits associated with low-carbon practices serve as signals of firm quality, encouraging greater investor participation in low-carbon investments. The benefits of low-carbon emissions are the key to creating wealth for investors. In this case, wealth creation becomes the main role to increase stock market participation [44].
Ha: Low-carbon emission has a positive effect on stock market participation.
3.1 Sample and data
This research uses panel data comprising firms listed on the LQ45 index during two semiannual periods: August 2023 – January 2024 and February 2024 – July 2024. The LQ45 index, published biannually by the Indonesia Stock Exchange (IDX), consists of the 45 most liquid and actively traded stocks in the market.
Sample selection follows the LQ45 composition as determined for each respective period, thereby capturing the dynamic nature of index rebalancing as conducted by IDX every six months. This approach reflects a realistic structure of liquidity-driven investment options and avoids survivorship bias by not restricting the sample to firms consistently listed throughout both periods.
Firms with low-carbon emissions are identified using a dummy variable, taking the value of 1 if the firm is listed in the LQ45 Low Carbon Leaders (LQ45LCL) index for the corresponding semester, and 0 otherwise. The LQ45LCL index, launched by IDX, includes companies that have reduced their weighted average carbon intensity by at least 50% relative to the parent LQ45 index and excludes firms engaged in coal-related businesses.
According to the official methodology provided by IDX [25], selection into the LQ45LCL index is based on standardized, self-reported emissions disclosures published in company sustainability reports. While IDX applies a consistent internal framework to screen eligible firms, no third-party verification is currently mandated.
Table 1. Sample distribution
|
Period |
LQ45LCL Evaluation Date |
Number of Companies |
|
August 2023 – January 2024 |
25th July 2023 |
45 |
|
February 2024 – July 2024 |
25th January 2024 |
45 |
|
Total Sample |
90 |
|
After aligning LQ45 and LQ45LCL membership with the availability of complete data, the final sample comprises 90 firm-period observations (45 firms per semester), with relevant data drawn from the official IDX website, corporate annual reports, and sustainability reports. The distribution of the sample across the two observation periods is summarized in Table 1.
3.2 Research variables
This research employs one main independent variable, one dependent variable, and several control variables to examine the relationship between carbon performance and stock market participation.
The independent variable is low-carbon emission, measured as a dummy variable equal to 1 if the firm is listed in the LQ45 Low Carbon Leaders (LQ45LCL) index, and 0 otherwise. As explained previously, LQ45LCL firms represent companies that have reduced their weighted average carbon intensity by at least 50% relative to the LQ45 index benchmark and do not include coal-producing entities. The classification is based on self-disclosed emissions data assessed under a standardized methodology developed by IDX.
The dependent variable is stock market participation, proxied by the natural logarithm of trading volume (logVOL) on the day the LQ45LCL index is announced. Trading volume is used over other possible metrics such as liquidity ratios or turnover because it reflects investor reaction more directly and sensitively, especially in response to ESG disclosures. This approach aligns with prior studies that associate volume with investor attention and confidence. As a robustness check, we also use the natural logarithm of trading frequency (logFREQ) as an alternative dependent variable to test whether the observed impact extends to the number of transactions [45].
This research also uses control variables to control that stock market participation is not only affected by low-carbon emissions. Control variables include financial and governance-related indicators that may influence stock market participation: leverage, institutional ownership, managerial ownership, independent commissioner, and sustainability committee.
Leverage is measured by debt-to-assets ratio [46], controlling for firms’ financial risk. Leverage may discourage investors due to risk [46] or attract risk-tolerant investors [47] and aims to control financial risks by the firms. There are two possibilities of leverage on stock market participation. First, financial risk can be bad news for investors [46] which reduces stock market participation. Second, financial risk can increase stock market participation in the condition where investors are risk-takers [47].
Institutional and managerial ownerships aim to control the types of investors in the stock market. Institutional Ownership is the proportion of shares owned by institutional investors. The data are obtained from annual reports and IDX ownership disclosures. Institutional investors may reduce liquidity through large block holdings or enhance market confidence depending on their profile [47]. Higher institutional ownership indicates the existence of institutional investors that can make a transaction with a big volume which leads to lower stock liquidity [48]. In this case, institutional ownership has a negative effect on stock market participation. Institutional ownership is measured by stock held by institutions relative to outstanding stock.
Managerial Ownership is the proportion of shares held by executive insiders, also sourced from annual reports and corporate filings. High insider ownership may reduce market participation due to information asymmetry [49]. In this case, managerial ownership has a negative effect on stock market participation.
Independent commissioners and sustainability committees aim to control governance mechanisms that relate to carbon emissions. Carbon emission includes social and environmental responsibilities. In this case, independent commissioners ensure companies perform business with low-carbon emissions to fulfill external parties' interests including stock market participants [50].
Independent Commissioners is measured by the proportion of independent members on the board of commissioners, as a governance mechanism expected to enhance transparency and investor trust [50]. Independent commissioner has a positive effect on stock market participation.
Sustainability committee is a dummy variable coded 1 if the company has an ESG or sustainability committee, and 0 otherwise. The presence of such a committee may signal a stronger internal commitment to sustainability [51], thereby functioning as an additional signal in the context of signaling theory. The sustainability committee has a responsibility to ensure companies fulfill social and environmental responsibilities including the reduction of carbon emissions [52]. In this case, the sustainability committee is an indicator of good news for investors [51].
3.3 Data analysis
To test the research hypothesis, this study employs a fixed-effect panel regression model, which accounts for unobservable heterogeneity across firms and industries. Fixed-effect estimation is chosen over pooled OLS and random effects based on the theoretical expectation that time-invariant firm-specific characteristics (e.g., management style, disclosure policy) may bias the estimation if uncontrolled.
Specifically, two forms of fixed effects are applied: First, Firm fixed effects, to control for time-invariant firm-level characteristics that may affect trading volume, such as managerial preferences, firm reputation, or disclosure credibility. Second, Industry fixed effects, to control for sectoral factors that may influence trading behavior, such as differences in regulatory exposure or typical emission intensity levels.
Industries are classified based on the Indonesia Stock Exchange (IDX) sectoral taxonomy, which categorizes firms into sectors such as energy, finance, consumer goods, infrastructure, and others. Although the dataset spans only two reporting periods, fixed effects still help control for structural differences across entities and sectors that remain constant over time.
Given that the study captures cross-sectional variation at two semiannual event points (July 2023 and January 2024), the inclusion of firm and industry dummies is intended to absorb these invariant effects, while emphasizing within-entity variance in trading response to low-carbon signals.
The regression Eq. (1) is specified as follows:
$\begin{aligned} { PARTit }=\beta 0+ & \beta 1 { CARBONit }+\beta 2 { LEVit } +\beta 3 { INSit }+\beta 4 { MANit } +\beta 5 { INDPit }\\ &+ \beta 6 { SUSit } +\sum{ {FirmFE }+\sum { IndustryFE }} +\varepsilon i t\end{aligned}$ (1)
Based on Eq. (1), PART is stock market participation, proxied by log trading volume (logVOL). CARBON is dummy variable indicating low-carbon firm (LQ45LCL membership). LEV is leverage. INS is institutional ownership. MAN is managerial ownership. INDP is proportion of independent commissioners. SUS is sustainability committee dummy. ΣFirmFE is firm fixed effects. ΣIndustryFE is industry fixed effects. ε is error term. it is data panel.
The hypothesis is supported if β₁ is positive and statistically significant, indicating that inclusion in the low-carbon index is associated with increased investor participation.
4.1 Descriptive statistics
Table 2 presents descriptive statistics for all variables used in the analysis. Panel A reports the mean and standard deviation of continuous variables, while Panel B shows the frequency distribution of the binary variable indicating the existence of a sustainability committee.
The descriptive results show that 52 out of 90 observations (firm-periods) are classified as low-carbon. On average, these firms have a slightly higher log trading volume (PART = 17.140) compared to non-low-carbon firms (PART = 16.810), although the difference is not statistically significant.
Leverage (LEV) is significantly higher among low-carbon firms, possibly reflecting greater use of financing for green initiatives or large-scale investments in sustainability. Other governance-related variables such as institutional ownership (INS), managerial ownership (MAN), and the proportion of independent commissioners (INDP) do not differ significantly between the two groups.
In Panel B, a chi-square test reveals that a significantly higher proportion of low-carbon firms have a dedicated sustainability committee (20 out of 52) compared to non-low-carbon firms (8 out of 38), with a p-value of 0.078. This suggests that sustainability committees may serve as a governance signal, consistent with signaling theory. Firms with such committees are likely to institutionalize their ESG agenda, increasing the credibility of their environmental disclosures and improving investor perception.
Table 2. Descriptive statistics
|
Panel A. Continues Variable |
|||||
|
Variable |
Mean (All) |
Mean (Low-Carbon) |
Mean (Non-Low Carbon) |
Std. Dev. (All) |
P-value |
|
PART |
17.00 |
17.14 |
16.81 |
1.211 |
0.226 |
|
LEV |
0.46 |
0.524 |
0.373 |
0.317 |
0.002* |
|
INS |
0.533 |
0.511 |
0.267 |
0.248 |
0.334 |
|
MAN |
0.021 |
0.02 |
0.023 |
0.016 |
0.86 |
|
INDP |
0.458 |
0.472 |
0.439 |
0.127 |
0.235 |
|
Total Sample |
90 |
52 |
38 |
||
|
Panel B. Sustainability Committee (Dummy Variable) |
|||||
|
Sustainability Committee |
All Firms |
Low-Carbon Emission Firms |
Non-Low Carbon Emission Firms |
Chi-Square P-value |
|
|
Yes |
28 |
20 |
8 |
0.078*** |
|
|
No |
62 |
32 |
30 |
||
|
Total Sample |
90 |
52 |
38 |
||
Note: p < 0.01 (*), p < 0.10 (***)
4.2 Preliminary test
Table 3 presents the results of preliminary diagnostic tests to ensure that the data meet classical linear regression assumptions.
Table 3. Preliminary test
|
Test |
Result |
|
Kolmogorov-Smirnov |
Significance value > 0.05 |
|
Glejser |
Significance value > 0.05 |
|
Run |
Significance value > 0.05 |
|
VIF |
VIF < 10, tolerance > 0.1 |
Prior to regression analysis, a series of preliminary diagnostic tests were conducted to assess whether the data meet the classical linear regression assumptions.
Normality was tested using the Kolmogorov–Smirnov test, which evaluates whether the residuals of the regression model deviate significantly from a normal distribution. The results indicate no violation of the normality assumption (p > 0.05).
Heteroscedasticity was examined using the Glejser test, where the absolute residuals from the OLS model are regressed on the explanatory variables. Significant coefficients would indicate heteroscedasticity. In this study, no such significance was found, supporting the assumption of homoscedastic residuals.
Autocorrelation was tested using the Runs test, which assesses whether the sequence of positive and negative residuals is random. The null hypothesis of randomness could not be rejected (p > 0.05), indicating no autocorrelation.
Multicollinearity was checked by calculating the Variance Inflation Factor (VIF) and tolerance values for each independent variable. All VIF values were below the commonly accepted threshold of 10, and tolerance values were above 0.1, indicating the absence of multicollinearity.
These results suggest that the data meet the assumptions of the classical linear regression model and are suitable for further hypothesis testing.
4.3 Regression test
Table 4 presents the main regression results, where stock market participation (proxied by log trading volume) is regressed on carbon performance and a set of control variables using fixed-effect estimation. The model includes firm and industry fixed effects to account for time-invariant heterogeneity across firms and sectors.
Table 4. Regression test
|
Variable |
Coefficient |
p-value |
|
CARBON |
0.442 |
0.093*** |
|
LEV |
-2.000 |
0.002* |
|
INS |
-1.479 |
0.010** |
|
MAN |
-1.494 |
0.468 |
|
INDP |
3.463 |
0.001* |
|
SUS |
-0.010 |
0.975 |
|
F-Statistic (Significance) |
4.610 |
0.000* |
|
Adjusted R2 |
0.196 |
|
Note: p < 0.01 (*), p < 0.05 (**), p < 0.10 (***)
The key finding is that the CARBON variable is positive and marginally significant (β = 0.442, p = 0.093), suggesting that firms listed in the LQ45 Low Carbon Leaders index tend to experience higher trading volumes. While the statistical significance is marginal, the economic significance is notable. A coefficient of 0.442 in a log-linear model implies that, on average, low-carbon firms have approximately 55.6% higher trading volume than their counterparts (i.e., e0.442 – 1 ≈ 0.556), holding other factors constant.
This result offers preliminary support for the hypothesis that low-carbon signals are positively received by investors, consistent with signaling theory. The market appears to interpret environmental leadership as a proxy for long-term credibility and value.
Among the control variables, Leverage (β = –2.000, p = 0.002) and Institutional Ownership (β = –1.479, p = 0.010) are negatively associated with trading volume, suggesting that higher financial risk and concentrated ownership may deter participation. On the other hand, Independent Commissioners (β = 3.463, p = 0.001) have a positive and significant effect, aligning with the view that strong governance enhances investor confidence.
Managerial ownership and sustainability committee do not appear to have a statistically significant effect in this model. However, the latter may still play a role in interaction effects or through industry sensitivity, as explored in later sections.
4.4 Robustness check: Trading frequency
To test the robustness of the main findings, we re-estimate the regression model using an alternative measure of market participation: the natural logarithm of trading frequency (logFREQ), which captures the number of individual transactions executed rather than the volume traded. The alternative analysis can be seen in Table 5.
Table 5. Alternative regression
|
Variable |
Coefficient |
p-value |
|
CARBON |
0.008 |
0.961 |
|
LEV |
-1.014 |
0.011** |
|
INS |
-0.439 |
0.202 |
|
MAN |
-1.018 |
0.420 |
|
INDP |
1.621 |
0.013** |
|
SUS |
0.363 |
0.059*** |
|
F-Statistic (Significance) |
3.268 |
0.006* |
|
Adjusted R2 |
0.133 |
|
Note: p < 0.01 (*), p < 0.05 (**), p < 0.10 (***)
The results show that the CARBON variable is not statistically significant in this model (p = 0.961), indicating that inclusion in the LQ45LCL index does not significantly affect trading frequency. This contrasts with the earlier result using trading volume, where a positive and economically meaningful effect was observed.
This divergence may stem from differences in how investors respond to ESG signals. Trading frequency tends to reflect the number of trades, which may remain stable even when investors adjust their transaction size. Institutional investors, who are likely the dominant participants in the LQ45 index, often trade in large blocks rather than increasing the frequency of transactions. As such, carbon-related information may influence volume but not frequency.
Additionally, because trading frequency is measured on the LQ45LCL publication date, the concentration of events around two specific days (25 July 2023 and 25 January 2024) may have reduced variability in the data. This data clustering may limit the sensitivity of frequency-based analysis in detecting investor reaction.
Nevertheless, the signs and statistical patterns of the control variables are largely consistent with prior expectations. Leverage remains negatively associated with participation, while independent commissioners and sustainability committee show positive relationships with trading frequency though the latter only at a 10% significance level.
4.5 Moderating effect of information asymmetry
To further explore the signaling mechanism, we test whether the impact of low-carbon emissions on stock market participation depends on the level of information asymmetry. Information asymmetry is proxied by the bid-ask spread in Eq. (2) [53], a widely used market-based indicator that reflects uncertainty or disagreement about a firm’s value.
$\begin{aligned} & { Bid }- { Ask\ Spread } =\frac{ { Lowest\ ask\ price }_d- { Highest\ bid\ price }_d}{ { Lowest\ ask\ price }_d+ { Highest\ bid\ price }{ }_d/2}\end{aligned}$ (2)
The main concern of signaling theory is information asymmetry reduction [28-31]. If information asymmetry exists, then information signaling cannot be done well and the stock market will give negative responses to the published information. OuYang et al. [52] suggest that information asymmetry can reduce the stock market reaction. This research argues the positive effect of low-carbon emissions on stock market participation occurs more when there is lower information asymmetry.
The interaction term between CARBON and SPREAD is introduced into the regression model. A negative coefficient on the interaction term would indicate that the effect of low-carbon signals is stronger when information asymmetry is lower (i.e., when spreads are narrower). The result can be seen in Table 6.
Table 6. Moderated regression
|
Variable |
Coefficient |
P-value |
|
CARBON |
1.044 |
0.051*** |
|
SPREAD |
-48.602 |
0.331 |
|
CARBON x SPREAD |
-348.234 |
0.002* |
|
F-Statistic (Significance) |
5.095 |
0.000* |
|
Adjusted R2 |
0.269 |
|
Note: p < 0.01 (*), p < 0.05 (**), p < 0.10 (***)
The results show that the interaction between CARBON and SPREAD is negative and highly significant (p = 0.002), indicating that the positive effect of low-carbon status on trading volume is amplified when bid-ask spreads are narrower. In other words, the sustainability signal is more effective under lower information asymmetry, when investors are better positioned to interpret the information.
This finding strongly supports signaling theory, particularly the often-underemphasized “signal reception” stage. While firms can send high-quality signals (e.g., carbon reduction disclosures), the signal’s effectiveness depends on the clarity of the market environment. Narrow bid-ask spreads create a setting where investors are more confident, analytical, and responsive leading to stronger market reactions to ESG information.
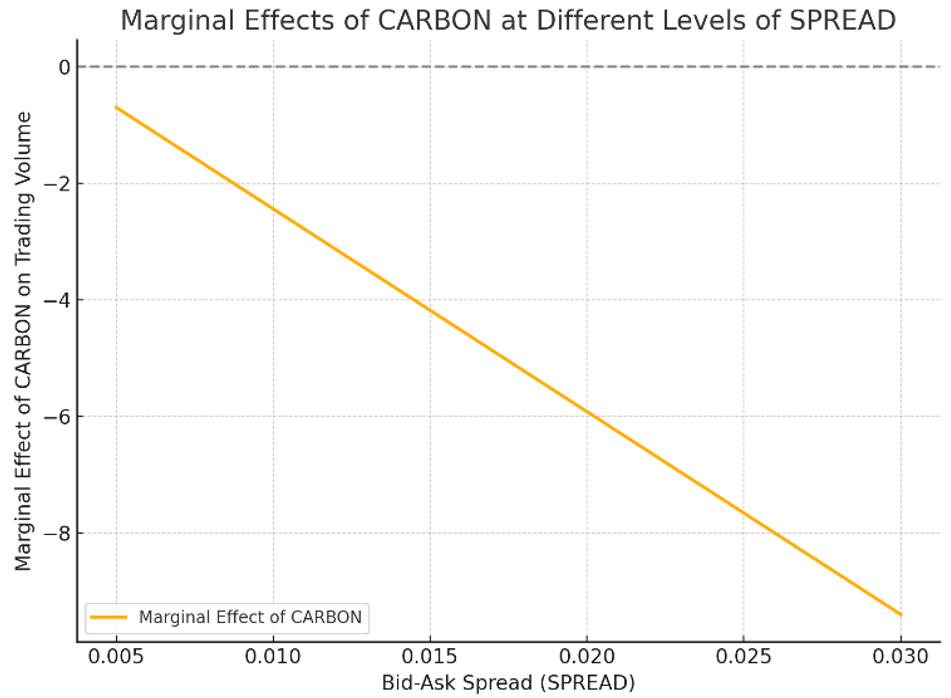
To better illustrate this interaction, Figure 2 presents the marginal effect of low-carbon status on trading volume across varying levels of bid-ask spread.
Figure 2. Marginal effect of low-carbon status on trading volume at varying levels of bid-ask spread
A marginal effects plot is recommended to visualize the moderating relationship, illustrating how the effect of CARBON on trading volume declines as SPREAD increases. This interaction reflects the conditional nature of ESG signaling in emerging markets.
4.6 Industry sensitivity analysis
To examine whether the market response to low-carbon signals differs across sectors, we conduct a sub-sample analysis based on industry carbon sensitivity. Following the Indonesia Green Taxonomy issued by the Financial Services Authority (OJK), we classify firms into: Carbon-sensitive industries, which include energy, basic materials, agriculture, land-use, and industrials sectors with high emission intensity and regulatory exposure. Non-carbon-sensitive industries, such as technology, banking, retail, and consumer goods sectors with lower direct environmental impact. An industry that contributes to high levels of carbon emission is called a carbon-sensitive industry.
Some studies find that industries that are sensitive to high levels of carbon emission have different of strategy for carbon emission reduction (e.g., [50, 54, 55]. In this case, this research aims to examine the effect of low-carbon emissions on stock market participation in different conditions of industry sensitivity. By following Financial Service Authority [39], this research determines the industries that are sensitive to high levels of carbon emission are energy, forestry, used land, and industrial. This research splits the samples into groups of samples in sensitive industry and non-sensitive industries. The result can be seen in Table 7.
Table 7. Subsample analysis by industry sensitivity
|
Subsample |
CARBON Coefficient |
p-value |
|
Non-carbon-sensitive |
0.602 |
0.020** |
|
Carbon-sensitive |
0.103 |
0.712 |
Note: p < 0.05 (**)
The results indicate that the positive effect of low-carbon emissions on trading volume is concentrated in non-carbon-sensitive industries (p = 0.020), while the effect is not significant in carbon-sensitive sectors (p = 0.712). This suggests that industry context moderates how investors interpret ESG signals.
One possible explanation is investor skepticism in carbon-intensive sectors, where ESG disclosures may be perceived as compliance-driven rather than voluntary, or vulnerable to greenwashing. In contrast, firms in low-emission sectors may face less regulatory pressure and thus their sustainability efforts are seen as more authentic, enhancing signal credibility.
These findings underscore the conditional nature of ESG signal effectiveness, aligning with signaling theory. Even a strong signal like carbon reduction may be discounted in contexts where investor trust is lower or information asymmetry is higher. Hence, industry characteristics act as an important filter in ESG signal reception.
4.7 Endogeneity test
In index of LQ45LCL, carbon performance is evaluated based on carbon emission disclosure in sustainability report. In this case, there is a possibility that carbon performance is also affected by carbon emission disclosure. This research uses two stage least square regression to anticipate the endogeneity problem where carbon emission disclosure has an effect on carbon performance. This research determines that stock market participation as dependent variable, carbon performance as independent variable, and carbon emission disclosure as instrumental variable in the two stage least square regression. The result of two stage least square regression is provided as in Table 8.
Table 8. Two stage least square regression test
|
Variable |
Coefficient |
p-value |
|
Constant |
16.834 |
|
|
CARBON |
0.690 |
0.033** |
|
LEV |
-2.167 |
0.001* |
|
INS |
-1.479 |
0.010** |
|
MAN |
-1.655 |
0.425 |
|
INDP |
3.490 |
0.001* |
|
SUS |
-0.033 |
0.916 |
|
F-Statistic (Significance) |
4.610 |
0.000* |
|
Adjusted R2 |
0.196 |
|
Note: p < 0.01 (*), p < 0.05 (**)
Table 8 shows that low-carbon emission has a coefficient of 0.690 and a significance value of 0.033 (significant in 0.05). It shows that low-carbon emission leads to higher stock market participation. The result is consistent with the main result as in Table 4.
4.8 Discussion
This research aims to the effect of low-carbon emissions on stock market participation on the stock index of the Indonesian Stock Exchange LQ45. This research contributes to extending previous studies that relate to carbon emissions and the stock market. This research also contributes to providing new evidence in Indonesia. This research can be considered by the Indonesian Stock Exchange or Financial Service Authority since there will be a launch of the carbon market in Indonesia in 2023.
Based on data analysis, low-carbon emission has a positive effect on stock market participation. Companies with low-carbon emissions attract more stock market participants to participate in stock investment. This result is consistent with Leite and Uysal [19], Nyakurukwa and Seetharam [21], Serafeim and Yoon [12], Yin et al. [20], and Xiong [56] who find that green business gives a positive reaction to the stock market. This result is also consistent with Shi et al. [27] and Alsaifi et al. [6] that find carbon emission reduction is good news for investors. In this case, companies that are included in LQ45LCL attract more stock market participation. The effect of low-carbon emissions improves stock trading volume on the Indonesian Stock Exchange.
In the context of signaling theory, companies with low-carbon emissions give a signal of company quality. The quality includes the ability of companies to have a green business. Green business proposes higher performance by providing a green market segment, energy cost efficiency, and conflict cost reduction. Green business also provides sustainability where the business contributes to future performance. High performance and sustainability contribute to giving higher stock value, return, and potential dividends to investors. In this case, it will increase stock market participation.
Further analysis, this research does not find the effect of low-carbon emissions on stock trading frequency. The effect of low-carbon emissions on stock market participation occurs more in the low information asymmetry. It confirms the signaling concept where the main objective of information is to reduce information asymmetry. Interestingly, the effect of low-carbon emissions on stock market participation occurs more for companies in the industry that are not sensitive to a high level of carbon emission.
The result only applies to companies that are listed on the index of LQ45. It implies regulator gives carbon emission evaluations not just for LQ45 companies but also for all listed companies on the Indonesian Stock Exchange. It also implies companies to improve strategies that can reduce carbon emissions.
This study examines the effect of low-carbon emissions on stock market participation within the LQ45 index of the Indonesian Stock Exchange. The analysis reveals that low-carbon emissions are positively associated with stock trading volume, indicating that investors are more inclined to engage with companies demonstrating environmental responsibility. This reflects a growing awareness of sustainability and green investment in the Indonesian capital market.
While the effect is statistically marginal (p = 0.093), its economic significance is considerable. On average, firms included in the LQ45 Low Carbon Leaders index experience approximately 55.6% higher trading volume compared to their peers. This suggests that investors do respond to carbon-related disclosures, but the strength of this response depends on contextual factors such as market transparency and industry sensitivity.
Further analysis demonstrates that the effect of low-carbon emissions on stock market participation is more pronounced when information asymmetry is low as proxied by narrower bid-ask spreads. This reinforces the signal reception perspective of signaling theory, emphasizing that the clarity and credibility of ESG communication shape investor responses. It highlights that the success of sustainability signals depends not only on signal quality but also on the transparency of the information environment in which the signal is interpreted.
This research contributes to the growing literature on ESG and financial markets in emerging economies. By demonstrating that the credibility and impact of ESG communication are contingent on the surrounding market environment, the study highlights the importance of transparency as a moderating factor in the effectiveness of sustainability disclosures.
From a theoretical perspective, this study contributes to signaling theory by demonstrating that low-carbon emissions serve as credible signals that influence stock market participation. In financial markets, firms use signals to reduce information asymmetry between internal managers and external investors. This study finds that firms with lower carbon emissions effectively communicate their commitment to sustainability, long-term risk management, and corporate responsibility, which in turn enhances investor confidence and market engagement.
Importantly, the study reveals that the effectiveness of these sustainability signals is conditional, depending on the level of information asymmetry and industry context. In industries with higher transparency or where environmental concerns are perceived as less critical, investors are more responsive to carbon reduction efforts. These findings enrich the existing literature by illustrating that ESG signals are not uniformly interpreted by the market but are shaped by market clarity and sectoral sensitivity a point that strengthens the role of the signal reception stage within the signaling process.
From a practical standpoint, the findings offer valuable implications for regulators, corporate managers, and investors. For policymakers and stock exchanges, the study suggests that the Indonesian Stock Exchange (IDX) could expand its sustainability-focused indices beyond the LQ45 to support green investment preferences. Enhancing carbon disclosure frameworks and enforcing more robust sustainability reporting standards would improve transparency and help investors better assess firm quality based on ESG criteria.
For corporate managers, these results underscore the strategic value of environmental disclosures and ESG integration. Firms that transparently communicate low-carbon initiatives and embed sustainability into their operations are more likely to gain investor trust and competitive positioning in capital markets. For investors, the findings highlight the financial relevance of ESG metrics. By integrating carbon performance and disclosure credibility into investment decisions, investors can improve portfolio sustainability and long-term value creation.
By connecting signaling theory with empirical insights from the Indonesian equity market, this study reinforces the importance of sustainability as a strategic communication tool and a determinant of investor behavior in emerging markets.
This study has several limitations that open avenues for future research. First, the analysis focuses exclusively on companies listed in the LQ45 index, due to the availability of low-carbon classification via the LQ45 Low Carbon Leaders (LQ45LCL) index. While this provides a focused lens on highly liquid and well-governed firms, it limits the generalizability of the findings. Future research should broaden the scope to include all listed companies on the Indonesian Stock Exchange (IDX), particularly small- and mid-cap firms, to assess whether the relationship between low-carbon status and market participation holds across different market segments. Incorporating a cross-sectoral perspective may also reveal how carbon signaling effectiveness varies across industries with different sustainability pressures and regulatory intensities.
Second, the study does not account for investor heterogeneity. Although we find that low-carbon firms are associated with increased trading volume, we do not identify whether this behavior is driven by institutional, retail, or foreign investors. Understanding the investor profiles behind this response would offer deeper insight into market dynamics. Future research could employ investor-level data or integrate qualitative methods such as surveys or interviews to explore the role of investor awareness, attitudes, and ESG preferences in driving trading decisions.
Additionally, several technical limitations warrant attention. The statistical significance of the main finding is marginal (p = 0.093), and the event-based research design is constrained by the availability of only two index announcement dates. Information asymmetry is proxied using only the bid-ask spread; other measures such as analyst forecast dispersion, earnings opacity, or order book depth may offer complementary insights. Future studies may improve robustness by incorporating alternative proxies and longer observation periods. While this study addresses potential endogeneity using 2SLS regression, it does not report the first-stage diagnostics for instrument strength. Future research is encouraged to include formal tests such as the first-stage F-statistic to rigorously assess the validity and relevance of the instrumental variable(s) used. Expanding the analytical scope and integrating behavioral insights would enhance the external validity of ESG signal research in emerging markets.
As this study is limited to two index announcement dates and a single ESG index (LQ45LCL), future research is encouraged to validate the robustness of these findings using extended timeframes or alternative ESG benchmarks. Expanding the analytical scope and integrating behavioral insights would enhance the external validity of ESG signal research in emerging markets. By combining firm-level indicators with investor-side perspectives, future work can provide a more holistic understanding of sustainable investing and its relevance for capital allocation, regulation, and firm strategy.
This work was supported by Pusat Pembiayaan dan Asesmen Pendidikan Tinggi (PPAPT), Kementerian Pendidikan Tinggi, Sains dan Teknologi Republik Indonesia, and Lembaga Pengelola Dana Pendidikan (LPDP) for funding this research with Master Number Beasiswa Pendidikan Indonesia (BPI) 202209090765.
[1] Mardani, A., Streimikiene, D., Cavallaro, F., Loganathan, N., Khoshnoudi, M. (2019). Carbon dioxide (CO₂) emissions and economic growth: A systematic review of two decades of research from 1995 to 2017. Science of the Total Environment, 649: 31-49. https://doi.org/10.1016/j.scitotenv.2018.08.229
[2] Larasati, R., Seralurin, Y.C., Sesa, P.V.S. (2020). Effect of profitability on carbon emission disclosure. The International Journal of Social Sciences World, 2(2): 182-195. https://www.growingscholar.org/journal/index.php/TIJOSSW/article/view/79.
[3] Egbunike, F.C., Emudainohwo, O.B. (2017). The role of carbon accountant in corporate carbon management systems: A holistic approach. Indonesian Journal of Sustainability Accounting and Management, 1(2): 90. https://doi.org/10.28992/ijsam.v1i2.34
[4] United Nations. Climate Change. (2021). Indonesia. Biennial update report (BUR). BUR3. https://unfccc.int/documents/403577.
[5] Alsaifi, K., Elnahass, M., Salama, A. (2020). Carbon disclosure and financial performance: UK environmental policy. Business Strategy and the Environment, 29(2): 711-726. https://doi.org/10.1002/bse.2426
[6] Alsaifi, K., Elnahass, M., Salama, A. (2020). Market responses to firms' voluntary carbon disclosure: Empirical evidence from the United Kingdom. Journal of Cleaner Production, 262: 121377. https://doi.org/10.1016/j.jclepro.2020.121377
[7] Broadstock, D.C., Matousek, R., Meyer, M., Tzeremes, N.G. (2020). Does corporate social responsibility impact firms' innovation capacity? The indirect link between environmental & social governance implementation and innovation performance. Journal of Business Research, 119: 99-110. https://doi.org/10.1016/j.jbusres.2019.07.014
[8] Baier, P., Berninger, M., Kiesel, F. (2020). Environmental, social and governance reporting in annual reports: A textual analysis. Financial Markets, Institutions & Instruments, 29(3): 93-118. https://doi.org/10.1111/fmii.12132
[9] Zhang, F., Qin, X., Liu, L. (2020). The interaction effect between ESG and green innovation and its impact on firm value from the perspective of information disclosure. Sustainability, 12(5): 1866. https://doi.org/10.3390/su12051866
[10] Alamillos, R.R., de Mariz, F. (2022). How can European regulation on ESG impact business globally? Journal of Risk and Financial Management, 15(7): 291. https://doi.org/10.3390/jrfm15070291
[11] Jain, M., Sharma, G.D., Srivastava, M. (2019). Can sustainable investment yield better financial returns: A comparative study of ESG indices and MSCI indices. Risks, 7(1): 15. https://doi.org/10.3390/risks7010015
[12] Serafeim, G., Yoon, A. (2022). Stock price reactions to ESG news: The role of ESG ratings and disagreement. Review of Accounting Studies. https://doi.org/10.1007/s11142-022-09675-3
[13] Lys, T., Naughton, J.P., Wang, C. (2015). Signaling through corporate accountability reporting. Journal of Accounting and Economics, 60(1): 56-72. https://doi.org/10.1016/j.jacceco.2015.03.001
[14] Yoon, B., Chung, Y. (2018). The effects of corporate social responsibility on firm performance: A stakeholder approach. Journal of Hospitality and Tourism Management, 37: 89-96. https://doi.org/10.1016/j.jhtm.2018.10.005
[15] Seth, R., Mahenthiran, S. (2022). Impact of dividend payouts and corporate social responsibility on firm value - Evidence from India. Journal of Business Research, 146: 571-581. https://doi.org/10.1016/j.jbusres.2022.03.053
[16] Dahiya, M., Singh, S., Chaudhry, N. (2023). Corporate social responsibility and dividend policy in India. Management Decision. https://doi.org/10.1108/MD-08-2022-1152
[17] Rahman, D.F. (2022). Proporsi responden pemilik investasi di perusahaan menurut kriteria ESG (April 2022). https://databoks.katadata.co.id/datapublish/2022/06/07/survei-kic-banyak-warga-berinvestasi-di-perusahaan-yang-terapkan-esg.
[18] PricewaterhouseCoopers. (2023). ESG in Indonesia: Access to finance. Oxford Business Group. https://www.pwc.com/id/en/esg/esg-in-indonesia-2023.pdf.
[19] Leite, B.J., Uysal, V.B. (2023). Does ESG matter to investors? ESG scores and the stock price response to new information. Global Finance Journal, 57: 100851. https://doi.org/10.1016/j.gfj.2023.100851
[20] Yin, X.N., Li, J.P., Su, C.W. (2023). How does ESG performance affect stock returns? Empirical evidence from listed companies in China. Heliyon, 9(5): e16320. https://doi.org/10.1016/j.heliyon.2023.e16320
[21] Nyakurukwa, K., Seetharam, Y. (2023). Investor reaction to ESG news sentiment: Evidence from South Africa. EconomiA, 24(1): 68-85. https://doi.org/10.1108/ECON-09-2022-0126
[22] Naik, P., Reddy, Y.V. (2021). Stock market liquidity: A literature review. Sage Open, 11(1): 215824402098552. https://doi.org/10.1177/2158244020985529
[23] Nyakurukwa, K., Seetharam, Y. (2022). Household stock market participation in South Africa: The role of financial literacy and social interactions. Review of Behavioral Finance. https://doi.org/10.1108/RBF-03-2022-0083
[24] Abudy, M.M. (2020). Retail investors' trading and stock market liquidity. The North American Journal of Economics and Finance, 54: 101281. https://doi.org/10.1016/j.najef.2020.101281
[25] Indonesian Stock Exchange. (2022). Guide for IDX LQ45 Low Carbon Leaders. Retrieved from https://www.idx.co.id/media/20221379/appendix-index-guide-idxlq45lcl.pdf.
[26] Bolton, P., Kacperczyk, M. (2021). Do investors care about carbon risk? Journal of Financial Economics, 142(2): 517-549. https://doi.org/10.1016/j.jfineco.2021.05.008
[27] Shi, C., Zeng, Q., Zhi, J., Na, X., Cheng, S. (2022). A study on the response of carbon emission rights price to energy price, macroeconomy, and weather conditions. Environmental Science and Pollution Research, 30(12): 33833-33848. https://doi.org/10.1007/s11356-022-24577-2
[28] Spence, M. (1973). Job market signaling. The Quarterly Journal of Economics, 87(3): 355. https://doi.org/10.2307/1882010
[29] Lee, M.T., Raschke, R.L., Krishen, A.S. (2022). Signaling green! Firm ESG signals in an interconnected environment that promote brand valuation. Journal of Business Research, 138: 1-11. https://doi.org/10.1016/j.jbusres.2021.08.061
[30] Su, W., Peng, M. W., Tan, W., Cheung, Y.L. (2016). The signaling effect of corporate social responsibility in emerging economies. Journal of Business Ethics, 134(3): 479-491. https://doi.org/10.1007/s10551-014-2404-4
[31] Connelly, B.L., Certo, S.T., Ireland, R.D., Reutzel, C.R. (2011). Signaling theory: A review and assessment. Journal of Management, 37(1): 39-67. https://doi.org/10.1177/0149206310388419
[32] Haque, F., Ntim, C.G. (2018). Environmental policy, sustainable development, governance mechanisms and environmental performance. Business Strategy and the Environment, 27(3): 415-435. https://doi.org/10.1002/bse.2007
[33] Gerged, A.M., Matthews, L., Elheddad, M. (2021). Mandatory disclosure, greenhouse gas emissions and the cost of equity capital: UK evidence of a U-shaped relationship. Business Strategy and the Environment, 30(2): 908-930. https://doi.org/10.1002/bse.2661
[34] Choi, B., Luo, L. (2021). Does the market value greenhouse gas emissions? Evidence from multi-country firm data. The British Accounting Review, 53(1): 100909. https://doi.org/10.1016/j.bar.2020.100909
[35] Haque, F., Ntim, C.G. (2020). Executive compensation, sustainable compensation policy, carbon performance and market value. British Journal of Management, 31(3): 525-546. https://doi.org/10.1111/1467-8551.12395
[36] Adu, D.A., Flynn, A., Grey, C. (2023). Carbon performance, financial performance and market value: The moderating effect of pay incentives. Business Strategy and the Environment, 32(4): 2111-2135. https://doi.org/10.1002/bse.3239
[37] Ahmed, F., Ali, I., Kousar, S., Ahmed, S. (2022). The environmental impact of industrialization and foreign direct investment: Empirical evidence from Asia-Pacific region. Environmental Science and Pollution Research, 29(20): 29778-29792. https://doi.org/10.1007/s11356-021-17560-w
[38] Lamb, W.F., Wiedmann, T., Pongratz, J., Andrew, R., et al. (2021). A review of trends and drivers of greenhouse gas emissions by sector from 1990 to 2018. Environmental Research Letters, 16(7): 073005. https://doi.org/10.1088/1748-9326/abee4e
[39] Financial Services Authority. (2022). Indonesia Green Taxonomy Edition 1.0. https://ojk.go.id/id/berita-dan-kegiatan/info-terkini/Documents/Pages/Taksonomi-Hijau-Indonesia-Edisi-1---2022/Taksonomi%20Hijau%20Edisi%201.0%20-%202022.pdf.
[40] Muhamad, N. (2022). 10 negara penghasil emisi karbon dioksida (CO₂) dari sektor energi terbesar di dunia (2022). Retrieved from https://databoks.katadata.co.id/datapublish/2023/08/11/indonesia-salah-satu-penghasil-emisi-karbon-sektor-energi-terbesar-global-pada-2022.
[41] Teske, S., Nagrath, K. (2022). Global sector-specific Scope 1, 2, and 3 analyses for setting net-zero targets: Agriculture, forestry, and processing harvested products. SN Applied Sciences, 4(8): 221. https://doi.org/10.1007/s42452-022-05111-y
[42] Jha, A., Samudra, A. (2020). A study on retail investors asset choices and its association with demographic parameters. Shodh Sarita, 7(25): 30-37.
[43] Ioannou, I., Serafeim, G. (2015). The impact of corporate social responsibility on investment recommendations: Analysts' perceptions and shifting institutional logics. Strategic Management Journal, 36(7): 1053-1081. https://doi.org/10.1002/smj.2268
[44] Kaustia, M., Conlin, A., Luotonen, N. (2023). What drives stock market participation? The role of institutional, traditional, and behavioral factors. Journal of Banking & Finance, 148: 106743. https://doi.org/10.1016/j.jbankfin.2022.106743
[45] Koosakul, J., Shim, I. (2021). The effects of asset price volatility on market participation: Evidence from the Thai foreign exchange market. Journal of Banking & Finance, 124: 106036. https://doi.org/10.1016/j.jbankfin.2020.106036
[46] Borowiecki, K.J., Dzieliński, M., Tepper, A. (2023). The great margin call: The role of leverage in the 1929 Wall Street crash. Economic History Review, 76(3): 807-826. https://doi.org/10.1111/ehr.13213
[47] Lindner, F., Kirchler, M., Rosenkranz, S., Weitzel, U. (2021). Social motives and risk-taking in investment decisions. Journal of Economic Dynamics and Control, 127: 104116. https://doi.org/10.1016/j.jedc.2021.104116
[48] Gabaix, X., Gopikrishnan, P., Plerou, V., Stanley, H.E. (2006). Institutional investors and stock market volatility. The Quarterly Journal of Economics, 121(2): 461-504.
[49] Fabisik, K., Fahlenbrach, R., Stulz, R.M., Taillard, J.P. (2021). Why are firms with more managerial ownership worth less? Journal of Financial Economics, 140(3): 699-725. https://doi.org/10.1016/j.jfineco.2021.02.008
[50] Kılıç, M., Kuzey, C. (2019). The effect of corporate governance on carbon emission disclosures: Evidence from Turkey. International Journal of Climate Change Strategies and Management, 11(1): 35-53. https://doi.org/10.1108/IJCCSM-07-2017-0144
[51] Orazalin, N.S., Ntim, C.G., Malagila, J.K. (2023). Board sustainability committees, climate change initiatives, carbon performance, and market value. British Journal of Management. https://doi.org/10.1111/1467-8551.12715
[52] OuYang, Z., Xu, J., Wei, J., Liu, Y. (2017). Information asymmetry and investor reaction to corporate crisis: Media reputation as a stock market signal. Journal of Media Economics, 30(2): 82-95. https://doi.org/10.1080/08997764.2017.1364256
[53] Siew, R.Y.J., Balatbat, M.C.A., Carmichael, D.G. (2016). The impact of ESG disclosures and institutional ownership on market information asymmetry. Asia-Pacific Journal of Accounting & Economics, 23(4): 432-448. https://doi.org/10.1080/16081625.2016.1170100
[54] Siddique, M.A., Aljifri, K., Hossain, S., Choudhury, T. (2023). Effect of market-based regulations on corporate carbon disclosure and carbon performance: Global evidence. Journal of Applied Accounting Research. https://doi.org/10.1108/JAAR-08-2022-0215
[55] Desai, R. (2022). Determinants of corporate carbon disclosure: A step towards sustainability reporting. Borsa Istanbul Review, 22(5): 886-896. https://doi.org/10.1016/j.bir.2022.06.007
[56] Xiong, J.X. (2021). The impact of ESG risk on stocks. The Journal of Impact and ESG Investing, 2(1): 7-18. https://doi.org/10.3905/jesg.2021.1.025