Abdul Wahid Hasyim*![]() | Intan Astritya Anggraini
| Intan Astritya Anggraini![]() | Fadly Usman
| Fadly Usman![]() | Andik Isdianto
| Andik Isdianto![]()
© 2025 The authors. This article is published by IIETA and is licensed under the CC BY 4.0 license (http://creativecommons.org/licenses/by/4.0/).
OPEN ACCESS
This study aims to evaluate the effectiveness of Object-Based Image Analysis (OBIA) in classifying high-resolution satellite and drone imagery, and its application in mapping the distribution of Land Surface Temperature (LST) in Malang City parks. Malang was chosen because of its unique urban dynamics and the challenges faced in managing the urban heat island effect. Using data from thermal UAVs, this study provides a detailed analysis of urban microscale green spaces. OBIA is applied to classify areas based on surface material and vegetation, resulting in an accurate mapping of LST variations. The results show that areas with dense vegetation such as Merdeka Square Park have lower LST values, while areas with hard surfaces such as asphalt and concrete show higher LST values. This study reveals that 22.13% of the area has very low temperatures (31-36℃) and 30.05% with high temperatures (46-51℃). The implications of these results are very relevant for policy development, showing that increasing urban green space, planting wide canopy trees, using environmentally friendly materials, and adding water elements have a significant impact on reducing the urban heat island effect and increasing thermal comfort. These recommendations can be integrated into the urban planning strategy of Malang and other cities with similar characteristics to support the sustainability of the urban environment globally.
climate mitigation, LST, OBIA, remote sensing, urban green spaces, unmanned aerial vehicles (UAV)
The phenomenon of LST change is an important issue in urban environmental studies. High LST can affect people's quality of life, health and urban ecosystems. Through an in-depth understanding of the distribution of LST and the factors that influence it, it can help in planning a more sustainable city in the future, especially in the context of climate management efforts.
Urban areas are complex and dynamic ecosystems [1] that have a higher growth rate than the surrounding areas [2]. This growth is characterized by the high conversion of undeveloped land into built-up land, which if done without proper supervision and planning, can have detrimental effects including microclimate change [3]. Malang City has shown the effects of climate change, which is characterized by an increase in the average LST of more than 2℃ in the period 1997-2018 [4]. Given the conditions of population growth every year in Malang City which has an impact on increasing land conversion, it can be predicted that the average LST will also increase in the following years.
Urban parks are a major component of urban carrying capacity that can directly affect the microclimate [5]. Meanwhile, the quality of existing city parks in Malang City has not shown an optimal function as a whole, especially in the ecological aspect due to the lack of vegetation elements [6]. Among other things, this is indicated by the availability of vegetation components that are still not comprehensive, which is felt by visitors through the existence of areas with high temperatures during the day, especially in Merdeka Square Park in locations that have not been shaded by vegetation [7]. So that the analysis to determine the condition of the distribution of land cover material types and the distribution of LST in RTH is important to assess whether the study site is in the temperature category that can be tolerated by visitors, which can have an impact on the productivity and comfort of visitors in the park.
To determine the classification of land cover material and the distribution of LST, remote sensing technology is used. One of the tools from remote sensing that is starting to be widely applied for data collection is an UAV or drone. The use of UAVs in remote sensing is more effective for obtaining data that is more detailed, real time, fast, and cheaper. In addition, the images obtained are also cloud-free so that the images formed can be processed with better results [8]. However, it is still rare to apply the OBIA combination in land mapping using drones [9].
After obtaining the output of drone image processing in the form of RGB images, the image classification stage is then carried out into several classes based on the type of land cover material using the OBIA method. The OBIA approach has been shown to be more effective than pixel-based classification techniques in extracting features from ultra-high-resolution imagery through its ability to distinguish patterns among the complexity of urban landscapes. OBIA can classify images according to the shape, color, and feature characteristics of groups of pixels, resulting in image objects that are more in line with the physical landscape of the feature [10]. As for the LST distribution data obtained through data processing in the form of samples of thermal points captured by thermal cameras on drones using the kriging method. The kriging method is basically to process data samples in the form of points or points into distribution or raster data.
The objectives of this research include classifying the type of land cover material in several city parks in Malang City using the OBIA method along with the distribution of LST values through remote sensing methods by utilizing high-resolution UAV imagery and the OBIA method. Then further analysis was carried out to identify factors that influence LST variations. The results of this study are expected to provide useful information for urban spatial planning and environmental management in Malang City.
The hypothesis or basic assumption by researchers is that the average LST is higher in Merdeka Square Park. While Merbabu City Park has an average LST below Merdeka Square Park and Malabar City Forest has the lowest average LST. This is due to the intensity of the type of built land use and community activities that are more crowded and dense in Merdeka Square Park. Meanwhile, Merbabu Park and Malabar Forest will have an average LST value that tends to be lower because the type of land cover around them is residential with community movements that are not as busy as Merdeka Square Park.
2.1 Study area and data collection
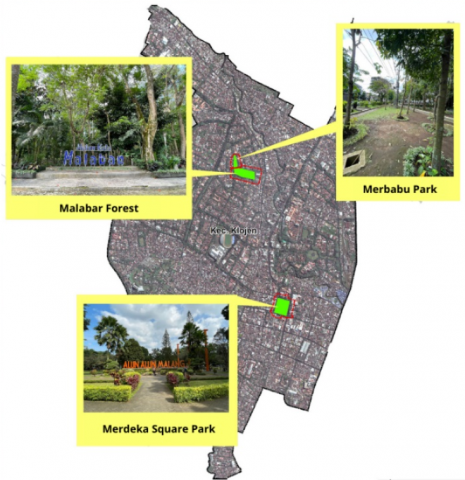
This research was conducted in Malang City, especially in the three RTH areas, namely Merdeka Square Park, Merbabu Park, and Malabar Forest (Figure 1). The selection of the three locations is because the three green spaces are located in Klojen District which is the central area of Malang City and has a large number of visitors, especially in Merdeka Square Park.
Figure 1. Research location map
The data used in this study comes from data captured by visual cameras and thermal cameras on Mavic 2 Enterprise Dual drones. The data collection time in this study was carried out in one observation time on October 5, 2023 at 10:00 WIB. The tools used in processing image data in this study include eCognition Developer 64 software for OBIA analysis and ArcGIS software for spatial data analysis.
The research variables are land cover classification and LST. The stages of the analysis method in this research broadly consist of three discussion substances. The three stages of research analysis are as follows:
1) Object Classification with OBIA
OBIA classification is basically done by classifying pixels in the image into segments based on the similarity of spectral and spatial characteristics. The segmentation stage is processed automatically by the eCognition Developer 64 software with a level of pixel detail that can be adjusted by the user.
2) LST Extraction
LST distribution data in the form of raster data is then converted to vector data to identify the thermal value at each pixel so that further analysis can be carried out related to the condition of each study location based on the LST distribution value.
3) LST Pattern Analysis
The LST distribution pattern that has been formed is then further analyzed using statistical and spatial techniques to find out information in the form of factors that can affect the LST pattern at the study site using ArcGIS 10.4.1, QGIS, and Microsoft Excel software.
2.2 UAV image characteristics
Technological advances in the utilization of drones or UAVs and radiometric thermal cameras are technologies that can be used to capture ground surface temperatures at sub-meter spatial resolution that can accurately reflect detailed ground surface temperatures in urban environments [11]. Drones with appropriate cameras and sensors can generate thermal data with spatial and temporal resolution suitable for thermal ecology investigations. This technological innovation has been widely applied to microclimate studies recently. UAVs or drones equipped with visual and thermal infrared (TIR) cameras can produce high-resolution images that can be processed through mapping software to obtain visual images accompanied by high-resolution thermal data [12]. The advantages of utilizing unmanned aircraft or drones over manned aircraft in obtaining TIR data include higher reliability, lower cost, smaller dimensions, and better flexibility [13]. Lower drone altitudes can produce more objects than drones flying higher. The flight altitude of the drone can significantly affect the number of land use objects that can be classified [9].
In general, thermal data processing techniques by utilizing images from thermal drones are by processing images using Agisoft Metashape and ESRI ArcMap to combine thermal drone images into orthomosaics. Then, correct the temperature and emissivity values and proceed to extract the surface temperature data for analysis. Emissivity is a measure of how well a material can emit energy as thermal radiation. Different materials have different emissivity values depending on their surface properties [11].
2.3 OBIA
OBIA is an image classification approach that involves consideration of the spectral and spatial aspects of objects. In OBIA, emphasis is given to the unity of the object based on its color and texture. There are two main stages in OBIA, namely segmentation and classification. Segmentation is a method in object-based classification that groups phenomena into regions of uniform size [8].
The OBIA method is widely used in land cover mapping that requires accuracy in classifying land. Some of the advantages of the OBIA method as a land classification technique are as follows.
The application of the OBIA method in this study uses eCognition Developer 64 software. This method is considered more accurate than pixel-based classification in classifying land cover, especially in micro-scale research. The classification results in the form of the distribution of land cover material types at the study site were then interpreted to determine the percentage of each material type area and compared with the existing LST conditions at that location.
The data used in this research is entirely sourced from the use of satellite imagery via remote sensing methods. The satellite imagery used is Landsat 8 OLI/TIRS for LST distribution data and Sentinel-2 satellite imagery for NDBI and NDVI data. These two satellite images are images with moderate or medium spatial resolution and have been widely used by researchers, especially in urban environmental studies.
2.4 Accuracy test
The selection of samples with high representation is very important in assessing the accuracy of land cover classification [14]. The assessment of land cover classification accuracy in this study used the confusion matrix method through the kappa coefficient. To validate, testing was carried out with ground checks at sample points distributed using the stratified random sampling method. Testing of sample points was carried out using high-resolution imagery taken by drones. Accuracy test sampling was determined based on the number of land cover classes. This study has 10 to 11 land covers so it is recommended to test using a sample of 8n where n is the number of classes. So in this study, the minimum number of accuracy test samples is 88 sample points. The value of the kappa coefficient ranges from -1 to 1. The higher the kappa coefficient value, the better the chance of accuracy [15].
2.5 LST
LST can be defined as the average temperature of a surface area represented in pixel units with various surface types present. Every object generates heat as a result of the random motion of its particles. This motion causes collisions between particles in the object, resulting in an increase in temperature and heat emission from the object's surface [16]. Each pixel has diverse emissivity values due to the heterogeneity of urban landscapes such as landscape variations and surface cover complexity. Researchers have estimated different emissivity values of vegetation, built-up areas, and soil in urban landscapes that are affected by temperature, wavelength, evaporation, transpiration, albedo, and land conditions such as soil moisture and surface texture [17].
In the context of open land, the ground surface temperature is the temperature at the outermost layer of the soil surface. As for land covered by vegetation, the surface temperature is generally at the plant canopy and in water bodies, the surface temperature is at the water surface [18]. LST data is obtained by remote sensing methods through processing thermal drone data samples. Thermal remote sensing technology uses infrared waves to calculate surface temperature. In thermal remote sensing, the radiation emitted by the object is then measured to estimate the Earth's surface temperature distribution data. Thermal data samples that have been captured by drones are then processed in ArcGIS 10.4.1 with the kriging method to get the results in the form of a raster of LST distribution at the study site.
Kriging interpolation technique is a predictive assessment technique to estimate values at unsampled points based on information from the characteristics of sampled points in the surrounding area. In the context of thermal data processing, this method is useful for predicting the spatial distribution of temperature based on limited measurement sample points. The type of kriging method used is ordinary kriging which assumes that the temperature value in an area is the result of local variations and is commonly used in air temperature interpolation. This technique considers spatial correlation between data using a variogram [15]. The variogram in the kriging technique can be determined by the following equation.
$y(h)=\frac{1}{2 n} \sum_{i=1}^{n(h)}\{Z\left( {{x}_{i}} \right)-Z{{({{x}_{i}}+h\}}^{2}}$
Explanation:
y(h) = variogram value for distance h
n(h) = number of pairs of points that are h apart
Z(xi) = temperature value at location xi
Z(xi+h) = temperature value at another location that is a distance h from xi
The smaller the value of y(h), the more similar the values between adjacent points. There are several parameters needed to describe the semivariogram.
3.1 Image classification with OBIA
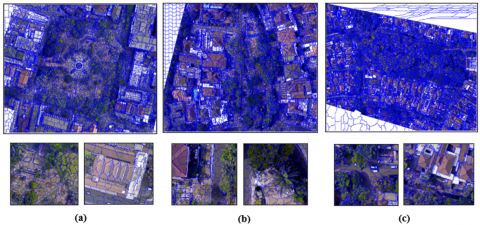
Object classification using the OBIA method produces a map of the distribution of land cover material classifications in the city park area and its surroundings. Pada penelitian ini, metode OBIA digunakan dengan software eCognition Developer 64. The following are the segmentation stages of OBIA shown in Figure 2.
Based on Figure 2, the segmentation results can be seen in the form of grouping pixels that have similar color and texture characteristics into groups of segments. The level of detail of the formed segment can be set by the user according to their needs. The setting is in the 'multiresolution segmentation' tool by filling in the numbers freely, generally ranging from 30-200 but can be adjusted according to needs. For this study, a segment detail level of 50 to 100 was used to adjust to the differences in the scale of the three study locations. The determination of the use of the segment detail level is because, at that number, the segments produced have been able to group pixels with the same characteristics so that they are able to classify different objects in the image. After the segments are formed, the classification stage is carried out by creating training samples based on segments from each land cover class. The more training samples that are formed, the better and more accurate the classification results will be. To get the best classification results in this study, users create as many training samples as possible in almost all segments. This aims to reduce the occurrence of classification reading errors by the software system so that the classification results will be better. After completing the training sample, the software system then performs the classification process with the ‘classification’ tool. To increase the accuracy of the classification results, this software also offers editing options by users for segments that have misclassification. These results show that the use of the OBIA method is effective in classifying high-resolution images because errors in classification results can be minimized because users have control in selecting training samples and editing classification results that have been formed by the system.
Figure 2. OBIA segmentation (a) Segment of Merdeka Square Park (b) Segment of Merbabu Park (c) Segment of Malabar Forest
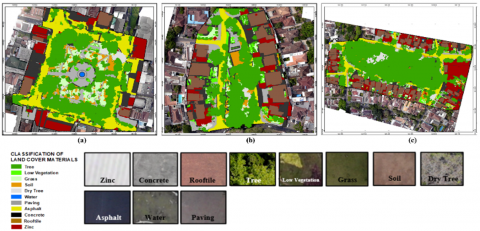
Figure 3. Classification of land cover materials (a) Classification of Merdeka Square Park (b) Classification of Merbabu Park (c) Classification of Malabar Forest Segment
After obtaining the classification results, a validation test was carried out on the level of land cover classification accuracy at the third location with the kappa coefficient. The sample points used were 90 points per research location which were distributed using stratified random sampling. The kappa accuracy values in this study were 0.93 for Taman Alun-Alun Merdeka, 0.93 for Taman Merbabu, and 0.91 for Hutan Malabar. The values of the three kappa coefficients are in the range of 0.81-0.99 so that they are categorized as having a very good chance of accuracy according to Landis and Koch (1977) in the study of Nishar et al. [15]. The following are the results of the system classification after sampling several segments based on the class of land cover material types in the three parks and city forests and several surrounding areas in Malang City, shown in Figure 3.
Based on Figure 3, it shows that there are variations in the land cover of the three study sites. Basically, land cover types are classified into built-up land, vegetation and water. However, in this study, a more detailed classification is carried out based on the type of material. The following is the area of each type of land cover from the three study locations in the form of areas within RTH and some of the surrounding areas. The area and percentage of land cover materials can be seen in Tables 1-3.
Based on the tables, it is known that the extent of material types in the three study locations varies. Inside the RTH area, it is dominated by vegetation, especially trees, as indicated by the large percentage of area compared to other types of land cover. Meanwhile, outside the RTH area is dominated by built materials such as roof tiles, concrete, and asbestos due to land use in the form of residential areas.
Table 1. Land cover materials area of Merdeka Square Park
|
Number |
Materials |
Area (m2) |
Percentage (%) |
|
1. |
Tree |
20475.17 |
34.92 |
|
2. |
Low Vegetation |
473.04 |
0.81 |
|
3. |
Grass |
3081.26 |
5.25 |
|
4. |
Ground |
1984.00 |
3.38 |
|
5. |
Dry Tree |
1100.19 |
1.88 |
|
6. |
Asphalt |
10769.66 |
18.37 |
|
7. |
Paving |
5525.33 |
9.42 |
|
8. |
Concrete |
7879.20 |
13.44 |
|
9. |
Rooftile |
2207.31 |
3.76 |
|
10. |
Zinc |
5059.76 |
8.63 |
|
11. |
Water |
79.34 |
0.14 |
|
Total |
58634.26 |
100.00 |
|
Table 2. Land cover materials area of Merbabu Park
|
Number |
Materials |
Area (m2) |
Percentage (%) |
|
1. |
Tree |
5477.82 |
33.77 |
|
2. |
Low Vegetation |
542.36 |
3.34 |
|
3. |
Grass |
507.10 |
3.13 |
|
4. |
Ground |
453.35 |
2.79 |
|
5. |
Dry Tree |
170.94 |
1.05 |
|
6. |
Asphalt |
1142.22 |
7.04 |
|
7. |
Paving |
1072.34 |
6.61 |
|
8. |
Concrete |
2270.91 |
14.00 |
|
9. |
Rooftile |
3368.63 |
20.77 |
|
10. |
Zinc |
1217.08 |
7.50 |
|
Total |
16222.75 |
100.00 |
|
Based on the identification results of the condition of the distribution of land cover material types in the three green spaces using the OBIA method. It shows effective classification results. This is because the OBIA method can produce a classification of 10 to 11 classes with a high level of detail at the micro research scale. The segmentation stage in the OBIA method can classify each pixel based on color and texture into segments which are then classified in a supervised classification or control by the user so that the classification results formed can be adjusted to the wishes of the researcher to get the best results. Based on these results, the researcher considers that the OBIA method is effective in classifying objects that require a high level of detail.
Table 3. Land cover materials area of Malabar Forest
|
Number |
Materials |
Area (m2) |
Percentage (%) |
|
1. |
Tree |
26386.05 |
47.74 |
|
2. |
Low Vegetation |
861.28 |
1.56 |
|
3. |
Grass |
1111.39 |
2.01 |
|
4. |
Ground |
1063.14 |
1.93 |
|
5. |
Dry Tree |
1375.56 |
2.49 |
|
6. |
Asphalt |
3588.56 |
6.49 |
|
7. |
Paving |
1957.51 |
3.54 |
|
8. |
Concrete |
3925.57 |
7.10 |
|
9. |
Rooftile |
7644.91 |
13.83 |
|
10. |
Zinc |
7335.07 |
13.27 |
|
11. |
Water |
23.12 |
0.04 |
|
Total |
55272.16 |
100.00 |
|
3.2 LST distribution
LST data in this study is sourced from high-resolution images as a result of processing of samples captured by thermal cameras on drones. The pixel accuracy of the LST data at the three study sites reached 10 to 100 cm. The pixel size indicates a much higher quality compared to satellite imagery. The following is the LST value classification of the locations shown in Figure 4.
Figure 4. Classification of LST value (a) LST classification of Merdeka Square Park (b) LST classification of Merbabu Park (c) LST classification of Malabar Forest
Based on Figure 4, it is known that the pattern of LST distribution when viewed from high-resolution images shows diverse variation details. This shows that high-resolution imagery is relevant when conducting LST analysis studies on the complexity of urban elements, especially micro-scale research such as green spaces. In addition, it is also known that within the RTH area generally tends to have low LST values due to the dominance of land cover in the form of vegetation. Meanwhile, the area outside the RTH has a higher LST value. Based on calculations with tools on QGIS, the results show that the average LST in the Merdeka Square Park area is 38.79℃, Merbabu Park is 35.33℃, and Malabar Forest is 33.18℃. The percentage of each LST class in each study location can be seen in Tables 4-6.
Table 4. LST classification value of Merdeka Square Park
|
No. |
Temperature Interval (℃) |
Number of DNs (pixels) |
Percentage (%) |
|
1. |
31 – 36 (Very Low) |
1297913 |
22.13 |
|
2. |
36 – 41 (Low) |
1171883 |
19.98 |
|
3. |
41 – 46 (Medium) |
1390517 |
23.71 |
|
4. |
46 – 51 (High) |
1762343 |
30.05 |
|
5. |
51 – 56.44 (Very High) |
242089 |
4.13 |
|
Total |
5864745 |
100.00 |
|
Table 5. LST classification value of Merbabu Park
|
No. |
Temperature Interval (℃) |
Number of DNs (pixels) |
Percentage (%) |
|
1. |
31-37 (Very Low) |
7010 |
32.94 |
|
2. |
37-43 (Low) |
7023 |
33.00 |
|
3. |
43-49 (Medium) |
6236 |
29.30 |
|
4. |
49-55 (High) |
944 |
4.43 |
|
5. |
55-60.98 (Very High) |
70 |
0.33 |
|
Total |
21283 |
100.00 |
|
Table 6. LST classification value of Malabar Forest
|
No. |
Temperature Interval (℃) |
Number of DNs (pixels) |
Percentage (%) |
|
1. |
30-36 (Very Low) |
24035 |
40.32 |
|
2. |
36-42 (Low) |
9456 |
15.86 |
|
3. |
42-48 (Medium) |
20229 |
33.94 |
|
4. |
48-54 (High) |
5809 |
9.75 |
|
5. |
54-60.89 (Very High) |
81 |
0.13 |
|
Total |
59610 |
100.0 |
|
Based on the tables above which show the classification of LST distribution in Merbabu Park and Malabar Forest, there is a dominance of the very low LST category. It can be observed in Figure 4 that both locations are dominated by dark green and light green colors. Especially in the area inside the RTH. Unlike the case with Merdeka Square Park which is dominated by the high LST category. This is partly due to the absence of overall vegetation shading in the Merdeka Square Park area and the use of land cover materials that are solar radiation transmitting materials such as paving, land cover that is a solar radiation transmitting material such as paving.
3.3 Correlation between land cover materials and LST
In this study, the relationship between land cover area and LST distribution pattern in urban parks in Malang City was analyzed using OBIA method. Data were taken from three main parks: Merdeka Square Park, Merbabu Park, and Malabar Forest. Each park showed variations in the type and extent of land cover that influenced the LST distribution pattern. A detailed discussion of these relationships follows.
3.3.1 Merdeka Square Park
In Merdeka Square Park, trees dominate the land cover with 34.92% of the total area. These trees contribute significantly in lowering LST due to their ability to absorb and reflect solar radiation and provide effective shading. Low vegetation and grass, although only covering 0.81% and 5.26% of the total area, also help to lower the temperature through the process of evapotranspiration.
Hard materials such as asphalt (18.37%), paving (9.42%), and concrete (13.44%) absorb and re-emit heat radiation, increasing the LST in the area. The surface temperature distribution in this park shows significant variations, with areas dominated by vegetation showing lower LST, while areas with hard materials show higher LST. For example, the LSTs in the tree-dominated areas were in the very low to low temperature category, while the areas with asphalt and concrete showed high to very high temperatures. It can therefore be seen that the type of land cover material, which can generally be divided into vegetation and building material, has a direct influence on the LST value.
3.3.2 Merbabu Park
Merbabu Park has a dominance of trees reaching 33.77% of the total area, which contributes greatly in lowering LST. Low vegetation and grass cover 3.34% and 3.13%, respectively, helping to lower the temperature albeit on a smaller scale. Hard materials such as concrete (14.00%) and paving (6.61%) contribute to the increase in LST due to their high heat-absorbing capacity.
The distribution of LST in Merbabu Park shows that areas with many trees and vegetation tend to have lower temperatures. In contrast, areas with hard materials show higher temperatures. Very low LST is dominated by areas with trees and vegetation, while high LST is dominated by areas with concrete and paving.
3.3.3 Malabar Forest
Malabar Forest has the highest percentage of trees among the three parks, at 47.74%, which contributes significantly to lowering LST. Low vegetation and grass cover 1.56% and 2.01% of the total area, helping to keep temperatures low. The presence of hard materials such as concrete (7.10%) and paving (3.54%) is present in this park, but their effect on increasing LST is less significant compared to the dominance of vegetation.
The distribution of LST in Malabar Forest shows that areas with tree dominance have very low to low temperatures. Materials such as zinc/asbestos (13.27%) and roof tiles (13.83%) which have a high heat storage capacity show a higher LST, although their area is smaller compared to vegetation.
3.4 Increasing urban green spaces
Based on the results of this research study, it was found that variations in land cover, especially the variables of land cover material type, density of built-up land, and the presence of vegetation components are the main factors that can affect LST distribution patterns, especially in urban areas. Areas with high building density and not accompanied by the presence of sufficient vegetation tend to have higher LST values. Higher vegetation density and proximity to water bodies play an important role in moderating LST, leading to cooler summers and warmer winters [19]. Areas with low vegetation trigger an increase in LST, while areas with dense vegetation trigger a decrease in LST [20].
The main factor affecting the decrease or increase of LST as studied in this research is the types of materials that make up the land surface or ground cover. Different types of materials can have different effects on LST [21]. That is because the type of ground cover will affect the reflectivity of the sun that falls on the surface. The reflectivity of solar radiation can then cause an increase or decrease in temperature around the area [22].
Based on the results of this research study, it can be seen that the types of land cover materials that have the ability to reflect solar radiation or low albedo are vegetation components such as trees, grass, ornamental plants. It is as shown in the results of data processing that the value of LST distribution on vegetation components is in the very low to low LST category. While the types of land cover materials that have the ability to reflect solar radiation or large albedo are building material components such as paving, concrete, asphalt, roof tiles, and asbestos. This is characterized by a large distribution of LST values on these land cover components. Solar radiation that reaches the material will heat the pavement surface and then heat the air temperature above it [23].
3.5 Recommendations for sustainable city park design
The following is a further explanation of the types of land cover materials and their ability to reduce or increase LST values:
1) Planting Trees with Broad Canopies
Basically, the type of vegetation planted will also affect the surrounding LST conditions. The characteristics of vegetation with high crown density will be more effective in reducing the temperature under and around trees. Trees have the potential for long-term CO2 storage compared to non-woody vegetation or other than trees. So in an effort to reduce the ambient temperature of an area can be done by planting trees with wide and dense crown characteristics to reduce the intensity of solar radiation entering the inside. Plants with higher canopy density have a larger surface area for evapotranspiration and provide more shade, resulting in a greater temperature reduction than trees with lower canopy density [24].
Selecting plants with thick canopies, dense leaves, and high canopy density values can contribute significantly to cooling, humidification, and shading, thereby increasing human comfort in understory vegetation with lower canopies [25]. Trees with wide and dense crowns can retain, reflect, absorb and filter solar radiation [26].
The vegetation planted in the three study sites has a variety of species. However, all three tend to be dominated by Banyan Trees, Mahogany Trees, Kiara Payung Trees, Ketapang Trees, and Trembesi Trees. These trees are characterized by trees that have wide crowns so that they can provide maximum shade and can effectively affect the quality of the surrounding microclimate [27]. The quality of vegetation components in the three study sites can be proven by the presence of significantly lower LST distribution in the land cover in the form of trees, which indicates that the trees in the three RTH areas have the ability to reduce temperature, increase humidity, and ward off solar radiation.
Conversely, vegetation characteristics that should be avoided to be planted especially in the RTH area are plants that do not have the ability to effectively absorb solar radiation so that they are unable to reduce the heat around them and can actually produce a lot of air pollutants or toxic gases. Among these types of vegetation are sea cypress trees, bamboo trees, several varieties of pine trees, and desert plants. Trees characterized by slender trunks, small leaves and habitats in hot and dry climates tend to be ineffective in reducing temperatures. Slender trunks bend more easily and are more susceptible to mechanical damage during strong winds, potentially limiting their ability to provide consistent shade and cooling effects [28, 29]. In addition, trees with small leaves may have higher transpiration rates during the day, leading to increased water loss and potentially reduced cooling effects in hot and dry conditions [30].
The location of additional vegetation in each park also needs to be considered, especially in areas that are not yet shaded by trees. Areas that have not been shaded by trees will have an impact on high LST values, especially in areas that are built material. In Merdeka Square Park, additional vegetation can be added, especially in the middle of the park because the area uses paving material and has not been shaded by trees, while the area is also one of the areas with a high level of visitor crowds because visitors can carry out various activities such as playing, sitting, feeding birds, and so on.
In Merbabu Park, additional vegetation can be done in the northern part of the park because the area uses built materials such as paving and concrete and has not been shaded by trees so that it provides a heat effect due to high LST values in the area, especially during the day. Meanwhile, Malabar Forest basically has sufficient quantity and quality of vegetation. The vegetation in Malabar Forest has shaded the entire urban forest area so that it can provide comfort for visitors to do activities in the urban forest as a whole.
2) Use of Eco-Friendly Materials
Buildings materials can essentially increase the temperature of the surrounding area due to their higher reflectivity of solar radiation, resulting in a heat effect on the surroundings. Materials commonly used in urban environments, such as concrete, asphalt, and stone, have been identified as contributors to the urban heat island effect due to their ability to absorb and retain solar energy, which then releases it as heat [31]. Materials with low heat reflection capacity and high heat absorption rates, such as asphalt pavement, can contribute to increased surface temperatures in urban areas during summer [32].
Therefore, in green space areas, it is better to reduce the use of building materials such as concrete and paving to environmentally friendly ground cover materials. Compared to using these material components, it is better to replace them with grass, grass blocks, and ornamental plants because grass is one of the ground cover plants that can absorb solar heat. Grass has the ability to break down carbon dioxide into oxygen. Although grass is a type of low plant, at least the surface temperature in areas covered by grass is lower than other materials [33]. In addition, there are also several methods that can be done to modify building materials to help reduce the urban heat island phenomenon and improve thermal comfort in urban areas based on the study of Pratiwi [34] as follows:
3) Building Water Based Elements
The water element basically has the ability to change from liquid to vapor so that the surrounding air temperature becomes cooler [43]. The process of changing the form of water from liquid to vapor and back to liquid through evaporation and condensation is a fundamental mechanism in the cooling process. When water evaporates, it transitions from liquid to vapor state, absorbing heat from the surrounding environment in the process, which contributes to the cooling effect [44]. The water element can affect the microclimate through the wind direction that carries splashes of water and water vapor as well as evapotransportation from the water or plants in the pond to the surrounding area.
Based on the study in this research, it is found that the water element in the city park, namely the fountain in Merdeka Square Park, has a much lower LST value and has a cooling effect on the surrounding area. This shows that the water element is effective in reducing the temperature in the surrounding area so that the addition of water elements in RTH is important in creating a more comfortable microclimate.
The strategy that can be done to improve the quality of microclimate through improving the water element in Merdeka Square Park is to reactivate the fountain facility in the center of the park. This is because every time researchers visit the park in the morning to evening there is never any fountain activity so that it is only a puddle. Water elements that have movements such as fountains or flows can provide a cool or cool effect more effectively on the surrounding area.
The strategy of adding water elements that can be done in Merbabu Park includes adding fountain or pond facilities in the northern part of the park. This is because the northern part of the park is only built empty land with paving material without any activities that can be done. By improving the area through the addition of water element facilities, it is hoped that it can improve the park's microclimate.
3.6 Public awareness and engagement
Engaging the public in understanding the benefits of sustainable urban design, particularly in urban parks, is essential for fostering community participation in green initiatives. The integration of technology, such as UAV and OBIA methods, enhances this engagement by providing valuable data that can inform and involve the community in sustainability efforts.
Urban parks are vital components of sustainable urban design, contributing to environmental quality, biodiversity, and community well-being. Research has shown that the use of UAVs in monitoring park attributes allows for comprehensive assessments of park usage and environmental conditions [45]. This technology enables the collection of high-resolution data that can be used to analyze LSTs, which is crucial for understanding the urban heat island effect and its implications for park design and management [46]. By employing UAVs, urban planners can visualize and communicate the benefits of green spaces more effectively, thereby raising public awareness and encouraging community involvement in park-related initiatives.
The application of OBIA methods in analyzing UAV imagery further enhances the ability to classify and map urban vegetation and other park features accurately. OBIA segments images into meaningful objects, allowing for more precise assessments of vegetation health and diversity [47]. This capability is particularly important in urban parks. Where diverse plant species contribute to ecological resilience and aesthetic value. By sharing these findings with the community, urban planners can foster a greater appreciation for the ecological benefits of urban parks, motivating residents to participate in conservation and enhancement efforts [48].
Moreover, community engagement in the assessment and management of urban parks can lead to more sustainable outcomes. Studies have indicated that when local communities are involved in the planning and monitoring processes, they are more likely to support and maintain green initiatives [49]. For instance, participatory approaches that incorporate community feedback into park design can ensure that the spaces meet the needs and preferences of local residents, thereby enhancing their usability and enjoyment. This collaborative effort not only empowers communities but also builds a sense of ownership and responsibility towards the urban environment.
Effective communication strategies are essential for promoting public understanding of the benefits of sustainable urban design. Utilizing visual data derived from UAV and OBIA methods can help convey complex environmental information in an accessible manner. For example, interactive maps and visualizations can illustrate the impacts of urban heat and the benefits of vegetation cover, making the case for increased investment in green spaces more compelling [50]. Additionally, educational programs that highlight the role of urban parks in climate adaptation and community health can further engage the public and encourage participation in sustainability initiatives [51].
One of the foundational aspects of promoting sustainable urban design is the alignment with the Sustainable Development Goals (SDGs), particularly SDG 11, which focuses on sustainable cities and communities. This alignment serves as a guiding framework for local sustainability goals, emphasizing the importance of community involvement in urban planning and development [52]. Research indicates that community engagement is beneficial for sustainability, as it fosters a sense of ownership among residents, encouraging them to contribute resources and actively participate in sustainability initiatives [52, 53]. This participatory approach is essential for ensuring that urban design reflects the needs and aspirations of the community, thereby enhancing the overall effectiveness of sustainability efforts [54].
Moreover, interdisciplinary collaboration plays a significant role in enhancing community engagement in sustainable urban design. For instance, integrating engineering education with social work principles can equip future engineers with the skills necessary to design projects that are not only technically sound but also socially responsible [55]. This interdisciplinary approach can lead to more innovative solutions that address the complex challenges of urban sustainability while fostering community involvement [56]. By involving various stakeholders, including local governments, non-profit organizations, and community members, urban design processes can become more inclusive and responsive to the diverse needs of the population [57].
Effective communication strategies are also crucial for raising public awareness about the benefits of sustainable urban design. Local councils, for example, play a vital role in disseminating information and engaging residents in sustainability initiatives. However, studies have shown that there is often a lack of effective communication between councils and communities, which can hinder engagement efforts [58]. Therefore, developing clear communication channels and utilizing various platforms to share information about sustainable practices and initiatives can significantly enhance community participation [59].
Furthermore, the role of educational institutions in promoting community engagement cannot be overstated. Higher education institutions (HEIs) can serve as catalysts for sustainability by developing policies that encourage community engagement and integrating sustainability into their curricula [60]. By fostering partnerships with local communities, HEIs can facilitate knowledge exchange and empower residents to participate in sustainability initiatives actively [61]. This educational approach not only raises awareness but also equips community members with the skills and knowledge needed to engage effectively in sustainable urban design processes.
Engaging the public in understanding the benefits of sustainable urban design, particularly in urban parks, is essential for encouraging participation in green initiatives. By integrating community input, leveraging technology, and employing effective communication strategies, urban planners can create inclusive and sustainable urban environments that reflect the needs and aspirations of the community. This collaborative approach not only enhances the effectiveness of sustainability initiatives but also empowers residents to take an active role in shaping their urban landscapes.
This study demonstrates the effectiveness of the OBIA method in classifying objects in high-resolution satellite and drone imagery. OBIA-based image classification results are suitable to be combined with LST distribution studies, especially those captured by UAVs or thermal drones. For micro-scale studies, such as urban green spaces (RTH), data obtained from drones and the OBIA classification method proved effective in producing detailed analysis results. The pattern of LST distribution in Merdeka Square Park, Merbabu Park, and Malabar Forest showed significant variations, mainly influenced by various factors, with land cover being the main factor affecting LST.
In Merdeka Square Park, areas dominated by trees (34.92%) had lower LST, while areas with asphalt (18.37%), paving (9.42%), and concrete (13.44%) showed higher LST. The distribution of LST shows that 22.13% of the areas have very low temperatures (31-36℃), while 30.05% have high temperatures (46-51℃). In Merbabu Park, 33.77% of the area is covered by trees, contributing to the low LST. Areas with concrete (14.00%) and paving (6.61%) showed higher LST, with 32.94% of the area having very low temperatures (31-37℃) and 4.44% having high temperatures (49-55℃). Malabar forest with a tree cover of 47.74% had the lowest LST, with 40.35% of the area in the very low temperature range (30-36℃) and only 0.14% in the very high temperature range (54-60℃).
This condition basically shows the suitability of the research hypothesis where Merdeka Square Park and its surroundings have the highest average LST value compared to the other two RTHs due to the use of building materials that dominate the park, namely paving and concrete without sufficient tree shade so that they tend to produce higher LST values. Meanwhile, Merbabu Park and Malabar Forest tend to reflect a lower average LST value because they have been dominated by vegetation cover in the form of trees so that almost the entire RTH area has been shaded by trees except in the northern part of Merbabu Park which still needs improvement of the park materials used.
This study found that the type of land cover material, the density of built-up areas, and the presence of vegetation components are the main factors that influence the pattern of LST distribution, especially in urban areas. Increasing the area and quality of urban green spaces, planting trees with wide canopies, using environmentally friendly materials, and incorporating water elements can help reduce the urban heat island effect and improve thermal comfort. Further research is needed to identify effective mitigation strategies to address the climate change phenomenon and minimize its negative impacts. Implementation of such recommendations can improve the quality of the urban environment, create a more comfortable microclimate, and support the sustainability of urban ecosystems.
The use of new technology in producing high-resolution imagery and LST through the use of drones is still rarely applied to research on urban air temperature due to the relatively high cost and limited flexibility when compared to the use of more easily accessible satellite imagery. So the output of this research in the form of UAV imagery, OBIA classification, and LST datasets cannot be accessed by the public.
This study is an independent research effort conducted without external funding. The authors thank Brawijaya University for providing facilities and resources essential to this research. All remaining shortcomings are the sole responsibility of the authors.
[1] Jain, M., Dimri, A.P., Niyogi, D. (2017). Land-air interactions over urban-rural transects using satellite observations: Analysis over Delhi, India from 1991–2016. Remote Sensing, 9(12): 1283. https://doi.org/10.3390/rs9121283
[2] Rosyadi, A., Azahra, M.F. (2020). Mapping of building density percentage using regression model based on landsat 8 imagery (Case study of Bandung City). Jurnal Penginderaan Jauh Indonesia, 2(1): 7-12. https://doi.org/10.12962/jpji.v2i1.261
[3] Morabito, M., Crisci, A., Messeri, A., Orlandini, S., Raschi, A., Maracchi, G., Munafò, M. (2016). The impact of built-up surfaces on land surface temperatures in Italian urban areas. Science of the Total Environment, 551: 317-326. https://doi.org/10.1016/j.scitotenv.2016.02.029
[4] Azizah, V., Deffinika, I., Arinta, D. (2022). The effect of land use changes on land surface temperature in Malang City’s on 2016-2020. IOP Conference Series: Earth and Environmental Science, 1066(1): 012006. https://doi.org/10.1088/1755-1315/1066/1/012006
[5] Irwan, S.N. (2021). Productive Urban Landscape: City Ecosystem Development Towards an Ecological City. Yogyakarta: Lily Publisher.
[6] Muharama, H., Ariastita, P.G. (2020). Assessment of the effectiveness of the function of city parks as public green open space in Malang City. Jurnal Teknik ITS, 9(2): 2337-3539.
[7] Fikriyah, Purnamasari, W.D., Hasyim, A.W. (2021). Park users' perceptions of the quality of city park use in Klojen District. Planning for Urban Region and Environment, 10(1): 157-168.
[8] Zhang, Q., Zhang, J., Lu, S., Liu, Y., Liu, L., Wang, Y.Y., Cao, M.Y. (2023). Multi-resolution feature extraction and fusion for traditional village landscape analysis in remote sensing imagery. Traitement du Signal, 40(3): 1259-1266. https://doi.org/10.18280/ts.400344
[9] Hernina, R., Putera, R., Rosyidy, M.K., Ramadhan, M.I., Putra, T.A. (2019). [Analisis tinggi terbang drone dan resolusi untuk pemetaan penggunaan lahan menggunakan DJI phantom 4 pro (Studi kasus kampus UI)] Analysis of drone flying height and resolution for land use mapping using DJI phantom 4 pro (UI campus case study). In Prosiding Seminar Nasional Penginderaan Jauh 2019. Pusat Pemanfaatan Penginderaan Jauh, Lembaga Penerbangan dan Antariksa Nasional.
[10] Lichtblau, E., Oswald, C.J. (2019). Classification of impervious land-use features using object-based image analysis and data fusion. Computers, Environment and Urban Systems, 75: 103-116. https://doi.org/10.1016/j.compenvurbsys.2019.01.007
[11] Naughton, J., McDonald, W. (2019). Evaluating the variability of urban land surface temperatures using drone observations. Remote Sensing, 11(14): 1722. https://doi.org/10.3390/rs11141722
[12] Faye, E., Rebaudo, F., Yánez-Cajo, D., Cauvy-Fraunié, S., Dangles, O. (2016). A toolbox for studying thermal heterogeneity across spatial scales: from unmanned aerial vehicle imagery to landscape metrics. Methods in Ecology and Evolution, 7(4): 437-446. https://doi.org/10.1111/2041-210X.12488
[13] Dong, S., Chen, Z., Gao, B., Guo, H., Sun, D., Pan, Y. (2020). Stratified even sampling method for accuracy assessment of land use/land cover classification: A case study of Beijing, China. International Journal of Remote Sensing, 41(16): 6427-6443. https://doi.org/10.1080/01431161.2020.1739349
[14] Hasyim, A.W., Ari, I.R.D., Kurniawan, E.B., Kriswati, L., Wahid, M.N.I., Isdianto, A. (2024). Integrating object-based classification and multivariate analysis to evaluate flood vulnerability in unplanned settlements of Malang City, Indonesia. International Journal of Design & Nature and Ecodynamics, 19(5): 1611-1625. https://doi.org/10.18280/ijdne.190515
[15] Nishar, A., Richards, S., Breen, D., Robertson, J., Breen, B. (2016). Thermal infrared imaging of geothermal environments by UAV (unmanned aerial vehicle). Journal of Unmanned Vehicle Systems, 4(2): 136-145. https://doi.org/10.1139/juvs-2015-0030
[16] Kalinda, I.O.P., Sasmito, B., Sukmono, A. (2018). [Analisis pengaruh koreksi atmosfer terhadap deteksi land surface temperature menggunakan citra landsat 8 di kota semarang] Analysis of the effect of atmospheric correction on land surface temperature detection using landsat 8 imagery in Semarang City. Jurnal Geodesi Undip, 7(3): 66-76.
[17] Khan, M.S., Ullah, S., Chen, L. (2021). Comparison on land-use/land-cover indices in explaining land surface temperature variations in the city of Beijing, China. Land, 10(10): 1018. https://doi.org/10.3390/land10101018
[18] Hasyim, A.W., Sukojo, B.M., Anggraini, I.A., Fatahillah, E.R., Isdianto, A. (2025). Urban heat island effect and sustainable planning: Analysis of land surface temperature and vegetation in Malang City. International Journal of Sustainable Development and Planning, 20(2): 683-697. https://doi.org/10.18280/ijsdp.200218
[19] Jeon, G., Park, Y., Guldmann, J.M. (2023). Impacts of urban morphology on seasonal land surface temperatures: Comparing grid-and block-based approaches. ISPRS International Journal of Geo-Information, 12(12): 482. https://doi.org/10.3390/ijgi12120482
[20] Pramudiyasari, T., Wibowo, A., Suko, P.A. (2022). Land cover changes impact on 1st between 1990-2005-2020 in Bandar Lampung City, Indonesia. IOP Conference Series: Earth and Environmental Science, 986(1): 012048. https://doi.org/10.1088/1755-1315/986/1/012048
[21] Yang, X., Zhang, Y., Liu, L., Zhang, W., Ding, M., Wang, Z. (2009). Sensitivity of surface air temperature change to land use/cover types in China. Science in China Series D: Earth Sciences, 52(8): 1207-1215. https://doi.org/10.1007/s11430-009-0085-0
[22] Isdianto, A., Hasyim, A.W., Sukojo, B.M., Alimuddin, I., Anggraini, I.A., Fatahillah, E.R. (2025). Integrating urban design with natural dynamics: Enhancing ecological resilience in Malang City over a decade. International Journal of Sustainable Development and Planning, 20(3): 1061-1075. https://doi.org/10.18280/ijsdp.200313
[23] Yang, H., Yang, K., Miao, Y., Wang, L., Ye, C. (2020). Comparison of potential contribution of typical pavement materials to heat island effect. Sustainability, 12(11): 4752. https://doi.org/10.3390/su12114752
[24] Onyango, S.A., Mukundi, J.B., Adimo, A.O., Wesonga, J.M., Sodoudi, S. (2021). Variability of plant species effects on microclimatic modification in urban open spaces of Nairobi, Kenya. Current Urban Studies, 9(1): 126-143. https://doi.org/10.4236/cus.2021.91008
[25] Zhang, X., Lei, Y., Li, R., Ackerman, A., Guo, N., Li, Y., Yang, Q., Liu, Y. (2022). Research on thermal comfort of underside of street tree based on LiDAR point cloud model. Forests, 13(7): 1086. https://doi.org/10.3390/f13071086
[26] Meignen, F., Martínez, A., Martí, N. (2020). Greenery in intermediate spaces of the dwellings in the city of Barcelona. International Journal of Sustainable Development and Planning, 15(6): 801-811. https://doi.org/10.18280/ijsdp.150602
[27] Ragheb, A.A., Aly, R., Ragheb, G., Mohamed, H., El Ashmawy, R.A. (2024). Influence of building height on microclimate and human comfort: A case study from the New Administrative Capital. International Journal of Sustainable Development and Planning, 19(7): 2559-2568. https://doi.org/10.18280/ijsdp.190712
[28] Sellier, D., Fourcaud, T. (2009). Crown structure and wood properties: Influence on tree sway and response to high winds. American Journal of Botany, 96(5): 885-896. https://doi.org/10.3732/ajb.0800226
[29] Onoda, Y., Bando, R. (2021). Wider crown shyness between broad-leaved tree species than between coniferous tree species in a mixed forest of Castanopsis cuspidata and Chamaecyparis obtusa. Ecological Research, 36(4): 733-743. https://doi.org/10.1111/1440-1703.12233
[30] Kunstler, G., Guyennon, A., Ratcliffe, S., Rüger, N., Ruiz-Benito, P., Childs, D.Z., Dahlgren, J., Lehtonen, A., Thuiller, W., Wirth, C., Zavala, M.A., Salguero-Gomez, R. (2021). Demographic performance of European tree species at their hot and cold climatic edges. Journal of Ecology, 109(2): 1041-1054. https://doi.org/10.1111/1365-2745.13533
[31] Ziaeemehr, B., Jandaghian, Z., Ge, H., Lacasse, M., Moore, T. (2023). Increasing solar reflectivity of building envelope materials to mitigate urban heat islands: State-of-the-art review. Buildings, 13(11): 2868. https://doi.org/10.3390/buildings13112868
[32] Xie, J., Yang, Z., Liang, L. (2015). Investigation of low heat accumulation asphalt mixture and its impact on urban heat environment. PLoS ONE, 10(7): e0133829. https://doi.org/10.1371/journal.pone.0133829
[33] Ennehar, B.C. (2023). A comparative study of land cover mapping based on support vector machine. International Journal of Design & Nature and Ecodynamics, 18(2): 429-434. https://doi.org/10.18280/ijdne.180221
[34] Pratiwi, S.N. (2018). A review of material cover features for mitigating urban heat island. International Journal on Livable Space, 3(2): 71-80. https://doi.org/10.25105/livas.v3i2.3196
[35] Sahak, N.A.M., Yunos, M.Y.M., Maulan, S., Ismail, N.A. (2022). Pervious materials for the flood mitigation process in Kuala Lumpur: A review. International Journal of Academic Research in Business and Social Sciences. 12(8): 1077-1093. https://doi.org/10.6007/ijarbss/v12-i8/14678
[36] Zhou, J., Pang, Y., Du, W., Huang, T., Wang, H., Zhou, M., Liu, J. (2024). Review of the development and research of permeable pavements. Hydrological Processes, 38(6): e15179. https://doi.org/10.1002/hyp.15179
[37] Fantucci, S., Serra, V. (2020). Experimental assessment of the effects of low-emissivity paints as interior radiation control coatings. Applied Sciences, 10(3): 842. https://doi.org/10.3390/app10030842
[38] Mara, J., Bodnár, A.E., Trif, L., Telegdi, J. (2023). Development of effective infrared reflective coatings. Applied Sciences, 13(23): 12903. https://doi.org/10.3390/app132312903
[39] Zhang, Y., Long, E., Li, Y., Li, P. (2017). Solar radiation reflective coating material on building envelopes: Heat transfer analysis and cooling energy saving. Energy Exploration & Exploitation, 35(6): 748-766. https://doi.org/10.1177/0144598717716285
[40] Kim, J.H., Lee, J. H., Kim, Y.H. (2022). Equilibrium of capillary and pore water pressure in lightweight aggregates concrete. Mechanics of Advanced Materials and Structures, 29(26): 5156-5162. https://doi.org/10.1080/15376494.2021.1949510
[41] Agnihotri, A., Jethoo, A.S., Ramana, P.V. (2021). Reprocessed materials evaluation on perfunctory and flame endurance of structures. International Research Journal on Advanced Science Hub, 3(5): 116-123. https://doi.org/10.47392/irjash.2021.128
[42] Đekić, J.P., Mitković, P.B., Dinić-Branković, M.M., Igić, M.Z., Đekić, P.S., Mitković, M.P. (2018). The study of effects of greenery on temperature reduction in urban areas. Thermal Science, 22(Suppl. 4): 988-1000. https://doi.org/10.2298/TSCI170530122d
[43] Hendrawati, D. (2016). Water as a microclimate control tool in buildings. Journal of Civil Engineering & Planning, 18(2): 97-106.
[44] Zhu, X., Xu, W., Wang, W., Shi, X., Chen, G., Zhao, S. (2020). The design of a vapor-condensing plume abatement system and devices for mechanical draft cooling towers. Water, 12(4): 1013. https://doi.org/10.3390/w12041013
[45] Park, K. (2020). Park and neighborhood attributes associated with park use: An observational study using unmanned aerial vehicles. Environment and Behavior, 52(5): 518-543. https://doi.org/10.1177/0013916518811418
[46] Henn, K.A., Peduzzi, A. (2024). Surface heat monitoring with high-resolution UAV thermal imaging: Assessing accuracy and applications in urban environments. Remote Sensing, 16(5): 930. https://doi.org/10.3390/rs16050930
[47] Wei, W., Cao, J., Wang, N., Qian, Y. (2023). Multispectral remote sensing and DANet model improve the precision of urban park vegetation detection: An empirical study in Jinhai Park, Shanghai. Frontiers in Ecology and Evolution, 11: 1185911. https://doi.org/10.3389/fevo.2023.1185911
[48] Tiwari, A., Kira, O., Bamah, J., Boneh, H., Karnieli, A. (2024). Multi-sensor classification framework of urban vegetation for improving ecological services management. Remote Sensing, 16(6): 1110. https://doi.org/10.3390/rs16061110
[49] Muhmad Kamarulzaman, A.M., Wan Mohd Jaafar, W.S., Mohd Said, M.N., Saad, S.N.M., Mohan, M. (2023). UAV implementations in urban planning and related sectors of rapidly developing nations: A review and future perspectives for Malaysia. Remote Sensing, 15(11): 2845. https://doi.org/10.3390/rs15112845
[50] Banzhaf, E., Bause, I., Helbig, C., Elze, S. (2023). Personal exposure to environmental pressures in different urban residential structures linking fieldwork and RS mapping. IEEE Journal of Selected Topics in Applied Earth Observations and Remote Sensing, 17: 2789-2799. https://doi.org/10.1109/jstars.2023.3340418
[51] McDonald, W. (2017). Sustainable development and public administration: Challenges and innovation in citizen engagement. Review of Public Administration and Management, 5(2): 1-4. https://doi.org/10.4172/2315-7844.1000219
[52] Ahumuza, E., Moscibrodzki, P., Tucker, J.D., Awor, P. (2022). Community engagement in social innovation research: A global sequential mixed methods analysis. Research Square. https://doi.org/10.21203/rs.3.rs-2249384/v1
[53] Matindo, A.Y., Meshi, E.B., Kapologwe, N.A., Kengia, J.T., Kajange, S., Chaki, P., Munisi, D.Z. (2022). Biolarviciding implementation in southern Tanzania: Scalability opportunities and challenges. PLoS ONE, 17(8): e0273490. https://doi.org/10.1371/journal.pone.0273490
[54] Dias, N., Keraminiyage, K., Amaratunga, D., Curwell, S. (2018). Critical success factors of a bottom up urban design process to deliver sustainable urban designs. International Journal of Strategic Property Management, 22(4): 265-277. https://doi.org/10.3846/ijspm.2018.3683
[55] Gilbert, D.J., Held, M.L., Ellzey, J.L., Bailey, W.T., Young, L.B. (2015). Teaching ‘community engagement’ in engineering education for international development: Integration of an interdisciplinary social work curriculum. European Journal of Engineering Education, 40(3): 256-266. https://doi.org/10.1080/03043797.2014.944103
[56] Miller, S.E., Lee, J.S., Berle, D. (2012). Community engagement from the ground up: An interdisciplinary service-learning after-school garden program. Journal of Agriculture, Food Systems, and Community Development, 2(3): 121-135. https://doi.org/10.5304/jafscd.2012.023.013
[57] Turin, T.C., Kazi, M., Rumana, N., Lasker, M.A., Chowdhury, N. (2023). Community ecosystem mapping: A foundational step for effective community engagement in research and knowledge mobilization. Journal of Primary Care & Community Health, 14: 21501319231205170. https://doi.org/10.1177/21501319231205170
[58] Williams, B.R. (2015). Reporting on sustainability by Australian councils–A communication perspective. Asian Review of Accounting, 23(2): 186-203. https://doi.org/10.1108/ara-12-2013-0079
[59] Voci, D., Karmasin, M. (2021). Sustainability and communication in higher education. In 7th International Conference on Higher Education Advances (HEAd'21), Editorial Universitat Politècnica de València, pp. 641-649. https://doi.org/10.4995/head21.2021.12831
[60] Socheath, M.A.M., Kovin, C., Sinthunawa, C. (2019). Local community engagement as a pathway toward sustainable development through higher education institutions (HEIs) in Cambodia. Insight: Cambodia Journal of Basic and Applied Research, 1(2): 9-32. https://doi.org/10.61945/cjbar.2019.1.2.1
[61] López, O.S. (2013). Creating a sustainable university and community through a common experience. International Journal of Sustainability in Higher Education, 14(3): 291-309. https://doi.org/10.1108/ijshe-11-2011-0073