Rosalina Palanca-Tan![]()
© 2025 The author. This article is published by IIETA and is licensed under the CC BY 4.0 license (http://creativecommons.org/licenses/by/4.0/).
OPEN ACCESS
The transport sector accounts for more than a third of global carbon dioxide (CO2) emissions from end-use sectors, and cars and vans in turn contribute almost half (48%) of the transport sector emissions. Hence, the transition to more efficient and less carbon-intensive road transportation modes, such as electric vehicle (EV), is crucial for climate change mitigation. This paper presents the results of a survey on Filipinos’ awareness of and preferences for EV. Following the value-based adoption model and employing the generalized structural equation modeling (GSEM) technique, the study finds that EV adoption intention is positively correlated with perceived value (PV), environmental innovativeness (EI), and financial (fi) and non-financial incentives (NFI). Considering all the benefits and costs of EV - monetary and non-monetary - a higher over-all PV induces adoption. PV has the largest positive impact on EV adoption, with a coefficient of 0.557 which is more than twice the coefficient of each of the other three positive factors. Both FI and NFI can induce EV adoption. Remarkably, NFI (with a coefficient of 0.208) have a stronger impact than FI (coefficient of 0.162). Respondents consider the availability of charging stations and preferential measures for EV ownership in the country’s registration, traffic and parking schemes to be most crucial. Finally, an individual with a higher propensity to learn about and acquire pro-environmental products (EI) is more likely to consider owning an EV. This factor, nonetheless, has the least positive influence on EV adoption. Concerns about the high price of electricity in the Philippines and uncertainties about its supply have a significant negative effect on EV adoption. Electricity has been a long-standing issue in the country that is yet to be adequately addressed by policy makers. The renewable energy transition and other reforms to stabilize the price and supply of electricity in the Philippines must be pursued in tandem with the EV promotion programs.
adoption intention, electric vehicle (EV), perceived value (PV), Philippines, renewable energy
The transport sector accounts for more than a third of global CO2 emissions from end-use sectors [1], while cars and vans contribute almost half (48%) of the transport sector emissions [2]. Hence, the transition to more efficient and less carbon-intensive road transportation modes, such as EV, is crucial for climate change mitigation. EV allows broad participation of the people in the transport sector’s clean energy transition. With electricity as its main or lone energy source, EV has a lower or zero emissions intensity compared to a fuel-powered or internal combustion engine (ICE) vehicle. The growing share of cleaner and renewable energy sources (e.g., solar, wind, biomass, hydropower, and geothermal) in electricity generation further increases the viability of the EV clean energy transition path.
Most governments promote the adoption of EV by providing incentives to EV owners and users and by implementing stricter regulations on vehicle emissions [3]. Incentives include financial (e.g., subsidies, and tax exemptions or reduction) and non-financial measures (e.g., charging stations and other EV infrastructure development programs, and non-pecuniary preferential measures for EV). Several national policy programs have set targets for EV sales and/or specify dates for banning ICE sales. A 30% EV car sales target by 2030 has been set by Japan, South Korea, Canada, Italy, Brazil, and Mexico. Some European countries have announced to ban ICE sales by 2025 (Netherlands, Norway), 2030 (Germany), and 2040 (France, United Kingdom). In Southeast Asis, Singapore intends to phase-out ICE by 2040, while EV volume goals have been set by Indonesia (2.5 million motorcycles and 2,200 cars by 2025), Malaysia (100,000 cars, 100,000 motorcycles, 2,000 buses by 2030), Vietnam (100,000 cars by 2020), and Thailand (20% of annual car production by 2030) [4]. In the case of the Philippines, the 2023 draft of the Comprehensive Roadmap for Electric Vehicle Industry (CREVI) targets a 50% EV share by 2040 [5].
The transport sector in the Philippines dominates total energy demand. In 2019, prior to the COVID-19 pandemic, the transport sector accounted for 35% of total final energy consumption, while the shares of the household, industry, services, non-energy, and agricultural sectors were 27%, 20%, 14%, 3%, and 1%, respectively. Due to community quarantines and lockdowns imposed during the pandemic, the transport sector share fell to 30% while households’ share rose to 31%. However, with the end of the pandemic, transport energy demand recovered; and with a projected average annual increase of 7.1%, the transport sector share in energy demand is expected to reach 38-39% by 2040 (DOE 2022). Within the transport sector, the bulk (90%) of energy demand comes from land transport. Land transport accounts for about 80% of domestic traffic and 60% of freight traffic. In terms of emissions, the transport sector contributed 27% of both CO2 emissions and total greenhouse gas emissions (GHG) emissions in the Philippines in 2019, second only to power generation which contributed 53% [6]. By 2040, the share of transport in total GHG emissions is expected to increase to 30%, while electricity generation’s share decreases to 42%, making specific transport programs, such as EV promotion, more central in the country’s green energy transition.
The Philippine government has long pursued a strategy of EV adoption promotion. As early as 2006, Executive Order (EO) 488 was passed, imposing zero tariffs on components, parts and accessories for the assembly of hybrid, electric, flexible fuel and compressed natural gas motor vehicles (Philippine Legislative Digital Resources website). Republic Act (RA) 1096310, referred to as the Tax Reform for Acceleration and Inclusion (TRAIN) Law and enforced on 1 January 2018, exempts purely EVs from the excise tax on automobiles, while hybrid vehicles are subjected to only 50% of the applicable tax rates on automobiles (Section 45). In 2018, the Electric Vehicles and Charging Stations Act was first proposed to come up with a national policy and regulatory framework for the use of EVs and the establishment of electronic charging stations in the country. The proposed bill was eventually passed into law on 15 April 2022 as RA 116971 and retitled Electric Vehicle Industry Development Act (EVIDA). EVIDA mandates the formulation of the CREVI, a national development plan to accelerate the development, commercialization, and utilization of EV in the country (Section 6 of RA 116971). CREVI covers all aspects and areas of the EV industry - manufacture, assembly, and trade of EVs, parts and components, and batteries; construction, installation, and maintenance of charging stations and equipment, and other support infrastructure; research and development; and human resource development.
With the goal of mainstreaming EV use in the Philippines, barriers to EV adoption are to be addressed by incentivizing the purchase and use of EV on the demand side, and by enabling the development of the Philippine EV industry on the supply side. EV adoption inducement strategies include mandatory EV share in corporate and government fleets, dedicated parking slots for EV, and installation of charging stations (Sections 16-19). EVIDA provides for both fiscal and non-fiscal incentives for EV manufacturing and use, and for the operation of charging stations and other EV support infrastructure (e.g., research, training and testing centers). Fiscal incentives include exemption from or reduction of excise and import taxes as well as exemption from motor vehicle users’ charge, and vehicle registration and inspection (Section 24). Non-fiscal incentives consist of priority registration and renewal of registration, exemption from the mandatory unified vehicular volume reduction program and number-coding scheme, expeditious processing of public utility vehicle (PUV) franchise applications, expeditious processing of importations, EV training programs, and employment of foreign experts under a technology transfer agreement (Section 25). Further, EVIDA stipulates that government financial institutions provide concessional financial packages (preferential interest rates and payment schemes), and that the Central Bank encourage private banks to prioritize, streamline, and allocate a share of their portfolio for the EV sector.
Drafted in 2023, CREVI targets a 50% penetration rate of EVs in the county by 2040. The program projects a total of 6.3 million EV, comprising about half of the total projected vehicle fleet in the country by 2040. This projected EV fleet will consist of 67% motorcycles and tricycles, 32% sedans and SUVs/UVs, and 1% buses (Table 1).
Table 1. CREVI targets, number of EV units by vehicle type
|
Vehicle Type |
Short-Term |
Medium-Term |
Long-Term |
Total |
|
|
2023-28 |
2029-34 |
2035-40 |
2023-40 |
|
Sedan, SUV, UV |
553,000 (22.53%) |
641,000 (32.62%) |
855,000 (42.72%) |
2,049,000 (32.49%) |
|
Motorcycles/ tricycles |
1,899,000 (77.38%) |
1,209,000 65.30%) |
1,145,000 57.20%) |
4,253,000 (67.43%) |
|
Bus |
2,200 (0.09%) |
1,500 (0.08%) |
1,600 (0.08%) |
5,300 (0.08%) |
|
Total |
2,454,200 (100.0%) |
1,851,500 (100.0%) |
2,001,600 (100.00%) |
6,307,300 (100.00%) |
Source: Department of Energy 2023
From 2010-2019, there were only a total of 11,950 EV registered with the Philippine Land Transportation Office (LTO), the bulk (92.4%) of which were tricycles (6,783) and motorcycles (4,260), while 5.3% were utility vehicles (595) and sport utility vehicles (38), 2.2% were sedans (260), 0.09% were trucks (11), and 0.02% were buses (3) [7]. The dominance of electric tricycles was attributed to the initiatives of the local government units as well as the Department of Energy’s e-trike project, while the share of e-utility vehicles was due to electric jeepney adoption under the PUV modernization program. Registered four-wheeled EV were mostly donated units from the international community. In 2018, in particular, the increase in EV registrations was largely attributed to foreign government’s donations of plug-in hybrid electric sports utility vehicles to Philippine government agencies [5]. In 2021, the number of registered EV reached 8,593, but this was still a measly 0.07% of all registered vehicles. Thus, mainstreaming EV use in the Philippines remains a gargantuan task. Crafting implementation strategies for EVIDA and CREVI requires a thorough assessment of consumer attitudes and preferences that determine actual EV uptake.
This paper aims to contribute to evidence-based policy making and program development for the EV sector. Specifically, the study aims to:
(1) Determine people’s perception of the benefits and costs associated with the use of all types of EV, and how they contribute to EV value;
(2) Assess EV adoption potential in the Philippines, particularly among private vehicle owners;
(3) Identify the effects of PV, electricity and environment-related perspectives, and government policies (financial and non-financial inducements) on EV adoption.
Quantitative analyses of the determinants of EV adoption, particularly in the developing countries of Southeast Asia, are still scarce. Further, findings on the most relevant factors driving EV adoption vary across study areas. Hence, there is a need to investigate what factors matter for specific countries and contexts. To the author’s knowledge, this is the first economic analysis on consumers’ preferences for EV with reference to both climate change mitigation and electricity supply and price issues. The Philippines, like other Southeast Asian countries, still faces challenges in increasing the share of environment-friendly renewable energy in electricity generation [8]. Moreover, the Philippine electricity market has long been overwhelmed by high electricity generation costs, making the electricity price in the country the highest among Southeast Asian countries. These issues, which are particular to the Philippines and the Southeast Asian context, are incorporated as additional explanatory variables of EV adoption in the model. Findings from this study can aid concerned government agencies in the formulation and implementation of effective EV adoption promotion policies and programs, and guide EV industry players in understanding and satisfying the specific needs and demands of potential consumers in the Philippines.
Past studies on EV adoption intention have utilized approaches from different social science disciplines. The earlier studies examined the role of EV attributes, such as purchase price, operational cost, driving range, and battery charging, on EV adoption intention. Apart from EV attributes, the influence of socio-demographic variables on EV adoption have also been analyzed. For instance, Junquera et al. [9] included age and driving distance in their model. Applying logistic regression procedure to analyze survey data gathered from 1,245 Spanish respondents, they found that the individual’s willingness to buy an EV is negatively related with perceived price of EV and charging time. They also found that people who usually drive a limited distance are more willing to purchase an EV, while those who usually drive a distance that is greater than 200 km per day are less willing to buy. They also concluded that individuals in the 25-65 years age group are more likely to purchase an EV.
Pamidimukkala et al. [10] focused on EV adoption barriers, which they classified into four categories - technological, infrastructural, financial, and environmental barriers. Analyzing their survey data of 733 respondents from the University of Texas at Arlington, USA with the structural equation modeling (SEM) technique, they found that of the four categories of barriers, only environmental barriers (the environmental effects of battery production and disposal of used batteries) do not significantly lead to non-adoption. Financial barriers (EV price and battery replacement costs), technological barriers (limited driving range, long charging times), and infrastructural barriers (insufficient public charging infrastructure) all have significant negative effects on EV adoption.
Following the framework of the extended theory of planned behavior, a model widely employed by social psychologists for predicting behavioral intentions, Adnan et al. [11] investigated the motivational factors in EV adoption, focusing mainly on plug-in hybrid EV. They found that environmental concerns (increasing severity of environmental problems, need for people to preserve scarce natural resources and protect the environment to ensure sustainable development) significantly predetermined the four constructs of behavioral intention, namely, attitude, personal moral norms, subjective norms, and perceived behavioral control. With a pooled sample of 403 EV adopters and non-adopters from Malaysia, they concluded that positive attitude towards EV, perceived personal obligation to contribute to climate change mitigation and environmental protection, social pressure to adopt EV, and ease in adopting this new technology increase the likelihood of EV adoption. Further, they found that hyperbolic discounting (installment plan for the purchase of EV, relative importance of present versus future benefits) moderated the relationship between intention to drive EV and actual adoption.
Kim et al. [12] also employed SEM to identify the factors that contribute either positively or negatively to the PV of EV, as well as to determine the effects of PV, environmental concern and innovation, and government support policies on EV adoption. Using data from 285 individual respondents in South Korea, they found that operational savings (fuel, repair, and maintenance costs savings), environmental benefits (EB), and driving enjoyment (less noise and vibration) significantly increase PV of EVs; while charging concerns, high vehicle price and replacement battery costs significantly decrease PV. Technological concerns on safety, reliability, top speed, and vehicle power do not significantly contribute to PV. Their results further reveal significant direct positive effects of PV, fiscal and non-fiscal incentives, and environmental innovation and concern on EV adoption, as well as significant moderating effects of fiscal incentives and environmental concern over PV’s influence on EV adoption.
Broadbent et al. [13] following the framework of Technology Diffusion Theory, categorized New Zealand private motorists into four EV attitudinal groups - EV Owner, EV Positive, EV Anxious, and EV Pessimist. Using mixed methods (survey and interviews) approach, they found that EV Positives, “the next-most-ready to buy EVs”, are early mainstream consumers who are most concerned about driving range, EV purchase price, charging and battery costs. Compared to EV Owners, EV Positives are unaware of incentives, suggesting the need for policy information dissemination. EV Positives are most interested in measures that effectively lower the purchase price of EV and increase charging stations nationwide. Broadbent et al. [13] further recommended institutional EV procurement as a way to propagate positive information about EV.
Broadbent et al. [14] reviewed government policies and programs, especially financial and soft incentives, to promote the use of EV over gasoline-powered vehicles in industrialized countries. Their study found that not all incentives are equally effective, and that a combination of measures is necessary to address the divergent motivations of the driving population. With the EV battery’s limited driving range, and anxiety about the inadequacy of charging stations and information identified as the most common hindrance to adoption, the authors recommended the installation and maintenance of an adequate public recharger network as well as information dissemination programs. Government procurement was also identified to be an effective diffusion strategy.
The conceptual framework for this paper follows the value-based adoption model developed by Kim et al. [15] based on the theory of consumption value. An individual’s acceptance or adoption of a particular technological innovation depends on his/her perception of the net value of the innovation - the individual’s overall assessment of the innovation's utility [12, 16]. PV results from a comprehensive consideration of all the benefits and costs/risks from the technological innovation [15, 17]. Kim et al. [12] posit that higher PV of EV increases the likelihood of a positive EV adoption decision, as found in the case of information technology innovations [18-20].
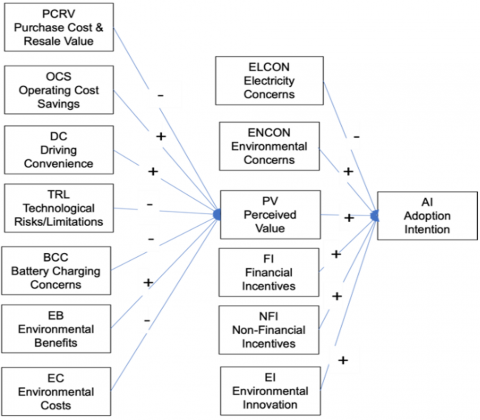
Drawing from past papers [9-12, 14, 21], this research hypothesized that the individual’s perception of the value of EV (PV), stems from seven benefits and costs items that the individual may associate with EV adoption: (1) purchase costs and resale value (PCRV), (2) operational cost savings (OCS), (3) driving convenience (DC), (4) technological risks and limitations (TRL), (5) battery charging concerns (BCC), (6) EB, and (7) EC. Benefits that can be derived from EV use - OCS (electricity cost is lower compared to gasoline cost, lower maintenance and repair costs), DC (less noise and vibration) and EB (less emissions leading to improved air quality and contributing to climate change mitigation) - will raise the PV of EV. On the other, risks and costs associated with EV - higher purchase price and lower resale value, technological constraints (limitations on speed, vehicle power, number of models and availability of services), BCC (few public charging stations, limited battery driving range, long charging time), and EC (pollution from battery production and disposal) - lowers EV’s PV.
In line with Kim et al. [12], the study also looked at the effects of the individual’s environmental consciousness and innovativeness, and the government’s EV support programs - both FI and NFI - on the intention to adopt (AI). This paper adds a fifth factor in the framework, namely, concerns about electricity supply and price. In the Philippines, the supply and price of electricity have long been a challenging and contentious issue. Electricity remains to be mainly generated from imported coal and fossil fuel, and hence subject to global market fluctuations. Electricity price in the Philippines is the highest among Southeast Asian countries due to a pricing policy that transfers fuel price and foreign exchange risks to consumers [22]. These electricity-related concerns may diminish EV adoption intention. A schematic diagram of the conceptual framework on the factors influencing PV of EV and EV adoption intention is presented in Figure 1.
Figure 1. Conceptual framework
For this research, individual awareness of the benefits and costs of EV and preferences for EV were elicited in a survey. Each respondent was asked to agree or disagree with statements on various EV benefit and cost attributes, perception of EV value, and adoption intention using a scale of 1 (strongly disagree) to 5 (strongly agree). Table 2 lists the variables and the corresponding questionnaire items used to arrive at measures for the variables. The measure for each variable is derived by getting the average of the responses to the questionnaire items.
The survey was administered to individuals in March-May 2024. To capture consumer perceptions that are based on both understanding and actual experience of driving vehicles, the sampling frame was limited to individuals who are at least 18 years old (the minimum age for driving in the Philippines) and possessing a driver's license. Due to these requirements, survey respondents were generated through convenience sampling procedures by five trained and experienced enumerators. Enumerators were given assignments as to the target number of respondents by age group and household social class to ensure a fairly even distribution of respondents. A total sample of 403 respondents was generated for the study, 314 of whom have no EV. Thus, a total of 314 observations were used for this paper on EV adoption intention. The data were analyzed using the GSEM procedure in STATA.
Table 2. Variables and questionnaire items
|
Variable |
Questionnaire Items |
|
PCRV |
1.EVs are more expensive than conventional fuel-powered vehicles. 2.The EV battery replacement cost is high. 3.EVs have a lower resale value than conventional fuel-powered vehicles. |
|
OCS |
1.EV owners save on fuel/energy costs. 2.Routine maintenance costs of EVs are lower because they have fewer parts. 3.Repair costs of EVs are lower due to their fewer mechanical issues. |
|
DC |
1.EVs are comfortable with less noise during driving. 2.EVs are comfortable with low vibration during driving. |
|
TRL |
1.There are fewer EV models to choose from. 2.EVs do not satisfy drivers’ expectations of top speed. 3.EVs do not satisfy drivers’ expectations of vehicle power. 4.There is insufficient information about the safety and reliability of EVs. 5.There is insufficient maintenance and repair services available in the Philippines. |
|
BCC |
1.EVs have a limited battery driving range (distance covered by a fully charged battery). 2.EV battery charging time is long. 3.There are very few public charging stations, and hence charging stations may be difficult to find when needed, causing anxiety to the driver. 4.I do not have enough garage space for charging at home, and/or it can be expensive and difficult to adapt our electricity system for EV battery charging. |
|
EB |
1.EVs have less or no emissions, so they can make the air in my surroundings cleaner and help in climate change mitigation. 2.There is an abundance of clean and renewable sources of electricity in the Philippines, such as solar, wind, biomass, hydropower, and geothermal. 3.Driving an EV signifies care for the environment. |
|
EC |
1.A significant amount of pollution results from battery production for EVs. 2.There is yet no adequate infrastructure for the disposal of used EV batteries. 3.In the Philippines, electricity is generated mainly from burning coal and fossil fuels which results in a lot of CO2 emissions. |
|
PV |
1.Over-all, considering the vehicle price, energy costs and maintenance costs, EV is less costly than conventional fuel-powered vehicle. 2.I think EV is a good buy. |
|
ELCON |
1.Electricity is very expensive in the Philippines. 2.I am concerned that the supply of electricity in the Philippines is not sufficient and unstable. 3.More EVs will further increase the demand for electricity and hence, raise electricity price further. |
|
ENCON |
1.Climate change can harm me and my family. 2.I am concerned about human behavior and activities that cause climate change and environmental damage. 3.I think people are not doing enough to protect the environment and preserve scarce natural resources. |
|
EI |
1.In general, I am among the first in my circle of friends to know about new pro-environmental products when they appear. 2.In general, I am among the first in my circle of friends to buy new pro-environmental products when they appear. 3.I own more pro-environmental products than my friends. |
|
FI |
1.Exempting EV parts and accessories from import and sales taxes will encourage use of EVs. 2.Exempting EVs from the excise tax on automobiles will make EVs more affordable and increase EV sales. 3.Overall, FI (subsidies and tax exemption or reduction) can induce me to consider EV for my next vehicle purchase. |
|
NFI |
1.Government programs to increase the number of charging stations all over the country are needed to promote the widespread use of EVs. 2.Preferential measures for EVs such as exemption from the unified vehicular volume reduction scheme (color coding), priority in registration and issuance of plate number, and free toll fees/parking can encourage me to buy and drive an EV. 3.Overall, non-financial support programs can encourage me to use an EV. |
|
Adoption intention |
1.I intend to buy an EV in the near future. 2.I recommend that others buy an EV. 3.I am willing to pay the higher price of EV. |
4.1 Respondents’ profile
Table 3 presents the profile of respondens. There is sufficient representation for all age groups in the sample. Except for the expectedly less active (retired) 65 years or more group, each age group accounts for at least 15% of the entire sample size. Majority of the respondents are male (60%) and are college graduates (69%). Most of the respondents (78%) are working - 50% are permanent employees, 15% are running their own business, 10% are professionals, and 3% are contractual employees. Only 22% of respondents are not part of the workforce (9% are students, and 13% are retired or unemployed). Following the social class-income taxonomy for the Philippines ([23], as updated in [24]), the majority 59% of the respondents belong to the middle-income class consisting of 18% low-middle (PhP25,000-49,999), 25% middle-middle (PhP50,000-99,999), and 16% upper-middle (PhP100,000-149,999). Upper-income class (PhP150,000-250,000) and the rich class (more than PhP250,000) account for 30% of respondents, while the low-income class account for the remaining 11% of respondents. According to Zoleta [24], in Metro Manila and other traffic-congested cities, most cars are owned by the middle-income class. Middle-class households are described to be “less dependent on government, shifting away from using public services and leaning towards private ones”, particularly “in the case of transportation, healthcare, and education”.
Following the classification of Pamidimukkala et al. [10], 75% of the respondents are experienced drivers with more than five years of driving experience, while 16% are beginners with only 1-2 years driving experience. The remaining 10% are intermediate drivers (3-5 years). Majority of the respondents use their vehicle/s for travel to work/school (82%) and drive a daily distance of less than 50 km (67%). About 38% of respondents have only one car, 34% have two cars, and 28% have three or more cars.
Table 3. Respondents’ profile
|
|
Proportion (%) of Respondents |
|
AGE |
|
|
Below 25 years old |
15.0 |
|
25-34 years old |
15.3 |
|
35-44 years old |
20.4 |
|
45-54 years old |
28.0 |
|
55-64 years old |
16.6 |
|
More than 65 years old |
4.8 |
|
GENDER |
|
|
Male |
59.9 |
|
Female |
39.5 |
|
Others |
0.6 |
|
EDUCATION |
|
|
Elementary |
0.3 |
|
High school |
5.4 |
|
Vocational school |
2.5 |
|
College |
68.8 |
|
Post-graduate |
22.9 |
|
WORK STATUS |
|
|
Not yet working/student |
13.4 |
|
Permanent employee |
49.7 |
|
Contractual employee |
2.5 |
|
Freelance/practice of profession |
10.5 |
|
Own business |
14.6 |
|
Retired/unemployed |
9.2 |
|
HOUSEHOLD INCOME |
|
|
Less than PhP25,000 |
11.8 |
|
PhP25,000-49,999 |
17.8 |
|
PhP50,000-99,999 |
24.5 |
|
PhP100,000-149,999 |
16.2 |
|
PhP150,000-199,999 |
8.6 |
|
PhP200,000-249,999 |
6.1 |
|
PhP250,000 or more |
15.0 |
|
YEARS DRIVING |
|
|
1-2 years |
15.6 |
|
3-5 years |
9.9 |
|
More than 5 years |
74.5 |
|
NUMBER OF VEHICLES |
|
|
1 |
37.9 |
|
2 |
33.8 |
|
3 or more |
28.3 |
|
MAIN USE OF VEHICLE |
|
|
Travel to work/school |
82.2 |
|
Weekend and holiday trips |
17.8 |
|
DAILY DRIVING DISTANCE |
|
|
Less than 50 km |
67.2 |
|
50-99 km |
22.6 |
|
100-199 km |
6.7 |
|
More than 200 km |
3.5 |
4.2 Respondents’ awareness and opinions
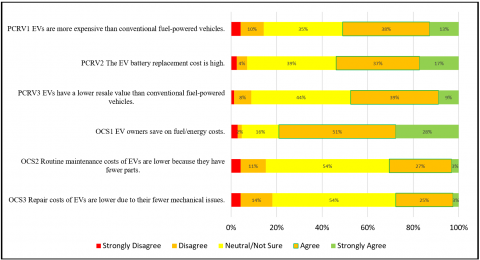
Survey results pertaining to statements on financial costs are presented in Figure 2. The first three statements are on the purchase price and resale value of EV. While more than half of the respondents are aware of the higher acquisition costs of EV - the higher price of EV relative to the fuel-powered vehicle (51% agree and strongly agree answers) and of the high replacement cost of the EV battery (54%), slightly less (48%) think that it has a lower resale value with 44% of respondents indicating uncertainty about the EV’s resale value. In terms of operational costs, respondents appear to be mostly aware only of the fuel savings (79%), and not of the lower routine maintenance (30%) and repair costs of EV (28%).
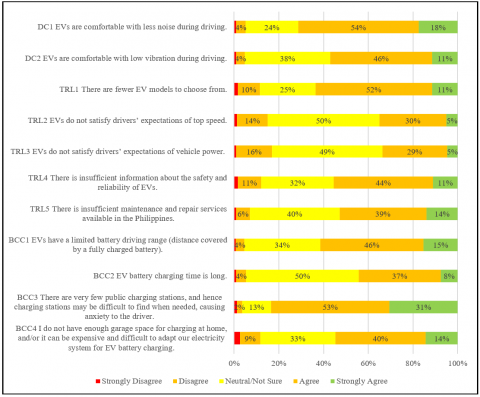
Non-financial quality attributes of EV are included in Figure 3. First, majority of respondents are aware of the convenience or comfort in driving EV in terms of less noise (DC1: 72%) and vibrations (DC2: 57%). For technological limitations or risks, the largest proportion of respondents are concerned about limited EV models (63%). The second most prevalent technological concern is the limited information about EV (55%), followed by inadequate maintenance and repair service providers (53%). There is much less concern about speed (35%) and vehicle power (34%).
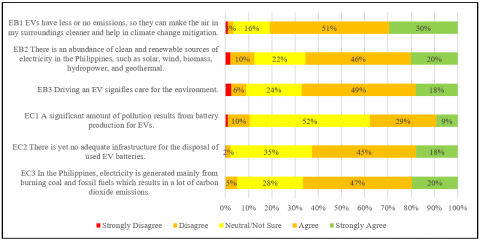
Survey results reveal that a substantial majority of respondents are aware of the positive environmental implications of EV use (Figure 4). Most agree that EV can contribute to pollution control and climate change mitigation (81%), that driving an EV is a way to protect the environment (67%), and that the Philippines has abundant clean and renewable sources of electricity for EV (66%). Likewise, respondents appear to be conscious about the negative environmental implications - CO2 emissions from burning coal and fossil fuels to produce electricity for EV (67%) and the potential damage to the environment of used batteries when infrastructure for disposal is still inadequate (63%). However, only 38% are aware of pollution that can be generated from battery production.
Figure 2. PCRV and OCS
Figure 3. DC, BCC, and TRL
Figure 4. EB and EC
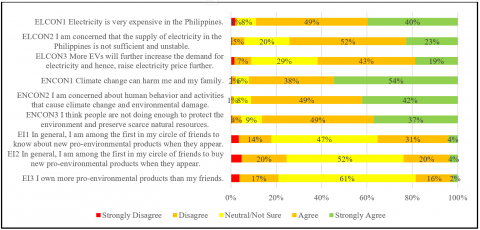
Figure 5 presents three factors, apart from PV of EV, that can influence EV adoption. The first relates to concerns about the price and supply of electricity in the Philippines. Most respondents (89%) think that electricity price in the country is very high. Albeit to a less extent, a substantial majority of respondents are concerned about the adequacy and stability of electricity supply in the country (75%), and the heightened upward pressure on electricity price with widespread EV adoption (62%). The second pertains to opinions regarding climate change and environmental degradation. Nearly all respondents believe that climate change is harmful (92%), that people’s activities cause climate change and environmental degradation (91%), and that people are not doing enough to protect the environment (86%). And the third pertains to people’s propensity to adopt new environmentally friendly technologies. Survey results reveal insufficient EI among the respondents. While 35% of respondents claim to be early in learning about environmental products, a substantially lower proportion (24%) purchase, and only 18% consider themselves owning relatively more environmental products.
Figure 5. ELCON, ENCON, and EI
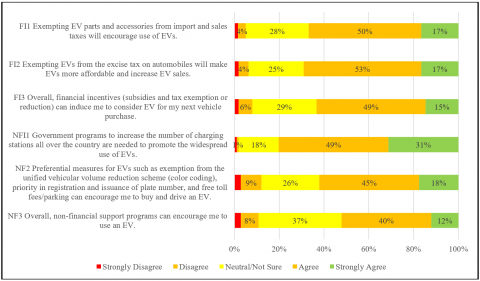
Opinions about government EV promotion strategies are presented in Figure 6. About 70% of respondents think that FI, particularly exemptions from import and excise taxes can encourage EV adoption. For non-financial measures, increasing the accessibility to public charging stations (80%) appear to be more crucial than preferential treatment for EV (63%).
Figure 6. FI and NFI
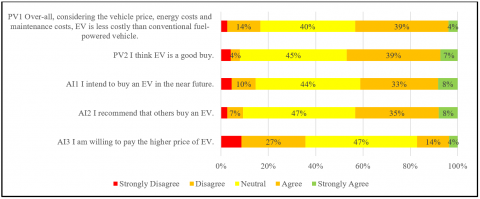
Figure 7 reveals respondents’ perception of the over-all worth of EV. It appears that less than majority of Filipinos consider EV to be less costly to use than ICE (43%), and a reasonable purchase (46%). Accordingly, indicators for EV adoption are somewhat low - only 41% expressed intention to buy an EV, 43% said they recommend the purchase of EV, and a much smaller proportion (18%) are willing to pay the higher price of EV.
Figure 7. PV and adoption intention
4.3 Determinants of EV value and intention to adopt
Regression results presented in the first panel of Table 4 identify the factors that contribute to the individual’s perception of the value of EV. Six of the seven factors have statistically significant coefficients. As hypothesized, OCS, DC and EB increase PV, consistent with the findings of Kim et al. [12] for South Korea.
On the other hand, EV purchase price, BCC and technological risks lower PV. While Kim et al. [12] also found that EV price and charging concerns lower EV value in South Korea, they did not obtain a statistically significant negative relationship between technological concerns and PV. Presumably, South Koreans are much more familiar and hence less concerned with the technical aspects and risks of EV, compared to the driving population in the Philippines where EV adoption rate is still very low.
The relative magnitudes of the absolute value of the coefficients of the determinants of PV indicate the extent of the influence, where larger magnitude implies larger influence. OCS has the highest positive impact on EV’s PV, followed closely by EB. For the negative contributors to EV’s PV, BCC have the strongest impact, followed closely by technological limitations; while purchased cost and resale value have a much weaker negative effect.
The regression results also suggest that EC associated with EV have no statistically significant effect on PV. This is consistent with the results of Pamidimukkala et al. [10] who investigated four categories of barriers to EV adoption in the USA. They found that of the four categories of barriers to EV adoption - financial, infrastructural (charging), technical and environmental, only the latter which pertains to the EC of battery production and disposal of used batteries do not significantly lead to non-adoption.
The second panel of Table 4 reveals that EV adoption intention in the Philippines is positively correlated with PV, EI, and FI and NFI. These results are consistent with the findings of Kim et al. [12] for South Korea. Considering all the benefits and costs of EV - monetary and non-monetary - a higher over-all PV induces adoption. PV has the largest positive impact on EV adoption, with a coefficient of 0.557 which is more than two-times the coefficient of each of the other three positive factors. This implies that an improvement in PV is twice as influential in raising EV adoption as fi or NFI or EI. Remarkably, NFI (with a coefficient of 0.208) appear to have a stronger impact than FI (coefficient of 0.162). Presumably, respondents consider the availability of charging stations and preferential measures for EV ownership in the country’s registration, traffic and parking schemes to be more crucial. Non-financial measures are directly availed of by the consumers and hence more recognized and appreciated. This is in contrast with financial measures that are coursed through the EV industry manufacturers and distributors, and consumers are not aware of the extent to which these incentives to the EV industry are benefitting them (i.e., the extent by which the incentives and tax exemptions are lowering the purchase price of EV). Finally, an individual with a higher propensity to know and acquire pro-environmental products (EI) are more likely to consider owning an EV. This factor, nonetheless, has the least positive influence on EV adoption.
Concerns about the high price of electricity in the Philippines and uncertainties about its supply have a significant negative effect on EV adoption. Electricity has been a long-standing issue in the country that is yet to be adequately addressed by policy makers. It is therefore not surprising that this will have a bearing on the decision to use EV. This finding points to the urgent need for reforms to stabilize the price and supply of electricity, such as the shift to renewable energy sources (e.g., solar, wind, hydropower, geothermal, biomass) which are abundant in the Philippines.
On the other hand, concerns about neglect or insufficient attention and effort to protect the environment will not necessarily lead to greater EV adoption. Axsen et al. [24] argued that not all pro-environmentalists might be willing to buy an EV. They found that individuals with pro-environmental behaviors, but were least open to change and less interested in technological solutions were the least interested in buying EV.
Table 4. Regression results
|
|
Coefficient (Std. Error) |
|
PV |
|
|
PCRV |
-0.091* (0.055) |
|
OCS |
0.289*** (0.057) |
|
DC |
0.148*** (0.048) |
|
BCC |
-0.158** ((0.065) |
|
TRL |
-0.151** (0.068) |
|
EB |
0.270*** (0.050) |
|
EC |
0.052 (0.065) |
|
Constant |
2.011*** (0.364) |
|
Adoption intention |
|
|
PV |
0.557*** (0.044) |
|
ELCON |
-0.092** (0.044) |
|
ENCON |
-0.063 (0.049) |
|
EI |
0.108*** (0.041) |
|
FI |
0.162*** (0.050) |
|
NFI |
0.208*** (0.053) |
|
Constant |
0.212 (0.260) |
|
No of observations |
314 |
|
PV Equation Adjusted R2 AI Equation Adjusted R2 |
0.3095 0.5791 |
Notes: *10% level of significance; **5% level of significance; ***1% level of significance
The transport sector dominates total energy demand in the Philippines. Projected to grow at an average annual rate of 7.1%, its share in energy demand is expected to reach 38-39% by 2040. In terms of GHG emissions, the transport sector’s share is expected to reach 30% in 2040. With land transport accounting for the substantial 80% of domestic traffic and 60% of freight traffic in the Philippines (PEP 2020-2040), mainstreaming the use of EV can be a crucial component of the country’s climate change mitigation strategy. Drafted in 2023, the Philippine government’s Comprehensive Roadmap for the Electric Vehicle Industry targets a 50% EV penetration rate in 2040 when the EV share in total land transportation fleet in 2021 was even short of 1%. Formulating effective measures and implementation strategies to achieve this highly optimistic goal requires a thorough understanding of the end-users’ concerns and aspirations about EV as a mainstream road transport mode.
This paper presents the results of a survey on Filipinos’ awareness and preferences for EV and identifies the factors that influence the individual’s intention to purchase and use EV using SEM. First, the individual’s perception of the over-all value of EV is specified as a function of all benefits and costs factors associated with EV. The regression results reveal that higher PV arises from a higher awareness and appreciation of EV’s OCS, DC, and EB. On the other hand, BCC, technological risks, and purchase cost lower EV’s PV. Only EC does not significantly affect PV. Second, the study finds that EV adoption intention is positively correlated with PV, FI and NFI for EV use, and the individual’s EI. PV has the strongest positive influence on EV adoption. NFI appear to be more important than FI. On the other hand, concerns about electricity supply and prices significantly lower EV adoption potential.
These findings reveal the importance of continuing and intensifying direct interventions in the EV sector most particularly in the following three areas: (1) battery charging (legislation and programs to ensure an expansive network of easily accessible public charging stations, availability of charging hardware and space in residential buildings and carparks, and collection and dissemination of data on charging stations); (2) preferential measures for EV (free parking schemes; exemption from toll fees; access to bus lanes, priority registration); and (3) information campaign. These three areas proved to be crucial in the success of EV adoption policies in countries such as Norway which achieved almost 90% EV adoption rate in 2024. In addition to the purchase and import tax exemptions to make EV price more comparable to ICE’s, the Norwegian government established fast-charging stations on all main roads as well as promoted level-1 charging - lower-power charging stations at home, businesses and schools (e.g., a “charging right” for people living in apartment building was legislated); exempted EV from toll, road, ferry, and municipal parking charges; gave EV access to bus lanes; and fostered public acceptance and awareness of EV [25].
Moreover, the relative importance of non-financial and soft measures over the financial (tax) incentives, together with the relatively smaller impact of EV purchase price on PV found in this study for the Philippines augur well for the viability of removing the financial (tax) measures in the medium and long-term. EV tax exemptions will have to be lifted eventually as they impose a heavy burden on the Philippine government budget. Moving away from tax measures can be helped further by the continuing decline in battery production cost, the main item contributing to the high EV price.
For information campaigns, survey results reveal the need to highlight some specific aspects of EV. For example, since operating costs savings has the strongest positive effect on PV and only fuel cost savings are currently well-known, information campaign can focus on the other two much less known components of OCS, namely, routine maintenance and repair costs. Also, it is crucial to disseminate accurate information and raise familiarity with EV attributes such as its driving convenience and technical limitations. Krause et al. [26] emphasized the importance of the accuracy of perception on actual EV uptake. Familiarization may also be achieved through the promotion of an EV procurement program in government as well as corporate entities [27].
Finally, with concerns about the high price of electricity in the Philippines and uncertainties about its supply significantly discouraging EV adoption, reforms to stabilize the price and supply of electricity in the country become even more imperative. The energy sector transition from imported fuel sources, which are affected by volatile world market price and exchange rates, to renewable energy sources (e.g., solar, hydropower, wind, biomass, geothermal) which are abundant in the Philippines [28] must be pursued in tandem with the EV promotion programs.
This research is funded by the University Research Council of the Ateneo de Manila University. Research assistance of Mr. Gerald Gracius Pascua and Ms. Marilyn Palanca is also gratefully acknowledged.
[1] IEA (International Energy Agency). (2023). Tracking clean energy progress. IEA, Paris. https://www.iea.org/reports/tracking-clean-energy-progress-2023.
[2] Statista. (2024). Distribution of carbon dioxide emissions produced by the transportation sector worldwide in 2022, by sub sector. https://www.statista.com/statistics/1185535/transport-carbon-dioxide-emissions-breakdown.
[3] BNEF (Bloomberg NEF). (2020). Electric vehicle outlook: Executive summary. https://about.bnef.com/electric-vehicle-outlook.
[4] Rosellon, M.A.D. (2021). Clean energy technology in the Philippines: Case of the electric vehicle industry (No. 2021-15). PIDS Discussion Paper Series.
[5] DOE (Department of Energy, Philippines). (2023). 2023-2040 philippine comprehensive roadmap for the electric vehicle industry (CREVI). https://doe.gov.ph/sites/default/files/pdf/energy_efficiency/CREVI-2023_Updated.pdf.
[6] DOE. (2022). Philippine energy plan 2020-2040: Towards a sustainable and clean energy future. https://www.doe.gov.ph/sites/default/files/pdf/pep/PEP%202022-2040%20Final%20eCopy_20220819.pdf.
[7] LTO (Land Transportation Office). (2021). Powerpoint presentation at the 9th Philippine Electric Vehicle Summit, 20-21 August 2021.
[8] Palanca-Tan, R, (2024). Factors influencing household adoption of rooftop solar power in the Philippines: An empirical analysis using the Contingent Valuation Method. Challenges in Sustainability, 12(3): 163-177. https://doi.org/10.56578/cis120301
[9] Junquera, B., Moreno, B., Álvarez, R. (2016). Analyzing consumer attitudes towards electric vehicle purchasing intentions in Spain: Technological limitations and vehicle confidence. Technological Forecasting & Social Change, 109: 6-14. http://doi.org/10.1016/j.techfore.2016.05.006
[10] Pamidimukkala, A., Kermanshachi, S., Kermanshachi, J.M., Hladik, G. (2023). Evaluation of barriers to electric vehicle adoption: A study of technological, environmental, financial, and infrastructure factors. Transportation Research Interdisciplinary Perspectives, 22: 100962. https://doi.org/10.1016/j.trip.2023.100962
[11] Adnan, N., Nordin, S.M., Amini, M.H., Langove, N. (2018). What make consumer sign up to PHEVs? Predicting Malaysian consumer behavior in adoption of PHEVs. Transportation Research Part A, 113: 259-278. https://doi.org/10.1016/j.tra.2018.04.007
[12] Kim, M.K., Oh, J., Park, J.H., Joo, C. (2018). Perceived value and adoption intention for electric vehicles in Korea: Moderating effects of environmental traits and government supports. Energy, 159: 799-809. https://doi.org/10.1016/j.energy.2018.06.064
[13] Broadbent, G.H., Metternicht, G.I., Wiedmann, T.O. (2021). Increasing electric vehicle uptake by updating public policies to shift attitudes and perceptions: Case study of New Zealand. Energies, 14(10): 2920. https://doi.org/10.3390/ en14102920
[14] Broadbent, G., Drozdzewski, D., Metternicht, G. (2017). Electric vehicle adoption: An analysis of best practice and pitfalls for policy making from experiences of Europe and the US. Geography Compass, 12(2): e12358. https://doi.org/10.1111/gec3.12358
[15] Kim, H.W., Chan, H.C., Gupta, S. (2007). Value-based adoption of mobile internet: An empirical investigation. Decision Support Systems, 43(1): 111-126. https://doi.org/10.1016/j.dss.2005.05.009
[16] Woodruff, R.B. (1997). Customer value: The next source of competitive advantage. Journal of the Academy of Marketing Science, 25: 139-153. http://doi.org/10.1007/BF02894350
[17] Yang, H., Yu, J., Zo, H., Choi, M. (2016). User acceptance of wearable devices: An extended perspective of verceived value. Telematics and Informatics, 33: 256-269. https://doi.org/10.1016/j.tele.2015.08.007
[18] Chu, C.W., Lu, H.P. (2007). Factors influencing online music purchase intention in Taiwan: An empirical study based on the value-intention framework. Internet Research Electronic Networking Applications & Policy, 17: 139-155. https://doi.org/10.1108/10662240710737004
[19] Turel, O., Serenko, A., Bontis, N. (2010). User acceptance of hedonic digital artifacts: A theory of consumption values perspective. Information and Management, 47(1): 53-59. https://doi.org/10.1016/j.im.2009.10.002
[20] Yu, J., Lee, H., Ha, I., Zo, H. (2015). User acceptance of media tablets: An empirical examination of perceived value. Telematics and Informatics, 34(4): 206-223. https://doi.org/10.1016/j.tele.2015.11.004
[21] Alanazi, F. (2023). Electric vehicles: Benefits, challenges, and potential solutions for widespread adaptation. Applied Sciences, 13(10): 6016. https://doi.org/10.3390/app13106016
[22] Palanca-Tan, R, del Barrio Alvarez, D., Palanca, R.S., Tan, N.M.P., Castillo, G.B., Saplala, D.C., Wang, N. (2024). Households’ preferences for alternative renewable tnergy technologies: An attribute-based choice experiment survey in Metro Manila, Philippines. International Journal for Sustainable Development and Planning, 19: 1-10. https://doi.org/10.18280/ijsdp.190101
[23] Albert, J.R.G., Santos, A.G.F, Vizmanos, J.F.V. (2018). Defining and profiling the middle class. Philippine Institute for Development Studies Policy Notes No. 2018-18.
[24] Zoleta, V. (2023). Understanding social classes in the Philippines: Where do you belong? Moneymax. https://www.moneymax.ph/personal-finance/articles/social-class-philippines.
[25] Axsen, J., TyreeHageman, J., Lentz, A. (2012). Lifestyle practices and pro-environmental technology. Ecological Economics, 82: 64-74. https://doi.org/10.1016/j.ecolecon.2012.07.013
[26] Martin, N. (2025). How Norway became the trailblazer for electric vehicles? https://www.dw.com/en/how-norway-became-the-trailblazer-for-electric-vehicles/a-71208744#:~:text=Norway%20levied%20no%20VAT%20(Value,and%20around%20the%20capital%2C%20Oslo.
[27] Krause, R.M., Carley, S.R., Lane, B.W., Graham, J.D. (2013). Perception and reality: Public knowledge of plug-in electric vehicles in 21 U.S. cities. Energy Policy, 63: 433-440. https://doi.org/10.1016/j.enpol.2013.09.018
[28] Palanca-Tan, R, Sugiyama, M, del Barrio Alvarez, D., Castillo, G.B., Tan, N.M.P. (2023). Metro Manila households willingness to pay for renewable energy as a climate change mitigation measure: A CVM study. Sustainability Science, 20: 345-360. https://doi.org/10.1007/s11625-023-01403-3