Ihsen Abid![]()
© 2025 The author. This article is published by IIETA and is licensed under the CC BY 4.0 license (http://creativecommons.org/licenses/by/4.0/).
OPEN ACCESS
This study aims to investigate the determinants of adjusted net savings (ANS) in South Asia from 1985 to 2023, focusing on how macroeconomic factors such as final consumption expenditure (FCE), foreign direct investment (FDI), inflation, GDP growth, and domestic credit to the private sector (CRE) influence sustainable savings. This research employs an Autoregressive Distributed Lag (ARDL) model and an Error Correction Model (ECM) to examine the long-term and short-term relationships between the variables. The results indicate that higher FCE significantly reduces ANS, while GDP growth positively contributes to sustainable savings. FDI shows a delayed positive effect, suggesting its long-term benefits, whereas inflation does not significantly impact ANS in the short run. CRE demonstrates a positive but inconsistent effect on sustainable savings. The ECM results confirm a long-run equilibrium relationship among the variables, with adjustments for short-run deviations occurring over time. This study contributes to the literature on sustainable economic development by providing empirical evidence on the determinants of ANS in South Asia. It emphasizes the importance of balancing economic growth with responsible consumption and financial development, offering valuable policy insights for enhancing sustainability in the region.
adjusted net savings (ANS), economic growth, financial development, foreign direct investment (FDI), South Asia, sustainability
Sustainable economic development has become a critical concern for policymakers, especially in rapidly growing regions like South Asia. As economies expand, the need to balance economic progress with long-term environmental and financial sustainability has gained increasing attention. Adjusted net savings (ANS), also known as genuine savings, is a key indicator of sustainable development, capturing the extent to which a country invests in human capital, maintains environmental quality, and preserves its economic resources for future generations [1]. Unlike traditional savings measures, ANS accounts for factors such as natural resource depletion, pollution damages, and investments in human capital, making it a more comprehensive metric for assessing long-term economic health [2, 3].
In South Asia, economic expansion has been accompanied by high consumption, volatile inflation, increasing foreign direct investment (FDI), fluctuating economic growth, and rapid financial sector development [4]. These dynamics create both opportunities and challenges for sustainable savings. While economic growth and FDI are expected to boost capital accumulation and enhance savings [5, 6], excessive final consumption expenditure (FCE) and inflationary pressures can undermine long-term sustainability [7]. Empirical evidence suggests that high consumption spending often leads to lower savings rates, affecting a country's ability to invest in future development [8, 9]. Moreover, the role of domestic credit availability remains ambiguous, financial sector development can stimulate productive investments, yet excessive credit growth may lead to financial instability and unsustainable debt burdens [10].
Understanding the key drivers of ANS in South Asia is crucial for designing effective economic policies that promote sustainability. This study examines how FCE, FDI, inflation, economic growth, and CRE impact ANS in the region from 1985 to 2023. By utilizing panel data analysis, this research aims to provide empirical insights into the macroeconomic and financial determinants of sustainable savings in South Asia [11]. The findings will contribute to existing literature by offering policy recommendations on maintaining economic growth while ensuring long-term sustainability.
The structure of this paper is as follows: Section 2 reviews the literature on the determinants of ANS. Section 3 exhibits the methodology. Section 4 describes the data. Section 5 presents empirical results. Section 6 discusses the results, and the final section presents the conclusion of the paper.
The concept of ANS, also known as genuine savings, has gained significant attention as a key indicator of sustainable economic development. Unlike traditional savings metrics, ANS accounts for economic, environmental, and human capital investments, making it a comprehensive measure of long-term sustainability. The South Asian region, characterized by rapid economic growth, rising energy consumption, and environmental challenges, requires a thorough analysis of the determinants influencing ANS. Several studies have explored how FCE, FDI, inflation, economic growth, and financial development shape sustainability outcomes in developing economies.
2.1 FCE and savings
FCE significantly affects savings and sustainability. Classical economic theories, such as the life-cycle hypothesis [12], suggest that higher consumption reduces savings, limiting investment in sustainable development. Empirical evidence supports this view; for instance, Abeywickrama et al. [13] found that rising consumption in sub-Saharan Africa led to lower savings, thereby reducing long-term growth. Similarly, Iqbal et al. [14] analyzed panel data across developing Asia and found that excessive consumption negatively affected genuine savings, as resources were diverted away from productive investments. Jamsheed [15] also emphasized that high FCE levels in emerging economies, including South Asia, often lead to increased imports and higher external debt, negatively impacting national savings. Abid [16] further highlights the role of consumption patterns in economic stability, noting that in MENA countries, tourism-driven consumption can either enhance or destabilize savings depending on fiscal policies.
2.2 FDI and sustainable savings
FDI is often seen as a driver of economic growth and technological progress. The endogenous growth model [17] suggests that FDI enhances productivity through technology transfer and capital accumulation, potentially contributing to increased savings. Several recent studies confirm this link. Sandrone [18] analyzed FDI inflows in emerging markets and found that FDI positively influences savings when directed toward infrastructure and industrial sectors. A study by Huang et al. [19] on South Asian economies revealed that FDI enhances genuine savings through investment in renewable energy and digital infrastructure. However, some scholars caution that if FDI is resource-seeking, it may lead to environmental degradation, reducing ANS [20]. Abid et al. [21] demonstrate that political instability can distort FDI’s impact on monetary policy and economic recovery, indirectly affecting savings sustainability.
2.3 Inflation and savings behavior
Inflation can influence savings through its impact on purchasing power and financial stability. The Fisher hypothesis [22] posits that high inflation erodes real interest rates, discouraging savings. Empirical evidence from recent macroeconomic studies supports this. Mishra and Sahu [23] found that in South Asia, inflation volatility negatively impacted savings by increasing uncertainty and discouraging long-term investment. Similarly, Jacho et al. [24] examined emerging markets and found that persistent inflation reduces household savings, affecting national investment. However, some scholars argue that moderate inflation may stimulate savings by increasing the nominal return on deposits, particularly in well-regulated financial markets [25].
2.4 Economic growth and sustainable development
Economic growth is a key driver of savings and investment. The Solow growth model [26] predicts that higher GDP growth increases savings as income rises. Empirical studies validate this relationship. Aghion et al. [27] analyzed 72 developing countries and found that sustained GDP growth enhances national savings and capital accumulation. A study on South Asia by Rahman et al. [28] confirmed that economic growth positively influences ANS, as higher income levels allow for greater investments in human capital and infrastructure. However, Huo and Peng [29] caution that if economic growth is driven by resource depletion, it may negatively impact sustainability unless offset by investment in renewable energy and technological innovation. Abid et al. [30] and Chaabouni and Abid [31] emphasize that in Gulf Cooperation Council (GCC) countries, energy intensity and CO2 emissions must be managed to ensure that economic growth translates into sustainable savings.
2.5 Domestic credit and financial development
Access to domestic credit plays a critical role in shaping savings behavior. According to the financial liberalization hypothesis [32], well-developed financial markets encourage savings by expanding investment opportunities. Empirical studies confirm this relationship. Banik [33] found that financial deepening in emerging economies fosters savings and sustainable investment. Similarly, Tandan et al. [34] found that increased credit availability in South Asia enhances ANS by channeling funds into productive sectors. However, Rogoff et al. [35] warn that excessive credit expansion without proper regulation may lead to financial instability, negatively affecting savings and investment. Abid [36] underscores the importance of integrating environmental variables into financial policies to ensure that credit expansion supports green growth, as demonstrated in the case of Saudi Arabia.
The literature highlights the complex interactions between ANS and its determinants. While economic growth and FDI generally enhance ANS, FCE and inflation can exert downward pressure on sustainability. Additionally, financial development plays a dual role, promoting savings while also posing risks if mismanaged. These findings provide a strong foundation for further empirical analysis in South Asia.
The Autoregressive Distributed Lag (ARDL) Bounds Testing Approach, introduced by Pesaran et al. [37], is a widely used econometric technique for analyzing both short-run and long-run relationships among variables, particularly when the underlying series are integrated of mixed order, i.e., I(0) and I(1)—but not I(2). Its flexibility in allowing different lag lengths for different variables and suitability for small sample sizes make it a robust choice for time series analysis.
In this study, the ARDL and corresponding Error Correction Model (ECM) were estimated using Stata 17, which supports ARDL modeling. The ARDL command, developed by Kripfganz and Schneider [38], facilitates bounds testing for cointegration, automatic lag selection using Akaike or Schwarz information criteria, and estimation of both short-run coefficients and the long-run relationship. The error correction term (ECT) derived from the ECM captures the speed at which deviations from the long-run equilibrium are corrected over time.
3.1 ARDL model specification
Model selection is critical in ensuring the reliability of the ARDL-ECM estimation. The lag length selection process plays a vital role in capturing dynamic relationships between variables. The Akaike Information Criterion (AIC) [39] and Schwarz Bayesian Criterion (SBC) [40] are widely used to determine the optimal lag length, balancing model complexity and goodness of fit. While AIC tends to favor more lags to minimize information loss, SBC is more parsimonious and penalizes excessive parameters.
The general form of the ARDL model for a dependent variable Yt and independent variables Xt is:
$Y_t=\alpha+\sum_{i=1}^p \beta_i Y_{t-i}+\sum_{i=0}^q \gamma_j X_{t-j}+\varepsilon_t$ (1)
where:
$Y_t$ is the dependent variable.
$X_t$ represents the independent variable(s).
$\alpha$ is the intercept.
$\beta_i$ and $\delta_i$ are the short-run coefficients.
$\varepsilon_t$ is the error term.
$p$ and $q$ are lag lengths.
3.2 Bounds test for long-run relationship
The Bounds Test developed by Pesaran et al. [37] determines whether a cointegrating (long-run) relationship exists among the variables. It involves testing the null hypothesis:
$\mathbf{H}_0: \theta_1=\theta_2=\ldots=\theta_{\mathrm{k}}=0$ (No long-run relationship)
$\mathbf{H}_1: \theta_1 \neq \theta_2 \neq \ldots \neq \theta_k \neq 0$ (Long-run relationship exists)
This test compares the computed F-statistic against critical values, and if the F-statistic exceeds the upper bound, cointegration is confirmed.
3.3 ECM model specification
If a long-run relationship exists (confirmed by the Bounds Test), the ECM version of the ARDL model is formulated as:
$\begin{gathered}\Delta Y_t=\lambda\left(Y_{t-1}-\theta_0-\sum_{j=1}^k \theta_j X_{j t-1}\right)+ \sum_{i=1}^{p-1} \gamma_i \Delta Y_{t-i}+\sum_{j=0}^{q-1} \delta_j \Delta X_{t-j}+\eta_t\end{gathered}$ (2)
where:
$\lambda$ is the error correction term (ECT), which should be negative and statistically significant to confirm the speed of adjustment toward equilibrium.
$\theta_0$ and $\theta_i$ are the long-run coefficients.
$\eta_t$ is the white noise error term.
3.4 Diagnostic tests for ARDL-ECM model
Diagnostic tests are crucial in validating the robustness and reliability of the ARDL-ECM model. One of the key tests is the Breusch-Godfrey LM test for autocorrelation, which examines whether the residuals are serially correlated. The null hypothesis assumes no autocorrelation, and if rejected, it indicates potential model misspecification [41, 42].
Another important diagnostic is the heteroscedasticity test, which determines whether the variance of residuals remains constant. The White’s test is a general test that does not require a predefined structure of heteroscedasticity [43], while the Breusch-Pagan/Cook-Weisberg test specifically detects linear heteroscedasticity by regressing squared residuals on independent variables [44].
To assess the normality of residuals, the Shapiro-Wilk test is widely used, with the null hypothesis assuming a normal distribution of errors. A significant result suggests that the residuals deviate from normality, which could affect inference [45].
Once the model is specified, its stability must be verified to ensure consistent and reliable results. The CUSUM (Cumulative Sum) and CUSUMSQ (Cumulative Sum of Squares) tests [46] are commonly employed to check the structural stability of the model. These tests plot the cumulative sum of recursive residuals over time, with confidence bands indicating whether the estimated coefficients remain stable. If the plots remain within the critical bounds, the model is considered stable; otherwise, structural breaks or misspecifications may be present. Ensuring appropriate lag selection and model stability enhances the robustness of the ARDL-ECM approach, leading to more reliable long-run and short-run estimates.
These diagnostic tests collectively ensure that the ARDL-ECM model meets fundamental statistical assumptions, thereby enhancing the reliability of the estimated relationships.
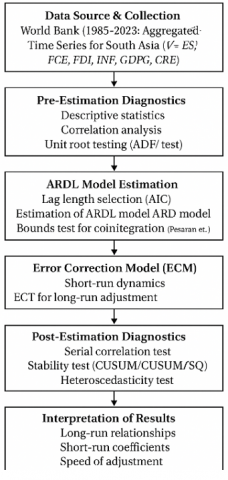
The methodological steps are summarized in Figure 1.
Figure 1. Methodological framework for assessing the drivers of economic sustainability in South Asia
This methodological framework ensures both robustness and reproducibility, enabling accurate inference on the dynamic interactions among the variables studied.
This study uses regionally aggregated time series data for South Asia, covering the period 1985 to 2023. The dataset is derived from World Bank indicators and represents regional-level aggregates or averages for six South Asian countries: Bangladesh, Bhutan, India, Maldives, Nepal, and Sri Lanka. As such, the data form a single time series for each variable, allowing for country-level heterogeneity to be smoothed into a composite regional trend.
The data set includes variables related to sustainability, macroeconomic stability, financial development, investment, and consumption. The dependent variable, ANS, excluding particulate emission damage (% of GNI) (ES), serves as a proxy for economic sustainability. All variables measured as ratios or percentages, such as FDI, CRE, and ES, were transformed using natural logarithms (ln) to reduce heteroskedasticity and improve normality. However, variables expressed in growth rates, FCE, Inflation (INF), and GDP growth (GDPG), were kept in their original form, as logarithmic transformation of growth rates is not appropriate. No standardization (z-score transformation) or normalization (min-max scaling) was applied to the dataset, as the focus was on preserving the interpretability of the original economic units and elasticities within the ARDL framework.
The data description is provided in Table 1.
Table 1. Data description
|
Category |
Variable |
Abbrev. |
|
Economic sustainability |
ANS, excluding particulate emission damage (% of GNI) |
ES |
|
Consumption |
FCE (annual % growth) |
FCE |
|
Investment |
FDI, net inflows (% of GDP) |
FDI |
|
Macroeconomic Stability |
Inflation, consumer prices (annual %) |
INF |
|
Economic Growth |
GDP growth (annual %) |
GDPG |
|
Financial Development |
Domestic credit to private sector (% of GDP) |
CRE |
The dependent variable, ES, reflects the long-term sustainability of economic activities by accounting for investments in human capital, depletion of natural resources, and environmental degradation. The independent variables include FCE, which captures the overall spending behavior in the economy, and FDI (foreign direct investment inflows as a percentage of GDP), indicating external capital investments. Additionally, INF (inflation, consumer prices) represents macroeconomic stability, while GDPG (GDP growth rate) measures economic expansion. Lastly, CRE (domestic credit to the private sector) reflects financial sector development and credit accessibility. This dataset provides a comprehensive view of how economic growth, investment, and financial policies influence sustainable savings and long-term economic resilience in South Asia.
The correlation matrix provides insights into the relationships between adjusted net savings (ES) and its explanatory variables in the South Asian dataset (Table 2).
Table 2. Correlation matrix
|
Variable |
ES |
FCE |
FDI |
INF |
GDPG |
CRE |
|
ES |
1.0000 |
|
|
|
|
|
|
FCE |
0.2584 |
1.0000 |
|
|
|
|
|
FDI |
0.9412 |
0.1828 |
1.0000 |
|
|
|
|
INF |
-0.4623 |
-0.0793 |
-0.4912 |
1.0000 |
|
|
|
GDPG |
0.1734 |
0.8640 |
0.0372 |
-0.0573 |
1.0000 |
|
|
CRE |
0.8478 |
0.2104 |
0.8159 |
-0.4305 |
0.0401 |
1.0000 |
ES shows a strong positive correlation with FDI (0.9412) and CRE (0.8478), suggesting that FDI and CRE are key drivers of sustainable savings. FCE has a moderate positive correlation with ES (0.2584), indicating a weaker but still relevant association. Conversely, INF (inflation) exhibits a negative correlation with ES (-0.4623), implying that higher inflation tends to reduce sustainable savings. GDPG (GDP growth) has a weak positive correlation with ES (0.1734), which may indicate that economic growth alone does not strongly influence sustainability. Among independent variables, FCE and GDPG are highly correlated (0.8640), suggesting potential multicollinearity. Similarly, FDI and CRE (0.8159) show a strong association, which might necessitate further multicollinearity diagnostics before regression analysis.
While the correlation matrix (Table 2) revealed some high pairwise correlations, particularly between FDI and CRE (0.8159), Variance Inflation Factors (VIF) were computed to further investigate potential multicollinearity. As shown in Table 3, all VIF values were below the commonly accepted threshold of 5, with a mean VIF of 2.51, suggesting that multicollinearity is not a serious concern in the model. This confirms that the model estimation results can be interpreted with confidence regarding the stability and reliability of the coefficients.
Table 3. Variance Inflation Factor (VIF) results
|
Variable |
VIF |
1/VIF |
|
GDPG |
4.6300 |
0.2160 |
|
FCE |
4.4300 |
0.2260 |
|
DFDI |
1.1900 |
0.8430 |
|
DINF |
1.1700 |
0.8530 |
|
DCRE |
1.1500 |
0.8680 |
|
Mean VIF |
2.5100 |
|
The summary statistics provide an overview of the distribution and variability of the variables in the dataset for South Asia from 1985 to 2023 (Table 4).
Table 4. Summary statistics
|
Variable |
Obs |
Mean |
Std. Dev. |
Min |
Max |
|
ES |
42 |
2.7233 |
0.3230 |
2.0349 |
3.1486 |
|
FCE |
44 |
4.9986 |
2.1807 |
-3.5468 |
9.2302 |
|
FDI |
44 |
-0.6681 |
1.2984 |
-3.6199 |
1.1878 |
|
INF |
44 |
1.9350 |
0.4074 |
1.1469 |
2.5886 |
|
GDPG |
44 |
5.6602 |
2.1845 |
-4.5827 |
8.7636 |
|
CRE |
42 |
3.4333 |
0.3211 |
2.9722 |
3.8996 |
The dependent variable, ES (adjusted net savings excluding particulate emission damage), has an average value of 2.72% of GNI, with a relatively low standard deviation, indicating limited variation across observations. Among the independent variables, FCE has a mean of 4.99% with a wider spread and a minimum value of -3.55%, suggesting fluctuations in consumption trends. FDI (foreign direct investment, net inflows as % of GDP) shows a negative mean (-0.67) with a high standard deviation, implying significant variation in investment inflows, including negative values representing disinvestment periods. INF (inflation) has a mean of 1.93% with relatively low variability, suggesting stable inflation rates. GDPG (GDP growth) averages 5.66% but exhibits a high standard deviation with a minimum of -4.58%, indicating periods of economic contraction. CRE has a mean of 3.43% with a low standard deviation, suggesting moderate fluctuations in credit availability. The varying levels of dispersion among variables highlight the importance of further econometric analysis to assess their impact on sustainable savings.
To ensure stationarity, we performed the Dickey-Fuller tests for unit roots. Based on the results, the first difference was applied to non-stationary series integrated of order one [I(1)], while stationary variables [I(0)] were retained in their level form, consistent with the requirements of the ARDL bounds testing approach [37].
The first-differenced form of each variable is denoted with a "D" prefix. Specifically, DES refers to the first difference of the natural logarithm of ANS, capturing the short-term change in economic sustainability. DFCE represents the first difference of FCE, DFDI denotes the first difference of the natural logarithm of FDI, and DINF is the first difference of Inflation. Likewise, DGDPG represents the change in annual GDP growth, and DCRE denotes the first difference of the natural logarithm of CRE. These differenced variables are essential for capturing short-run deviations from equilibrium relationships in the ECM while ensuring the stationarity of the series.
The results for the variables in both level and first differences are presented in Table 5.
ANS is non-stationary, indicating the presence of a unit root, while FCE and GDP growth are stationary, making them reliable for analysis. In contrast, variables such as FDI, CRE, and inflation are non-stationary, posing challenges for modeling. However, transformed variables reflecting differences exhibit strong stationarity, which is crucial for econometric analyses like ECMs. Overall, these results suggest that while some variables need transformation, many are suitable for further modeling, ensuring robust analytical outcomes.
Table 5. Dickey-Fuller test results
|
Variable |
Test Statistic |
MacKinnon P-value |
|
ES |
-2.4350 |
0.1320 |
|
FCE |
-7.0910 |
0.0000 |
|
FDI |
-1.4680 |
0.5495 |
|
INF |
-2.8270 |
0.0545 |
|
GDPG |
-6.5610 |
0.0000 |
|
CRE |
-0.7120 |
0.8436 |
|
DES |
-6.5350 |
0.0000 |
|
DFCE |
-10.5160 |
0.0000 |
|
DFDI |
-6.2790 |
0.0000 |
|
DINF |
-7.6770 |
0.0000 |
|
DGDPG |
-10.6040 |
0.0000 |
|
DCRE |
-4.8850 |
0.0000 |
Given the study's objective to assess both short-run and long-run relationships between economic indicators and sustainability, we adopt the ARDL Bounds Testing approach. This method is suitable for dynamic modeling, allowing for heterogeneity in lag structure and variable integration order (I(0) or I(1)) across countries.
The ARDL model specification ARDL was selected using the Auselect command in Stata, which applies an automated model selection procedure based on the Akaike Information Criterion (AIC). This approach identifies the optimal lag structure by minimizing information loss, providing a data-driven basis for lag selection. While the AIC guided the initial specification, the selected lags also align with theoretical expectations regarding the dynamic response of ANS to changes in key macroeconomic variables such as FCE and GDP growth. To ensure the robustness of this model, alternative lag structures were tested (e.g., varying maximum lags to 2 and 4), and the results remained consistent in terms of both the direction and significance of the key coefficients, supporting the stability of the ARDL(1,3,2,0,0,0) specification.
The ARDL model estimates are presented in Table 6.
The model explains approximately 75% of the variation in ES, with an adjusted R-squared of 64%, indicating a reasonably good fit. The lagged dependent variable (L1.ES) has a significant negative coefficient, suggesting that past values of ANS negatively impact current values, which may indicate a reversion toward equilibrium over time. FCE has a significant negative impact on ES across different lags, suggesting that higher consumption expenditure reduces sustainable savings. FDI shows a delayed positive effect at the second lag, indicating that FDI inflows contribute to savings, but their impact takes time to materialize. Inflation (INF), however, appears statistically insignificant in this specification. This may suggest that the effect of inflation on sustainable savings is either nonlinear, indirect, or requires longer lags to be captured effectively. To address this, alternate lag structures were tested, yet inflation consistently remained insignificant, possibly reflecting structural factors or offsetting effects in the South Asian economies. GDP growth (GDPG) has a significant positive effect, indicating that higher economic growth enhances sustainability in savings. CRE also has a strong and positive impact, highlighting the role of financial development in supporting long-term savings. The model's F-statistic is significant, confirming the joint explanatory power of the independent variables. Overall, the results suggest that economic growth, financial sector development, and delayed FDI inflows positively influence sustainable savings, while higher consumption expenditure negatively affects it.
Table 6. ARDL regression results
|
Variable |
Coefficient |
Std. Err. |
T-value |
P-value |
[95% Conf. Interval] |
||
|
L1.DES |
-0.3196 |
0.1367 |
-2.3400 |
0.0280 |
(-0.6010 to -0.0381) |
||
|
FCE |
-0.0256 |
0.0075 |
-3.4100 |
0.0020 |
(-0.0411 to -0.0101) |
||
|
L1.FCE |
-0.0089 |
0.0035 |
-2.5200 |
0.0180 |
(-0.0162 to -0.0016) |
||
|
L2.FCE |
-0.0005 |
0.0052 |
-0.0900 |
0.9310 |
(-0.0112 to 0.0102) |
||
|
L3.FCE |
-0.0180 |
0.0052 |
-3.4300 |
0.0020 |
(-0.0287 to -0.0072) |
||
|
DFDI |
-0.0065 |
0.0230 |
-0.2800 |
0.7800 |
(-0.0540 to 0.0410) |
||
|
L1.DFDI |
0.0009 |
0.0198 |
0.0400 |
0.9650 |
(-0.0400 to 0.0417) |
||
|
L2.DFDI |
0.0577 |
0.0191 |
3.0200 |
0.0060 |
(0.01828 to 0.0970) |
||
|
DINF |
0.0101 |
0.0274 |
0.3700 |
0.7160 |
(-0.0463 to 0.0665) |
||
|
GDPG |
0.0298 |
0.0075 |
3.9800 |
0.0010 |
(0.0144 to 0.0453) |
||
|
DCRE |
0.4994 |
0.1788 |
2.7900 |
0.0100 |
(0.1311 to 0.8677) |
||
|
_cons |
0.1107 |
0.0473 |
2.3400 |
0.0280 |
(0.0132 to 0.2081) |
||
|
Model Characteristics |
|||||||
|
R-squared |
0.7512 |
F-statistic |
6.8600 |
||||
|
Adj. R-squared |
0.6417 |
P-value |
0.0000 |
||||
The diagnostic tests conducted on the ARDL model indicate that the regression results are robust and free from major econometric issues (Table 7). The Breusch-Godfrey test for serial correlation shows a high p-value, failing to reject the null hypothesis of no autocorrelation, suggesting that the residuals do not suffer from serial correlation. Similarly, the heteroscedasticity tests, including White’s test and the Breusch-Pagan test, return high p-values, indicating that the residuals are homoscedastic, meaning the variance of the errors is constant.
To ensure the validity of inference in the ARDL estimation, we conducted both statistical and visual tests to evaluate the normality of residuals. The Shapiro-Wilk test indicated no significant departure from normality (p-value > 0.05), supporting the assumption of normally distributed residuals. In addition, Figure 2 presents a histogram of standardized residuals overlaid with a normal curve, showing approximate symmetry and bell shape. Complementarily, the Q-Q plot illustrates that the residuals lie close to the 45-degree line, indicating alignment with a normal distribution. These results jointly support the adequacy of the normality assumption in the estimated ARDL model.
These results suggest that the model satisfies key assumptions of classical linear regression, enhancing the reliability of the estimated coefficients and inferences drawn from the analysis.
Table 7. Diagnostic test results
|
Test |
Statistic |
P-value |
|
Autocorrelation Test (Breusch-Godfrey LM Test) |
0.0100 |
0.9221 |
|
Heteroscedasticity Tests |
||
|
White's Test |
37.0000 |
0.4226 |
|
Breusch-Pagan / Cook-Weisberg Test |
1.9600 |
0.1610 |
|
Normality Test (Shapiro-Wilk Test) |
0.9636 |
0.2346 |
The Bounds Test for a long-run relationship in the ARDL model (Table 8) yields a high F-statistic with a significant p-value, strongly suggesting the presence of a long-run cointegration relationship among the variables. Since the p-value is effectively zero, the null hypothesis of no long-run relationship is rejected at all conventional significance levels. This implies that adjusted net savings (ES) and its explanatory variables move together in the long run, reinforcing the validity of using an ARDL framework for this analysis. The presence of cointegration suggests that despite short-term fluctuations, the independent variables collectively influence the dependent variable over time.
Figure 2. Residual normality assessment
Table 8. Bounds test for long-run relationship
|
|
F-statistic |
P-value |
|
Bound tests |
10.5200 |
0.0000 |
The results of the ECM provide valuable insights into the dynamics of adjusted net savings (ES) in South Asia, highlighting both short-run and long-run relationships with the explanatory variables (Table 9).
The ECM coefficient of -1.2882 is negative and highly significant, confirming the existence of a stable long-run equilibrium relationship among the variables. Its magnitude, greater than one, suggests a rapid and more-than-complete adjustment process: approximately 129% of any short-term deviation from equilibrium in ANS is corrected within a single period. This indicates a strong self-correcting mechanism in the system, where deviations from the long-run path are not only swiftly addressed but may temporarily overshoot before stabilizing. Such behavior reflects the responsiveness of ANS to imbalances in the economic environment.
In the short run, FCE exhibits a significant negative effect on ANS, implying that an increase in consumption expenditure leads to a reduction in savings. This result points to the possibility that higher consumption may come at the expense of savings in the region. Conversely, GDP growth (GDPG) has a significant positive impact on ANS, indicating that economic growth enhances savings levels. Meanwhile, FDI and inflation (INF) do not show statistically significant effects in the short run, suggesting that these factors may not be critical in influencing immediate changes in savings. Additionally, the coefficient for CRE is positive but not statistically significant, indicating that the expansion of credit does not have a strong influence on short-run variations in net savings.
Overall, the model fit is strong, as evidenced by a high R-squared value, which indicates that the ECM explains a substantial portion of the short-run variation in ANS. The F-statistic is also highly significant, confirming the joint explanatory power of the independent variables included in the model. In conclusion, the results affirm the existence of a long-run relationship between ANS and its determinants, with quick corrections for short-run deviations. While FCE negatively impacts savings, GDP growth plays a positive role, highlighting the complexities of savings behavior in the context of South Asia. However, the limited significance of FDI, inflation, and domestic credit in the short run suggests areas for further investigation and policy consideration.
The CUSUM test is used to detect structural breaks or instability in the coefficients of a regression model over time. While the CUSUM Squared test is a variant of the CUSUM test that focuses on detecting changes in the variance of the residuals over time (Figure 3).
The figure indicates that the CUSUM line remains within the critical bounds, suggesting that the model is stable. Additionally, the CUSUM Squared line also stays within the bounds, indicating that the variance of the residuals is stable.
Table 9. ECM estimation results
|
Variable |
Coefficient |
Std. Err. |
t-value |
P-value |
[95% Conf. Interval] |
||
|
ECM_LAG |
-1.2882 |
0.1633 |
-7.8900 |
0.0000 |
(-1.6204; -0.9561) |
||
|
D1.FCE |
-0.0360 |
0.0057 |
-6.2800 |
0.0000 |
(-0.0477; -0.0244) |
||
|
D1.DFDI |
0.0044 |
0.0170 |
0.2600 |
0.7990 |
(-0.0303; 0.0390) |
||
|
D1.DINF |
0.0078 |
0.0189 |
0.4100 |
0.6810 |
(-0.0306; 0.04635) |
||
|
D1.GDPG |
0.0440 |
0.0060 |
7.3800 |
0.0000 |
(0.0319; 0.0561) |
||
|
D1.DCRE |
0.1789 |
0.1585 |
1.1300 |
0.2670 |
(-0.1437; 0.5014) |
||
|
_cons |
-0.0023 |
0.0074 |
-0.3000 |
0.7630 |
(-0.0173; 0.0128) |
||
|
Model Characteristics |
|||||||
|
R-squared |
0.7820 |
F-statistic |
19.7300 |
||||
|
Adj. R-squared |
0.7423 |
P-value |
0.0000 |
||||
Figure 3. CUSUM test and CUSUM Squared test results
Our analysis of the relationship between economic indicators and sustainability in South Asia provides valuable insights.
6.1 FCE
The results indicate a significant negative effect of FCE on ES, suggesting that increased consumption reduces sustainable savings. This finding aligns with Din et al. [47], who found that higher household consumption per capita negatively impacts sustainable development, as measured by ANS. Similarly, a study by Rivera et al. [48], analyzing the relationship between FCE and gross savings in the Philippines, revealed that increased consumption expenditure is associated with reduced savings rates, highlighting the trade-off between immediate consumption and long-term savings. These findings emphasize that high consumption can lead to lower national savings, reducing the economy's ability to invest in future growth.
6.2 FDI
The delayed positive impact of FDI on ES implies that FDI inflows enhance savings over time. This is consistent with study [49], who observed a positive and significant relationship between FDI and GDP growth in SAARC countries, indicating that FDI contributes to economic growth, which in turn can bolster national savings. Additionally, a comprehensive literature review of 100 empirical studies on FDI inflows worldwide suggests that FDI often leads to technology transfer, improved managerial skills, and increased employment opportunities, all of which enhance a country's savings and investment rates over time [50].
6.3 INF
The study finds that inflation is statistically insignificant in influencing ES in the short run. This is consistent with study [51], who reported a significant negative effect of inflation on sustainable development in Asian countries, suggesting that while inflation can erode purchasing power, its immediate impact on ANS may be limited. Furthermore, a study examining household savings behavior in the context of negative interest rates found that while inflation affects purchasing power, its direct impact on household savings rates is not always significant, as households may adjust their consumption and savings behavior in response to anticipated inflation [52].
6.4 GDPG
The positive effect of GDP growth on ES indicates that economic expansion enhances sustainable savings. This is corroborated by study [53], which found a positive relationship between economic growth and savings in South Asian economies, emphasizing that growth stimulates income levels, thereby increasing the capacity to save. Similarly, Ribaj and Mexhuani's [54] study analyzing the correlation between final consumption, gross available income, and gross investment in Kosovo supports the Keynesian perspective that higher income levels, driven by economic growth, lead to increased savings and investment. This suggests that economic growth is essential for sustainability, as it provides the necessary resources for investment and future development [55].
6.5 CRE
The analysis suggests a positive but not statistically significant impact of CRE on ES in the short run. This finding aligns with [51], who found a significant positive effect of financial development on sustainable development, indicating that an accessible credit market can enhance investment in human and physical capital, thereby promoting sustainability. Additionally, the study of Kida [56] on the dynamic relationship between government spending, final consumption, and savings in Southeast Europe found that while financial development facilitates access to credit, its immediate impact on savings rates may not be significant, as the benefits of increased credit availability may take time to materialize.
6.6 ECM
The significant negative coefficient of the ECM term indicates a strong tendency for ANS to revert to long-run equilibrium after short-run deviations. This finding is consistent with the notion that economies adjust to maintain sustainability over time, as discussed in the literature on genuine savings and sustainable development [2]. Furthermore, Felici et al. [57] study on the dynamic relationship between government spending, final consumption, and savings in Southeast Europe supports the idea that economies have mechanisms to correct short-term deviations, ensuring a return to long-term equilibrium in savings behavior.
In summary, these findings align with existing empirical studies, emphasizing the complex interplay between consumption, investment, economic growth, and financial development in influencing sustainable savings in South Asia. While economic growth and FDI play a crucial role in enhancing sustainability, excessive consumption expenditure reduces long-term savings. The results provide valuable insights for policymakers aiming to balance short-term economic activities with long-term sustainability goals, ensuring resilient economic development in the region.
This study examines the determinants of ANS in South Asia from 1985 to 2023, focusing on the impact of FCE, FDI, inflation, GDP growth, and CRE. Given the increasing importance of sustainable economic policies, understanding how these macroeconomic and financial factors influence ANS provides valuable insights for policymakers seeking to balance economic growth with long-term sustainability.
The findings highlight that FCE significantly reduces ANS, suggesting that excessive consumption in South Asian economies may come at the expense of long-term wealth accumulation. In contrast, economic growth positively contributes to ANS, indicating that sustained GDP expansion fosters greater savings and investment capacity. FDI shows a delayed positive effect, suggesting that while initial capital inflows may not immediately enhance savings, they contribute to long-term economic sustainability. Inflation, however, appears statistically insignificant, implying that short-term fluctuations in price levels do not play a major role in determining sustainable savings. Meanwhile, CRE exhibits a positive but inconsistent impact, suggesting that financial development supports long-term savings but requires well-regulated credit expansion to avoid unsustainable debt burdens.
The ECM results confirm the existence of a long-run equilibrium relationship among these variables, with the negative and significant ECM coefficient indicating that deviations from this equilibrium are corrected over time. This underscores the importance of stable macroeconomic policies in ensuring that South Asian economies maintain sustainable savings levels despite short-term economic fluctuations.
From a policy perspective, governments in South Asia should focus on fostering economic growth while encouraging more sustainable and responsible consumption patterns. The negative relationship between consumption expenditure and ANS suggests a need for targeted fiscal policies, such as reducing subsidies on non-essential consumption, promoting savings schemes, and offering tax incentives for long-term investment in sustainable sectors. Financial literacy programs may also help shift public behavior toward saving overspending. Given the delayed positive impact of FDI, accelerating the transformation of foreign investment into productive capital stock is critical. This could be achieved by improving absorptive capacity through better infrastructure, skills development, and transparent regulatory frameworks that reduce inefficiencies and ensure that FDI is directed toward high-impact, long-term projects. The findings also highlight the importance of financial sector development, underscoring the need to expand access to credit, strengthen banking supervision, and encourage digital financial services to better mobilize domestic resources.
Although inflation does not exhibit a direct short-term impact on ANS in the model, maintaining macroeconomic stability remains essential for safeguarding investor confidence and promoting sustainable financial environments.
Limitations of this study should be acknowledged. First, the analysis is constrained by the availability and consistency of data across the South Asian region from 1985 to 2023, which may obscure short-term fluctuations or country-specific dynamics. Second, the ARDL model assumes linear relationships and stable long-run equilibria, which may not fully capture nonlinear effects or structural breaks, especially in economies facing political or financial instability. Third, omitted variable bias may be present, as the model does not explicitly control for institutional quality, environmental regulation, or technological innovation—factors that could meaningfully influence savings behavior.
Future research can build on this work by incorporating these broader dimensions and exploring potential threshold effects, regime changes, or structural nonlinearities. Additionally, country-specific analyses could offer more tailored policy insights, given the region’s significant heterogeneity in institutional capacity and economic structure. Overall, this study contributes to the growing literature on sustainable development by emphasizing the need for integrated strategies that align growth, investment, and responsible financial governance to achieve long-term prosperity.
|
Symbol |
Description |
|
Abbreviations |
|
|
ES |
Adjusted Net Savings, excluding particulate emission damage (% of GNI) |
|
FCE |
Final Consumption Expenditure (annual % growth) |
|
FDI |
Foreign Direct Investment, net inflows (% of GDP) |
|
INF |
Inflation, consumer prices (annual %) |
|
GDPG |
GDP Growth (annual %) |
|
CRE |
Domestic Credit to Private Sector (% of GDP) |
|
DES |
First difference of the natural logarithm of Adjusted Net Savings |
|
DFCE |
First difference of Final Consumption Expenditure |
|
DFDI |
First difference of the natural logarithm of Foreign Direct Investment |
|
DINF |
First difference of Inflation |
|
DGDPG |
First difference of GDP Growth |
|
DCRE |
First difference of the natural logarithm of Domestic Credit to the Private Sector |
|
Greek symbols |
|
|
$\alpha$ |
Intercept in the ARDL model specification |
|
$\beta_{\mathrm{i}}$ |
Short-run coefficients for the dependent variable in the ARDL model |
|
$\gamma_i$ |
Short-run coefficients for the independent variables in the ARDL model |
|
$\theta_{\mathrm{i}}$ |
Long-run coefficients in the ECM model specification |
|
$\lambda$ |
Error correction term (ECT) in the ECM model specification |
|
Subscripts |
|
|
t |
Time period (for each observation or period in the dataset) |
|
i |
Index for the lag length of the dependent variable in the ARDL model |
|
j |
Index for the lag length of the independent variable(s) in the ARDL model |
|
p |
Lag length for the dependent variable in the ARDL model |
|
q |
Lag length for the independent variable(s) in the ARDL model |
|
0 |
Represents the intercept or the long-run value for a variable |
|
k |
Number of explanatory variables in the ARDL model for testing the bounds |
|
L1 |
First lag of a variable (e.g., L1.DES refers to the first lag of the natural logarithm of Adjusted Net Savings) |
[1] Cook, D., Davíðsdóttir, B. (2021). An appraisal of interlinkages between macro-economic indicators of economic well-being and the sustainable development goals. Ecological Economics, 184: 106996. https://doi.org/10.1016/j.ecolecon.2021.106996
[2] Hamilton, K., Clemens, M. (1999). Genuine savings as an indicator of sustainability. World Bank Economic Review, 13(2): 333-356. https://doi.org/10.1093/wber/13.2.333
[3] Ferreira, S., Hamilton, K., Vincent, J.R. (2008). Comprehensive wealth and future consumption: Accounting for population growth. The World Bank Economic Review, 22(2): 233-248. https://doi.org/10.1093/wber/lhn008
[4] Ahmad, M., Kuldasheva, Z., Ismailova, N., Balbaa, M.E., Akramova, N., Ain, N.U. (2024). Effect of the supply-side factors on inflation in South Asia: An analysis of oil price, technology, and labor market dynamics. Research in Globalization, 8: 100210. https://www.sciencedirect.com/science/article/pii/S2590051X24000194.
[5] Borensztein, E., De Gregorio, J., Lee, J.W. (1998). How does foreign direct investment affect economic growth? Journal of International Economics, 45(1): 115-135. https://doi.org/10.1016/S0022-1996(97)00033-0
[6] Alfaro, L., Chanda, A., Kalemli-Ozcan, S., Sayek, S. (2004). FDI and economic growth: The role of local financial markets. Journal of International Economics, 64(1): 89-112. https://doi.org/10.1016/S0022-1996(03)00081-3
[7] Ali, A., Khokhar, B., Sulehri, F.A. (2023). Financial dimensions of inflationary pressure in developing countries: An in-depth analysis of policy mix. Journal of Asian Development Studies, 12(3): 1313-1327. https://poverty.com.pk/index.php/Journal/article/view/205.
[8] Aghion, P., Comin, D., Howitt, P., Tecu, I. (2016). When does domestic savings matter for economic growth? IMF Economic Review, 64(3): 381-407. https://doi.org/10.1057/imfer.2015.41
[9] Ribaj, A. Mexhuani, F. (2021). The impact of savings on economic growth in a developing country (The case of Kosovo). Journal of Innovation and Entrepreneurship, 10: 1. https://doi.org/10.1186/s13731-020-00140-6
[10] Arcand, J.L., Berkes, E., Panizza, U. (2015). Too much finance? Journal of Economic Growth, 20(2): 105-148. https://doi.org/10.1007/s10887-015-9115-2
[11] Bergheim, S. (2008). Long-Run Growth Forecasting. Springer. https://doi.org/10.1007/978-3-540-77680-2
[12] Modigliani, F., Brumberg, R. (1954). Utility analysis and the consumption function: An interpretation of cross-section data. In Post-Keynesian Economics. Rutgers University Press, pp. 388-436.
[13] Abeywickrama, K., Perera, N., Samarathunga, S., Pabasara, H., Jayathilaka, R., Wisenthige, K. (2024). Factors influencing IMF assistance in the Sub-Saharan African region. PLoS ONE, 19(7): e0307071. https://doi.org/10.1371/journal.pone.0307071
[14] Iqbal, M., Rehman, H.U., Arshed, N., Sardar, M.S. (2021). The macroeconomic and demographic determinants of saving behavior in selected countries of Asia. Journal of Global Policy and Governance, 10(1): 49-65. https://doi.org/10.14666/2194-7759-10-1-004
[15] Jamsheed, R.A. (2024). FDI, foreign debt, and economic growth: The South Asian perspective (1980–2020). Journal of World Economy: Transformations & Transitions, 3(7): 27. https://doi.org/10.52459/jowett37270124
[16] Abid, I. (2025). Economic, technological, and institutional factors affecting international tourism in MENA countries. International Journal of Innovative Research and Scientific Studies, 8(2): 3548-3560. https://doi.org/10.53894/ijirss.v8i2.6054
[17] Romer, P.M. (1990). Endogenous technological change. Journal of Political Economy, 98(5): S71-S102. https://doi.org/10.1086/261725
[18] Sandrone, B. (2024). Foreign Direct Investment in Turkey: A Regional-Level Analysis. Politecnico di Torino.
[19] Huang, C., Wang, C., Rani, T., Rehman, S.A.U. (2024). Digitalization’s role in shaping climate change, renewable energy, and technological innovation for achieving sustainable development in top Asian countries. Energy & Environment. https://doi.org/10.1177/0958305X241258799
[20] Ha Van, T., Lichang, L., Dang Thanh Quoc, T. (2024). Sustainable development in Southeast Asia: The nexus of tourism, finance, and environment. Heliyon, 10(24): e40829. https://doi.org/10.1016/j.heliyon.2024.e40829
[21] Abid, I., Ben Salem, S., Frikha, W. (2024). Impact of political instability on monetary policy conduct and economic activity recovery: Empirical investigation. SN Business & Economics, 4: 154. https://doi.org/10.1007/s43546-024-00750-2
[22] Fisher, I. (1930). The Theory of Interest. Macmillan.
[23] Mishra, A., Sahu, P.K. (2024). Do geopolitical uncertainty and inflation transmit opportunities or threats to green energy consumption? International Journal of Energy Sector Management. https://doi.org/10.1108/IJESM-08-2024-0006
[24] Jacho, D., Cruz, Z., Carrillo-Maldonado, P. (2024). Effect of terms of trade on the Latin American Labor market. International Economics, 180: 100552. https://doi.org/10.1016/j.inteco.2024.100552
[25] Amin, A.A., Tawah, R.N., Ntembe, A. (2022). Introduction and background: A historical perspective of the role of financial institutions in Africa’s development. In Monetary and Financial Systems in Africa: Integration and Economic Performance. Springer, pp. 3-39. https://doi.org/10.1007/978-3-030-96225-8_1
[26] Solow, R.M. (1956). A contribution to the theory of economic growth. Quarterly Journal of Economics, 70(1): 65-94. https://doi.org/10.2307/1884513
[27] Aghion, P., Howitt, P., Murtin, F. (2009). The relationship between health and growth: When Lucas meets Nelson-Phelps. NBER Working Paper No. 15813. https://www.nber.org/papers/w15813.
[28] Rahman, P., Zhang, Z., Musa, M. (2023). Do technological innovation, foreign investment, trade, and human capital have a symmetric effect on economic growth? Novel dynamic ARDL simulation study on Bangladesh. Economic Change and Restructuring, 56(3): 123-145. https://doi.org/10.1007/s10644-022-09478-1
[29] Huo, J., Peng, C. (2023). Depletion of natural resources and environmental quality: Prospects of energy use, energy imports, and economic growth hindrances. Resources Policy, 86: 104049. https://doi.org/10.1016/j.resourpol.2023.104049
[30] Abid, I., Hechmi, S., Chaabouni, I. (2024). Impact of energy intensity and CO2 emissions on economic growth in Gulf Cooperation Council countries. Sustainability, 16(23): 10266. https://doi.org/10.3390/su162310266
[31] Chaabouni, I., Abid, I. (2025). Key drivers of energy consumption in the Gulf Cooperation Council countries: A panel analysis. Engineering, Technology & Applied Science Research, 15(2): 21627–21632. https://doi.org/10.48084/etasr.10233
[32] McKinnon, R.I. (1973). Money and Capital in Economic Development. Brookings Institution Press.
[33] Banik, B. (2023). Unlocking the path to inclusive growth: Examining the impact of financial inclusion in developing economies. International Journal of Science and Business, 26(1): 233-247. https://doi.org/10.58970/ijsb.2179
[34] Tandan, L., Ananta, Khanal, K. (2022). An econometric analysis on interest rate reforms and financial deepening. International Journal of Finance, Insurance and Risk Management, 12(3): 3-22. https://doi.org/10.35808/ijfirm/321
[35] Rogoff, K.S., Rossi, B., Schmelzing, P. (2024). Long-run trends in long-maturity real rates, 1311–2022. American Economic Review, 114(8): 2271-2307. https://doi.org/10.1257/aer.20221352
[36] Abid, I. (2025). The role of economic and environmental variables in green growth: Evidence from Saudi Arabia. Engineering, Technology & Applied Science Research, 15(1): 20433-20439. https://doi.org/10.48084/etasr.9836
[37] Pesaran, M.H., Shin, Y., Smith, R.J. (2001). Bounds testing approaches to the analysis of level relationships. Journal of Applied Econometrics, 16(3): 289-326. https://doi.org/10.1002/jae.616
[38] Kripfganz, S., Schneider, D.C. (2018). ARDL: Stata module to estimate autoregressive distributed lag models. Statistical Software Components S458944, Boston College Department of Economics. https://ideas.repec.org/c/boc/bocode/s458944.html.
[39] Akaike, H. (1973). Information theory and an extension of the maximum likelihood principle. In Proceedings of the 2nd International Symposium on Information Theory, pp. 267-281.
[40] Schwarz, G. (1978). Estimating the dimension of a model. Annals of Statistics, 6(2): 461-464. https://doi.org/10.1214/aos/1176344136
[41] Breusch, T.S. (1978). Testing for autocorrelation in dynamic linear models. Australian Economic Papers, 17(31): 334-355. https://doi.org/10.1111/j.1467-8454.1978.tb00635.x
[42] Godfrey, L.G. (1978). Testing for higher order serial correlation in regression equations. Econometrica, 46(6): 1303-1310. https://doi.org/10.2307/1913830
[43] White, H. (1980). A heteroskedasticity-consistent covariance matrix estimator and a direct test for heteroskedasticity. Econometrica, 48(4): 817-838. https://doi.org/10.2307/1912934
[44] Breusch, T.S., Pagan, A.R. (1979). A simple test for heteroscedasticity and random coefficient variation. Econometrica, 47(5): 1287-1294. https://doi.org/10.2307/1911963
[45] Shapiro, S.S., Wilk, M.B. (1965). An analysis of variance test for normality (complete samples). Biometrika, 52(3/4): 591–611. https://doi.org/10.2307/2333709
[46] Brown, R.L., Durbin, J., Evans, J.M. (1975). Techniques for testing the constancy of regression relationships over time. Journal of the Royal Statistical Society: Series B (Methodological), 37(2): 149-192. https://doi.org/10.1111/j.2517-6161.1975.tb01532.x
[47] Din, S.U., Khan, M.Y., Khan, M.J., Nilofar, M. (2021). Nexus between sustainable development, adjusted net saving, economic growth, and financial development in South Asian emerging economies. Journal of the Knowledge Economy, 12(4): 1-14. https://doi.org/10.1007/s13132-021-00818-6
[48] Rivera, J.P., Ruiz, M.G., Miral, R.M. (2024). Macroeconomic prospects of the Philippines in 2024–2025: Toward upper middle-income status. Philippine Institute for Development Studies. https://doi.org/10.62986/dp2024.18
[49] Abbas, Q., Akbar, S., Nasir, A.S., Ullah, H., Muhammad, Naseem, A. (2011). Impact of foreign direct investment on gross domestic product (A case of SAARC countries). Global Journal of Management and Business Research, 11(8): 1-10.
[50] Ali, S., Malik, F. (2017). A review of 100 empirical studies on FDI inflows. MPRA Paper No. 71414. https://mpra.ub.uni-muenchen.de/71414/.
[51] Koirala, B., Pradhan, G. (2019). Determinants of sustainable development: Evidence from 12 Asian countries. Sustainable Development, 28(3): 456-470. https://doi.org/10.1002/sd.1963
[52] Olusola, B.E., Chimezie, M.E., Shuuya, S.M., Addeh, G.Y.A. (2022). The impact of inflation rate on private consumption expenditure and economic growth—Evidence from Ghana. Open Journal of Business and Management, 10(4): 1601-1646. https://doi.org/10.4236/ojbm.2022.104084
[53] Arif, A., Sadiq, M., Shabbir, M.S., Yahya, G., Zamir, A., Bares Lopez, L. (2020). The role of globalization in financial development, trade openness and sustainable environmental-economic growth: Evidence from selected South Asian economies. Journal of Sustainable Finance & Investment, 12(4): 1027-1044. https://doi.org/10.1080/20430795.2020.1861865
[54] Ribaj, A., Mexhuani, F. (2021). The impact of savings on economic growth in a developing country (The case of Kosovo). Journal of Innovation and Entrepreneurship, 10(1): 1-15. https://doi.org/10.1186/s13731-020-00140-6
[55] Zhang, H., Shao, Y., Han, X., Chang, H.L. (2022). A road towards ecological development in China: The nexus between green investment, natural resources, green technology innovation, and economic growth. Resources Policy, 77: 102746. https://doi.org/10.1016/j.resourpol.2022.102746
[56] Kida, N. (2020). Dynamic relationship between government spending, final consumption and savings: Evidence from southeast Europe. International Journal of Economics and Business Administration, VIII(3): 374-392. https://doi.org/10.35808/ijeba/523
[57] Felici, M., Kenny, G., Friz, R. (2023). Consumer savings behaviour at low and negative interest rates. European Economic Review.