Ghaith J. Althabhawi* | Ahmed S. Al-Khafaji![]()
© 2025 The authors. This article is published by IIETA and is licensed under the CC BY 4.0 license (http://creativecommons.org/licenses/by/4.0/).
OPEN ACCESS
This study examines the role of accessibility in fostering sustainable revitalization of historic city centers, using Al-Kifl’s historic core in Iraq as a case study. The research aims to assess how accessibility indicators traditional and sustainable transport modes, functional proximity, and infrastructure inclusivity contribute to urban sustainability and heritage integration. Employing a descriptive-analytical methodology, the study combines field surveys, GIS-based spatial analyses, and statistical models to evaluate mobility efficiency and infrastructure gaps. Findings reveal significant deficiencies: poor pedestrian and cycling infrastructure, limited public transport coverage, high dependency on private vehicles, and inadequate facilities for individuals with disabilities. These challenges compromise urban connectivity, reduce socio-economic vitality, and threaten the preservation of cultural identity. Conversely, enhanced accessibility correlates with increased public engagement, economic activity, and spatial coherence. The study concludes that accessibility is a foundational component in sustainable urban revitalization and must be central to policy and planning frameworks. It recommends expanding multimodal transport systems, establishing integrated pedestrian and cycling networks, and implementing inclusive infrastructure aligned with universal design standards. These measures are vital for reinforcing urban resilience, ensuring heritage continuity, and promoting equitable urban environments. The study provides a transferable framework for revitalizing historical centers through accessibility-driven interventions.
sustainable revitalization, accessibility, urban sustainability, historic areas, Al-Kifl City
Sustainable revitalization of historical city centers constitutes an effective and viable policy for preserving urban character and enhancing the quality of life within urban environments. It is a dynamic process aiming to integrate the existing urban fabric with contemporary demands, thereby ensuring long-term sustainability. The significance of this approach arises from the necessity to handle historical urban centers with meticulous care, maximizing their physical and cultural resources to support societal objectives and maintain their vitality. Revitalization extends beyond merely preserving historical landmarks; it also encompasses the activation of these areas by adapting them to evolving social, economic, and environmental needs, providing substantial flexibility to boost urban effectiveness and achieve sustainable development [1].
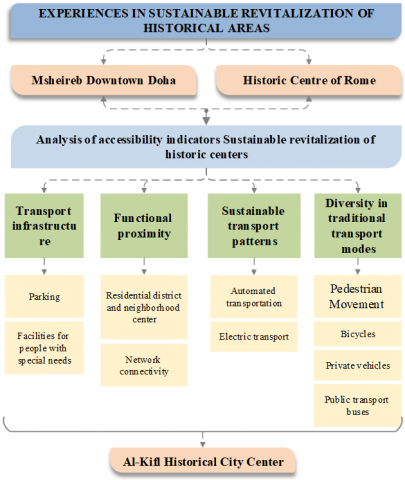
The significance of this research lies in highlighting the central role of accessibility within the sustainable revitalization of historical urban centers. Accessibility contributes substantially to promoting residential, commercial, and cultural activities, thus enhancing the economic and social attractiveness of these areas. Moreover, improving accessibility fosters greater efficiency in the utilization of urban spaces. Additionally, the development of integrated transportation systems and enhancement of infrastructure reinforce community connections by providing comprehensive urban environments that fulfill living requirements and facilitate social interaction. Consequently, these improvements ensure the continuous vitality of historical centers as attractive urban hubs, preserving their historical and cultural values for future generations.
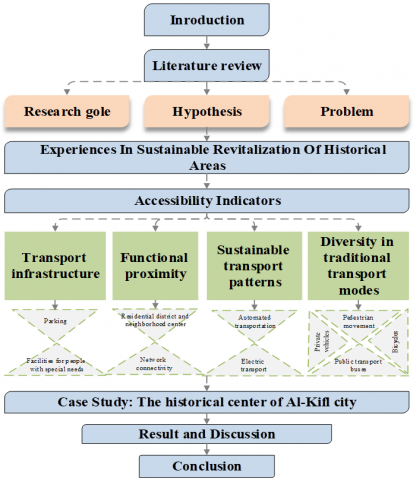
This research addresses the sustainable revitalization of historical urban centers by emphasizing the role of accessibility as a fundamental factor in enhancing their sustainability and urban attractiveness. The study is divided into two primary sections: the first section provides a theoretical framework regarding the concept of revitalization, with a particular focus on accessibility as a key determinant in activating life within historical centers. The second section applies accessibility indicators to the selected case study, the historical center of Al-Kifl City, aiming to analyze the impact of accessibility on the area's sustainability and its potential for enhanced urban utilization. Furthermore, the study offers several proposals designed to improve the integration of historical centers with local communities, considering the preservation of their existing structures and surrounding urban fabric.
Numerous studies have emphasized the importance of accessibility in revitalizing historical urban centers. Huang et al. [2] discuss the challenges and strategies associated with enhancing accessibility in historical urban cores, particularly stressing the balance between accessibility improvements and preservation of historical character. Similarly, Ruiz-Rodrigo et al. [3] explore the experiences of individuals with visible and invisible disabilities visiting heritage and historical sites, identifying environmental barriers hindering participation, and emphasizing the need for inclusive design solutions that enhance accessibility while respecting historical significance.
Moreover, Çelimli and Oral [4] highlight that improving accessibility to historic buildings and areas does not merely cater to the needs of people with disabilities but also strengthens urban identity through adaptive solutions that respect the unique architectural language of historical centers. The study indicates that physical modifications, such as ramps and non-slip flooring, facilitate greater public participation in cultural activities without compromising aesthetic values.
An OECD report (2021) emphasizes that achieving net-zero transport systems requires reconfiguring urban infrastructure to prioritize accessibility and reduce private vehicle dependence. Key strategies include reallocating public space to pedestrians and cyclists, expanding public transport, and integrating active and shared mobility modes. These measures not only mitigate emissions but also enhance functional accessibility making urban centers more resilient, inclusive, and suitable for sustainable revitalization, especially in historic districts [5].
In a related context, Şahin Körmeçli [6] discusses accessibility's role in boosting urban tourism in historical city centers, noting that adopting innovative sustainable urban planning strategies preserves cultural heritage and revitalizes historical urban cores. The study highlights how highly connected streets significantly shape traditional architecture and guide tourist routes within historical centers, emphasizing that sustainable street design and infrastructure enhance accessibility, thereby revitalizing historical urban centers and preserving their identity.
Recent studies highlight accessibility as essential for the sustainable revitalization of historical urban centers, promoting urban connectivity, transportation infrastructure, and economic and social activities while preserving heritage identity [7]. Nonetheless, additional research is necessary to explore how accessibility influences sustainable urban revitalization, community interaction, and urban vitality. This study specifically investigates accessibility indicators and their role in activating urban functions, posing the following research questions: What indicators reflect accessibility's impact on revitalizing sustainable historical centers? And to what extent does successful revitalization depend on accessibility and improved urban connectivity? Identifying these indicators is vital for comprehending the dynamics of historical urban revitalization, enhancing urban qualities, and stimulating socioeconomic activities.
Although prior studies have explored accessibility in historic urban centers, few have offered an integrated framework that systematically measures its impact on sustainable revitalization particularly in developing contexts. There remains a lack of empirical research linking accessibility indicators to the functional regeneration of complex heritage environments. This study addresses this gap by proposing a comprehensive analytical model, applied to the historic center of Al-Kifl, using GIS and statistical tools to evaluate how accessibility shapes urban sustainability and informs effective planning strategies.
The concept of sustainable revitalization refers to the renewal and transformation of deteriorating urban centers into vibrant and sustainable hubs, emphasizing urban vitality through the enhancement of urban connectivity and transportation infrastructure, and leveraging technology as a tool to strengthen these elements. According to several researchers, sustainable revitalization integrates comprehensive sustainability principles into urban center development, aiming to address urban decay and promote cultural heritage, thereby creating cohesive urban environments bridging the past and present [8, 9]. It is recognized as an urban intervention policy addressing both immediate physical challenges and long-term socio-economic and environmental issues [10]. Furthermore, sustainable revitalization seeks to transform deteriorated centers into dynamic urban hubs by enhancing comprehensive sustainable development through renewing social, cultural, economic, and environmental facilities [11, 12]. Additionally, the concept underscores leveraging advanced technologies to enrich the urban experience, enhance quality of life, and maintain demographic attractiveness by strengthening community interactions and urban identity [13]. Ultimately, sustainable revitalization pursues balanced development that reinforces urban center resilience and long-term sustainability, fostering dynamic, renewed, and adaptable urban areas and enhancing overall urban sustainability [14, 15].
2.1 Sustainability of historic areas
Sustainable development and the revitalization of historical areas represent a fundamental necessity for preserving cultural identity amid urban transformations over time. The concept of sustainable development focuses on ensuring the continuity of cultural identity throughout evolving urban changes. Sustainable development seeks to guarantee that historical areas maintain their cultural identity while adapting to urban transformations. It emphasizes ensuring that historical centers remain integrated within the contemporary urban fabric, preventing their isolation or decline in value, and securing the continuity of their cultural roles within modern urban structures.
Sustainable revitalization of historical urban centers emphasizes accessibility as essential for preserving urban heritage while enhancing contemporary urban attractiveness. Accessibility improvements stimulate residential, commercial, and cultural activities, thereby boosting economic and social engagement and enhancing the efficient use of urban spaces [16].
Urban interventions targeting accessibility in historical areas must carefully respect the original urban fabric, avoiding significant alterations that compromise heritage value, consistent with UNESCO standards (2011). Architectural modifications should harmonize with the historical context, enriching visitor experiences while maintaining the architectural integrity. Such improvements should preserve the area's unique identity by harmonizing traditional character with modern functionality. Interventions should thus support cultural preservation and enhance historical centers as dynamic, multifunctional urban hubs [17].
Ultimately, the purpose of accessibility enhancement transcends mere mobility improvement, aiming to reintegrate historical centers into contemporary urban life and support sustainable development objectives. Research indicates that revitalizing historical urban areas relies significantly on accessibility as a foundational factor influencing social cohesion, economic vitality, and environmental sustainability, thereby preserving cultural identity within evolving urban settings [18].
Based on previous studies addressing sustainable revitalization, it is possible to summarize the key factors involved physical, social, cultural, economic, and environmental dimensions with a particular emphasis on accessibility within historical areas.
3.1 Msheireb Downtown Doha
The comprehensive redevelopment project in Doha exemplifies sustainable urban transformation efforts through strategic policies implemented across city regions. Notably, Msheireb heritage district in central Doha has adopted sustainable revitalization to rejuvenate the city center as a hub for sustainable cultural and architectural development. Covering approximately 31 hectares and housing around 30,000 residents, the district has experienced significant architectural evolution, blending traditional urban character with modern technological designs emphasizing environmental sustainability. Geographically located at (25°17'N) latitude and (51°31'E) longitude, with elevations ranging from 10 to 15 meters above sea level, Msheireb enjoys a strategic position fostering social and economic connectivity within Doha Municipality [19] (see Figure 1). The area faced key challenges, including outdated infrastructure incapable of meeting local needs. Consequently, the project aimed to overcome these challenges by preserving cultural identity, addressing inadequate infrastructure, and achieving sustainable urban development [20].
Figure 1. Location of Msheireb Downtown Doha
The sustainable revitalization policy aimed at enhancing accessibility and mobility within the region, and strengthening connectivity between the region and the broader city through the establishment of a central metro station serving as a hub for the three main metro lines in Doha (the gold, red, and green lines) [21]. Additionally, the policy has enhanced bus services and introduced a tram system within the area as part of sustainable transport infrastructure. Modern technological solutions were integrated into public transport systems, including GPS navigation, digital mapping, and informational screens. These improvements contributed to a 35% increase in public transport usage between 2019 and 2022, reflecting the success of such measures in meeting residents' needs [22-25].
Regarding pedestrian mobility, a comprehensive and secure pedestrian network was designed, creating a comfortable walking environment characterized by green spaces, natural shading elements, and water features. This pedestrian network effectively connects key public facilities within a 5 to 10-minute walking radius. Furthermore, facilities catering to individuals with special needs-such as ramps, elevators, safety elements, pedestrian crossings, and traffic signals-were implemented, contributing to a 35% increase in pedestrian movement compared to other cities in Qatar [23].
Moreover, an interconnected and dedicated cycling network was developed, supplemented by strategically placed secure parking areas across the region. These cycling paths enable easy access to vital public facilities within a 5 to 15-minute cycling range, resulting in a 20% increase in bicycle usage [24].
The policy also promoted electric transportation, including electric buses and cars, to preserve the environment and reduce the carbon footprint, supported by comprehensive charging infrastructure. Data indicated a 25% reduction in carbon emissions due to electric transportation between 2019 and 2022 [25].
Figure 2. (a) Metro tracks in Doha, (b) Tram track, (c) Bus track, (d) Stations and transportation tracks in Msheireb Downtown Doha
Advanced technologies, such as smartphone applications, were employed to facilitate access to public transportation, reservation services, and optimized route planning based on real-time data, raising user satisfaction levels to over 85%. Additionally, the design incorporated side-street parking spaces and a substantial underground parking facility accommodating approximately 10,000 vehicles, utilized for the distribution of goods and services to public facilities. These parking areas are intelligently managed using sensor technology to detect available spaces, regulate entry and exit, and control parking fees. Special parking spaces designated for people with disabilities were also implemented, ensuring comprehensive accessibility and contributing to a 30% reduction in traffic congestion [19] (See Figure 2).
3.2 Historic center of Rome
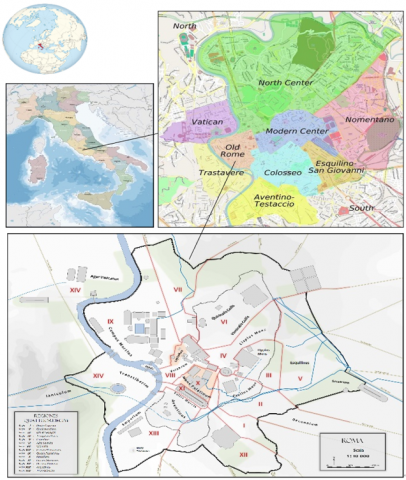
The historic center of Rome is one of the oldest and most prominent cultural centers in the world, representing the heart of ancient Roman civilization and a focal point of the European Renaissance. Covering an area of 14 km², and with a population of approximately 200,000, it reflects deep-rooted cultural and civilizational diversity spanning successive historical periods. The center has experienced significant urban revival, particularly during the Renaissance and Baroque eras, positioning it as a prominent hub for cultural arts and architectural innovation that embodies European creativity [26]. It includes numerous distinguished historical landmarks such as the Colosseum, the Pantheon, and St. Peter's Basilica. Geographically, Rome is located at the intersection of latitude (41°90′ N) and longitude (12°50′ E), at an elevation ranging from 13 to 139 meters above sea level (see Figure 3) [27].
Due to environmental and economic challenges faced by the historic center throughout different historical periods—including environmental pollution, population growth, and uncontrolled urban expansion, which negatively impacted the city's infrastructure and traditional fabric—a sustainable revitalization policy has been adopted. This policy aims to achieve a balance between heritage preservation and urban development [28].
Three primary levels were adopted for the revitalization of Rome’s historic center through enhanced accessibility: the first level, "approach," refers to accessibility from the city to its historic core; the second, "circulation," emphasizes ease of movement within the historic center; and the third, "final access," addresses physical elements to ensure a comfortable experience for all users [29].
At the first level (approach), Rome offers numerous entry points into its historic center facilitated by an integrated public transportation network, including a metro system composed of three lines (A, B, C), which connects directly to the center via two major stations ("Termini" and "Colosseo"), transporting approximately 1.5 million passengers daily. Additionally, buses cover extensive areas within and outside the center, comprising 350 routes, accounting for approximately 40% of total transport movements. Tram services constitute around 10% of public transportation, particularly in areas beyond the metro’s reach. Infrastructure supporting accessibility for individuals with disabilities, such as elevators and ramps, has been provided at selected locations [30].
At the second level (circulation), policies have improved pedestrian orientation through the installation of more than 2,000 pedestrian signs, complemented by digital maps and applications such as "Roma Mobilita," which facilitate the selection of routes with minimal incline. Additionally, efforts have focused on enhancing pedestrian and cycling mobility by transforming several areas into car-free zones, resulting in a 20% reduction in vehicle presence within the historic center [31].
At the third level (final access), substantial efforts have been dedicated to addressing uneven sidewalks, supplemented by rest points and both tactile and visual directional signage guiding visitors between landmarks. Furthermore, ensuring a safe and comfortable pedestrian environment has involved installing surveillance cameras, providing shaded areas through strategically planted trees, incorporating water elements, and clearly separating pedestrian and vehicular traffic flows [32] (see Figure 4).
Figure 3. Location of Rome's historic center site
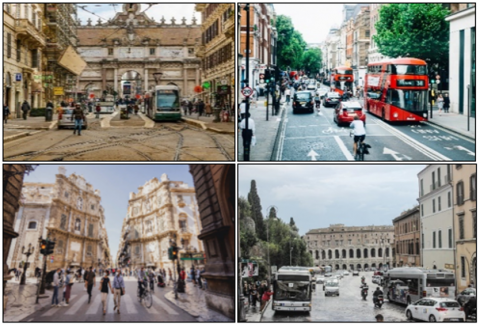
Figure 4. Diversity of transport in the historic center of Rome
Figure 5. Deriving indicators of accessibility from previous experiences
Based on the review of the experiences mentioned above, indicators related to accessibility factors can be derived, as illustrated in Figure 5. These indicators will be explained in detail in the following section.
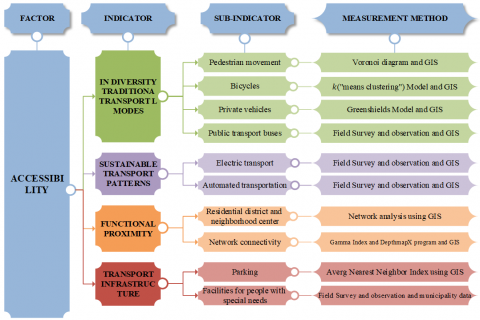
Revitalizing urban centers through enhancing accessibility constitutes a crucial strategy for promoting sustainable urban development and improving quality of life. Urban spaces prioritizing accessibility foster vibrant environments, reflecting individuals' capacity, regardless of their physical, sensory, or cognitive abilities, to efficiently and sustainably access opportunities, services, and resources available in urban centers [33]. Moreover, accessibility relies on inclusive infrastructure design that considers everyone's needs by applying the principles of universal design. Therefore, accessibility is not merely an issue of social justice but a fundamental aspect of sustainable revitalization policy aimed at achieving long-term sustainability [34]. The factor encompasses four key indicators:(diversity in traditional transportation modes, sustainable transportation modes, functional proximity, and transportation infrastructure). Each primary indicator and its sub-indicators will be elaborated upon in detail.
4.1 Diversity in traditional transport modes
Diversity in traditional transportation modes reflects the availability and variety of transport services within urban centers, enhancing their vitality and appeal. It encompasses walkability, cycling, public transit, and private transport, necessitating advanced infrastructure for efficient support. This metric is assessed through specific sub-indicators [35].
4.1.1 Pedestrian movement
Pedestrian movement constitutes a vital component of daily life, playing a significant role in revitalizing urban centers. It serves as an effective alternative to other transportation modes in terms of cost-efficiency and enhancement of public health, as well as significantly fostering social interactions among community members [35]. According to international standards for analyzing pedestrian flow, the Voronoi diagram a mathematical method for spatial partitioning based on the distances between existing points is utilized to measure pedestrian density. This approach assigns a specific space to each individual within a crowd, representing the nearest distance to that individual relative to others. Pedestrian flow is considered smooth and stable when pedestrian density remains below 3.9 persons/m². A density ranging from 3.9 to 4.33 persons/m² is deemed acceptable for sustainable revitalization of urban centers. However, when density exceeds 4.33 persons/m², pedestrian movement becomes dense and uncomfortable, accompanied by noticeable crowding and reduced mobility [36].
$D v=N / \sum_{i=1}^n|A i|$ (1)
where, Dv represents density according to the Voronoi diagram, N denotes the number of pedestrians within the studied area, and Ai indicates the area of the cell allocated to pedestrian i.
4.1.2 Bicycle
Cycling represents an effective means for urban center revitalization due to its potential to reduce traffic congestion and harmful emissions, thereby improving air quality. Additionally, bicycle mobility enhances public health by encouraging physical activity and assists in organizing urban spaces, making cities safer and more attractive to tourists [37]. This indicator will be assessed by measuring cycling density using the (k-means clustering model) within cluster analysis performed through the statistical software SPSS and subsequently represented within a Geographic Information Systems (GIS) environment (ArcGIS). This approach relies on grouping urban areas into homogeneous clusters based on a set of relevant cycling-related variables, such as routes and density, aiming to identify regions with higher bicycle traffic, according to the following equation [38]. The moderate density of cycling traffic is considered both acceptable and desirable. Table 1 presents the standards for cycling density in historical urban centers.
$J=\sum_{i=1}^k \sum_{x i \in c}\|x-u i\|^2$ (2)
where, J represents the total within-cluster variance, (k) denotes the number of clusters, Ci represents cluster i, which contains a set of similar data points, X denotes a data point within the cluster, and Ui refers to the centroid of cluster i.
Table 1. Criteria for determining density levels for bicycle traffic
|
Category |
Number of Daily Trips (per 1000 People) |
Length of Bike Paths km |
Usage Rate (%) |
|
High Density |
More than 50-100 trips |
5-10 km |
15-30% |
|
Medium Density |
20-50 trips |
2-5 km |
5-15% |
|
Low Density |
Less than 20 trips |
Less than 2 km |
Less than 5% |
4.1.3 Private vehicles
Private transportation involves individuals traveling via non-public means, primarily private vehicles. Although it enhances personal comfort and mobility within major cities, excessive reliance on private transport creates challenges such as traffic congestion and environmental pollution [39]. This indicator will be assessed using the (Greenshields Model) for measuring traffic flow based on criteria provided in Table 2. Data from selected field survey points will be recorded, analyzed, and represented using ArcGIS [40-46]. To support urban center revitalization, the lowest acceptable density is recommended, preferably limited to the center's boundaries, thereby reducing congestion and pollution and safeguarding historical centers.
$q=v . k$ (3)
where, q represents the traffic flow volume, v denotes vehicle speed, and k indicates the traffic density per km².
Table 2. Criteria for determining density levels for private vehicle traffic
|
Category |
Speed (km/h) |
Density (Vehicle/km) |
Description |
|
Low Level |
0-20 |
150-200 |
Indicates areas requiring interventions for revitalization |
|
Medium Level |
30-60 |
30-50 |
Reflects areas with moderate traffic flow |
|
High Level |
80-120 |
Less than 10 |
Represents areas with smooth traffic flow |
4.1.4 Public transport buses
Bus transit is integral to urban transportation systems, enhancing mobility efficiency, transportation diversity, and meeting community needs within historical centers, thus facilitating their revitalization. It is widely used due to its route flexibility and extensive urban coverage, characterized by interconnected networks and strategically placed stations that meet user requirements [40]. This indicator will be quantitatively assessed in a Geographic Information Systems (GIS) environment by identifying public transit routes and bus station locations, analyzing service coverage according to international standards (300–500 meters within a 5–10-minute travel time). This approach improves accessibility, reduces dependence on private vehicles, supports efficient mobility, revitalizes urban centers, and lessens environmental impacts [41].
4.2 Sustainable transport patterns
Sustainable transportation, (including electric and automated transport), refers to a set of systems designed to efficiently meet mobility demands within urban centers, thereby restoring their vitality and activity. Electric transportation contributes to reducing emissions by utilizing renewable energy, while automated transport enhances usage efficiency and reduces congestion through autonomous driving technologies [42]. It encompasses the following:
4.2.1 Automated vehicle
Automated transportation is pivotal in revitalizing urban centers by providing intelligent transport solutions that enhance traffic flow, reduce congestion and harmful emissions, and foster dynamic urban environments [43]. This transportation mode utilizes advanced computing devices and precise sensors for accurate vehicle positioning and environmental interaction, alongside intelligent infrastructure comprising high-frequency signals and visible signage for regulating speed and responding to traffic signals [44, 45]. Its assessment, conducted via Geographic Information Systems (GIS), involves identifying automated transport stations within a maximum distance of 500 meters and a travel time of 5-7 minutes, including dedicated routes spanning (20-40 km) and equipped with road (sensors, surveillance cameras, signage, and emergency systems).
4.2.2 Electric vehicle
Electric transportation represents a fundamental approach to revitalizing and energizing urban centers by offering sustainable transport solutions based on clean energy, thus significantly enhancing accessibility within urban areas. Electric vehicles provide convenient and rapid transportation, accommodating capacities ranging from (2 to 120 passengers [46]. Prominent city landmarks are serviced via strategically located stations reachable within (5-7) minutes on foot [47]. To ensure comprehensive coverage, dedicated routes extending (30-50) km are established, with stations distributed at intervals of (500-1000) meters. These stations are equipped with surveillance cameras and intelligent signage to enhance safety and efficiently guide vehicles [48].
4.3 Functional proximity
Functional proximity contributes to creating integrated and interconnected urban environments by concentrating a range of functions within spatially proximate locations that are easily accessible. This principle aims to reduce dependence on transportation modes, thereby decreasing commuting time between workplaces, residences, and recreational areas, enhancing urban center attractiveness and vitality [49]. It includes the following:
4.3.1 Residential district and neighborhood center
Accessibility to neighborhood and residential district centers is pivotal for revitalizing historical centers, aiming to reduce travel distances and encourage walking instead of private vehicle use. This approach increases pedestrian activity, fosters community engagement in public spaces, and enhances urban vitality, thereby promoting diverse activities and maximizing local amenity utilization. This indicator will be assessed using Geographic Information Systems (GIS) by defining walking distances of 400 meters to neighborhood centers and 800 meters to residential district centers [26].
4.3.2 Network connectivity
It refers to the network's capacity to facilitate efficient movement and connectivity between areas within the urban center. Effectively interconnected networks are crucial in creating vibrant, dynamic urban environments, as they minimize distances between various zones, enhancing accessibility and simplifying individual mobility [28]. This indicator will be assessed using the "Gamma Index" method, measuring the ratio of actual network connections to possible connections based on a mathematical formula. The Gamma Index values range from 0 to 1; values approaching 1 indicate greater network connectivity and integration [50]. Additionally, it will be represented using the "DepthmapX" software.
$Gamma \,\,Index=\frac{E}{(V-2) 3}$ (4)
where, E represents the number of links, and v denotes the number of nodes.
4.4 Transport infrastructure
Sustainable revitalization policies emphasize transportation infrastructure to improve accessibility in historical centers. Well-planned parking facilities alleviate congestion, reduce accidents, and enhance air quality, while smart management solutions optimize efficiency [51]. Inclusive access for individuals with disabilities is ensured through designated parking with ramps and auditory signals, promoting independence and urban appeal [52].
4.4.1 Parking
Sustainable revitalization policies aim to balance diverse urban activities with the preservation of historical character. A key strategy to achieve this goal is restricting vehicle movement within historical centers, thereby reducing pollution and creating a safe, pedestrian-friendly environment for exploring heritage sites. Parking facilities are designated on the periphery, strategically linking tourists to eco-friendly public transportation options such as electric buses, automated vehicles, and cycling networks within a 500-meter radius. This approach enhances accessibility to tourist landmarks while minimizing private vehicle dependence [53, 54]. The assessment will be conducted using Geographic Information Systems (GIS) through the "Average Nearest Neighbor Index" method. A value of 1 indicates a uniform distribution, greater than 1 signifies a dispersed pattern, and less than 1 reflects a clustered distribution.
4.4.2 People with special needs
To facilitate the mobility of individuals with disabilities, accessibility measures such as ramps and elevators are implemented to ensure independent movement within historical centers for wheelchair users [55]. Additionally, Braille signage and auditory guidance systems serve as essential solutions to assist visually impaired and blind individuals in navigating and experiencing sites autonomously. Strategically distributed rest areas further enhance visitor comfort within tourist locations [56].
This indicator will be assessed through field surveys and direct observation. The indicators and measurement methods are illustrated in Figure 6.
Figure 6. The main and sub-indicators of accessibility and measurement method
This study employed a descriptive-analytical methodology to examine the role of accessibility in the sustainable revitalization of Al-Kifl’s historic center (Figure 7). Data were derived from both primary and secondary sources. Field data included surveys and interviews with 125 purposively selected participants, comprising residents, shop owners, and domestic visitors with direct engagement in the study area. This sampling approach ensured representation of user groups familiar with local accessibility conditions.
Structured and semi-structured interviews were conducted to collect both standardized responses and detailed user perceptions of mobility and spatial quality. Quantitative analysis utilized GIS and statistical tools: Voronoi diagrams for pedestrian density, Greenshields’ model for traffic flow, and K-means clustering for bicycle usage. Spatial connectivity was measured using the Gamma Index via DepthmapX. Secondary data were collected from municipal records, urban planning departments, and historical archives. Additionally, two international case studies—Msheireb in Doha and the historic center of Rome—were analyzed to contextualize local findings and inform strategic, site-specific recommendations.
Figure 7. Research methodology
6.1 The historical center of Al-Kifl City
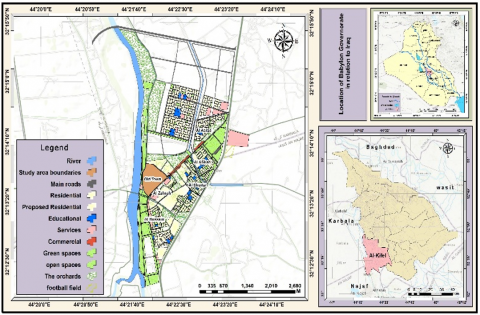
The city of Al-Kifl is one of the cities within the Al-Kifl District in Babil Governorate, Iraq. It is strategically located between three major governorates: Babil, Najaf Al-Ashraf, and Karbala Al-Muqaddasa. The city's geographical coordinates are 32°13′36″ N latitude and 44°22′2″ E longitude, with an elevation of 30 meters above sea level. Al-Kifl is situated 30 kilometers southwest of Hilla’s city center, 10 kilometers north of Kufa, and 60 kilometers south of Saddat Al-Hindiya. It is bordered to the north by Hilla, to the west by the Euphrates River, to the south by Najaf Al-Ashraf, and to the east by vast agricultural lands belonging to Babil Governorate. Throughout history, Al-Kifl has held significant importance, as it was part of the ancient Babylonian kingdom. The city derives its name from the shrine of the Prophet Dhul-Kifl (PBUH), making it a unique model of human civilization. Over centuries, it has remained a meeting point for the Abrahamic religions and a vital hub for trade and cultural exchange in Iraq. The city's geographical and historical significance is illustrated in Figure 8 [57, 58].
Figure 8. Location of the study area in Al-Kifl City
The Old Qasbah serves as the historical core of Al-Kifl, around which the city developed and expanded over the centuries. The population of the Old Qasbah stands at 4,245 residents, constituting 15.9% of Al-Kifl’s total population of 26,614, distributed across 1,033 households, resulting in an average household size of 5.4 individuals. The Old Qasbah covers an area of 34.7 hectares, representing 10% of Al-Kifl’s master plan area of 429 hectares and 17.2% of the city's residential neighborhoods, totaling 202.3 hectares. The area contains 805 residential units, yielding a population density of approximately 233 inhabitants per hectare [59].
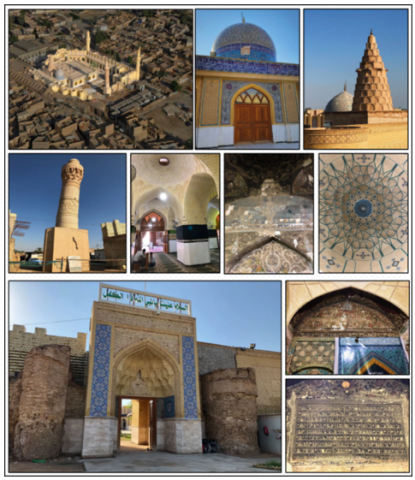
The Old Qasbah is a living testament to religious and cultural coexistence throughout history, as it hosts numerous religious landmarks spanning various faiths and historical periods. This highlights its significance as a historical and cultural hub. The demographic and spatial characteristics of the Old Qasbah are documented in the Urban Renewal Report for the Shrine of the Prophet Dhul-Kifl and Its Surrounding Areas (Directorate of Statistics, Babil).
The historical city of Al-Kifl holds global significance due to the shrine of the Prophet Dhul-Kifl, a sacred site revered by Muslims and Jews. Until the mid-20th century, Al-Kifl functioned as a religious nexus, hosting major Jewish celebrations attended by thousands of Iraqi Jews twice annually, underscoring its role in cultural and religious interaction. Locally, Al-Kifl is an agricultural hub, benefiting from its strategic location on the Euphrates River and fertile lands that produce wheat, rice, and barley. The city also features notable historical landmarks, such as the Al-Nukhaila Mosque, with its conical minaret from the reign of Sultan Abu Sa'id Bahadur Khan (730 AH), and Daniel’s Historic Market, exemplifying historic Muslim-Jewish coexistence. Efforts are underway to nominate these sites for UNESCO’s World Heritage List, recognizing their cultural and historical value [59, 60].
The Tomb of Ezekiel serves as Al-Kifl’s urban focal point, both functionally and visually. Its hybrid architecture, blending Ottoman minarets, Islamic inscriptions, and remnants of Jewish symbols, defines the city’s skyline. The adjacent historical market square reinforces the shrine’s centrality as a transitional space between sacred and secular realms. Urban studies emphasize the symbiotic relationship between the shrine’s vertical dominance—marked by its dome and minaret—and the surrounding low-rise brick structures, forming a hierarchical urban composition that highlights its spiritual prominence. hierarchical urban composition that amplifies its spiritual significance.
The historical center of Al-Kifl integrates religious institutions, including madrasas, libraries, and shrines, creating opportunities for sustainable revitalization. The urban fabric is dominated by traditional brick architecture with ornate geometric facades and enclosed courtyards, contrasting with modern concrete structures on the periphery.
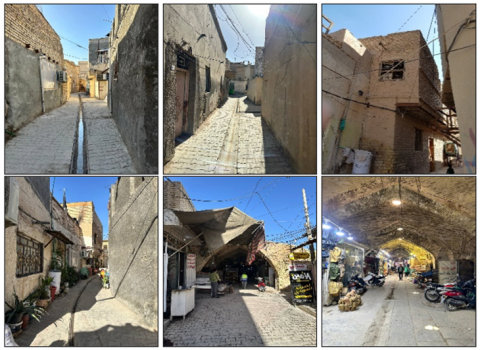
Despite restoration efforts, such as the shrine’s foundation reinforcement in 2016, the area faces challenges from uncontrolled urbanization, incompatible modern interventions, and environmental degradation. Key concerns include preserving narrow alleyways (often under 3 meters), culturally sensitive redevelopment of vacant lands, and mitigating visual encroachments from modern projects [60, 61] (Figure 9).
Figure 9. The historic center of Al-Kifl
6.2 Urban fabric of the historic center of Al-Kifl City
The historical center of Al-Kifl has undergone structural transformations, with unregulated expansion weakening its connectivity to surrounding areas. Enhancing urban transport networks and pedestrian corridors is key to reintegrating the center with residential and economic zones [60].
With its strategic location and diverse activities, Al-Kifl possesses the characteristics of a traditional Islamic urban center (Figure 10, Table 3). Achieving this requires balanced planning policies that preserve architectural heritage while supporting economic activity, ensuring the historical center’s functional continuity [62].
Figure 10. Land uses of the study area by using GIS analysis and data from Al-Kifl municipality
Table 3. Land use area in the historical center of Al-Kifl City, from data base of Al-Kifl municipality
|
No. |
Usage |
Area (Hectare) |
% |
|
1 |
Residential |
19 |
55.88 |
|
2 |
Commercial |
3.38 |
9.93 |
|
3 |
Educational |
2.39 |
7.03 |
|
4 |
Administrative |
1.43 |
4.22 |
|
5 |
Religious |
7.03 |
20.69 |
|
6 |
Parking |
0.29 |
0.85 |
|
7 |
Public spaces |
0.48 |
1.41 |
|
Total |
34 |
100% |
|
The shrine of Prophet Dhul-Kifl and other religious sites serve as significant religious and tourist attractions, necessitating improved transport systems to boost economic and service-sector activity in adjacent areas, fostering a dynamic and sustainable urban environment. Climatic conditions present urban planning challenges, requiring sustainable strategies such as using local materials for heritage restoration and improving shading networks to mitigate environmental impacts. Historical transformations underscore the need for integrated strategies that sustain the historical center’s vitality through continuous urban activity [63].
Amid rapid environmental and social changes, enhancing accessibility to Al-Kifl’s historical center is central to urban conservation strategies. This demands a comprehensive approach balancing cultural heritage preservation with economic and environmental adaptability, ensuring the city's urban sustainability in a contemporary context [59].
6.3 Measuring accessibility indicators
The sustainable revitalization of Al-Kifl’s urban center is a complex challenge, requiring an approach that integrates environmental, social, and economic dimensions. In this context, accessibility indicators will serve as a key metric for evaluating the effectiveness of revitalization efforts, as follows:
6.3.1 Diversity in traditional transport modes
(1) Pedestrian movement
A field study was conducted to analyze pedestrian movement and distribution across three key locations (Figure 11). Observations were carried out at three-time intervals (9 AM, 12 PM, and 8 PM) throughout the day. Voronoi diagrams were applied using SPSS to measure pedestrian density (Table 4).
Table 4. Pedestrian density in the three lanes of the study area
|
Path |
Number of Pedestrians |
Width |
Voronoi Digram |
||
|
9:00 AM |
12:00 PM |
8:00 PM |
|||
|
1 |
45 |
75 |
50 |
15 |
3.3 |
|
2 |
30 |
50 |
25 |
8 |
3.1 |
|
3 |
20 |
35 |
20 |
8 |
2.5 |
Figure 11. Pedestrian movement in the study area
Results indicated an average pedestrian density of 2.96 persons/m² across the three paths, reflecting smooth and stable movement, as values remained below 3.9 persons/m² per cell. The low density is attributed to the lack of pedestrian-attracting amenities.
Such low pedestrian density carries adverse implications for the socio-economic vitality of the historic center, limiting opportunities for social interaction and indicating an underutilization of the area's potential. Consequently, a paramount priority for sustainable revitalization strategies must be the fundamental enhancement of the pedestrian realm. This entails providing safe, shaded walkways, adequate seating, and integrating diverse activities and services designed to attract residents and visitors, thereby encouraging walking and active presence within the space, which ultimately contributes to achieving urban sustainability objectives.
A custom tool was developed by the researcher to measure pedestrian density using the Voronoi diagram, accessible via the link: https://z3zl6s.csb.app/.
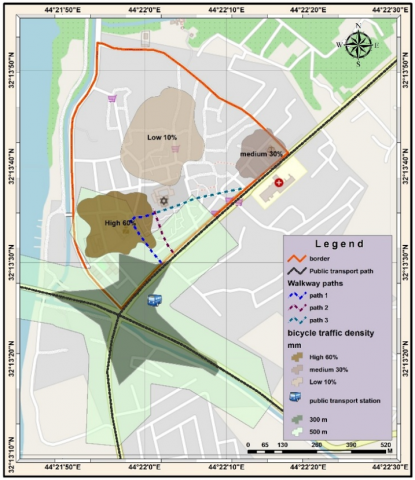
(2) Bicycle
Field surveys revealed a near-complete absence of dedicated cycling infrastructure within the historic center. Consequently, data indicated that bicycle usage accounts for less than 5% of total daily trips, largely confined to children primarily for commuting to school or recreational purposes. Spatial clustering analysis using the K-Means model corroborated this low density, identifying three main clusters of limited usage: areas near schools (highest density, approx. 60%), recreational zones (moderate density, approx. 30%), and other areas exhibiting very low density (less than 10%).
The lack of safe and encouraging facilities stands as the primary barrier hindering broader adoption of cycling as an effective transport mode among diverse population segments. Current usage, restricted to specific groups and purposes, suggests suppressed potential demand. The spatial distribution of existing usage highlights potential priority locations for infrastructure improvement interventions.
This minimal level of bicycle use represents a missed opportunity to foster sustainable and healthy mobility within the historic center and likely increases reliance on private vehicles. Therefore, sustainable revitalization strategies must incorporate clear plans for integrating safe and convenient cycling infrastructure (e.g., dedicated or safely shared lanes, bicycle parking). Interventions could prioritize areas already showing higher usage density (near schools and recreational zones) to promote cycling as a viable and attractive sustainable transport alternative, thereby contributing to reduced congestion and improved urban environmental quality.
Figure 12 illustrates the distribution of the resulting clusters when applying the model. The colored points represent the actual use of bicycles, with each color corresponding to a specific cluster. The red points indicate the cluster centers.
Figure 12. Increase in private vehicle traffic flow according to the Greenshields model using SPSS
(3) Private vehicles
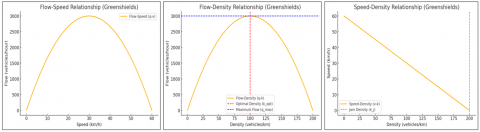
Field surveys and traffic analyses revealed a high density of private vehicles within the historic center, ranging between 150 and 200 vehicles per kilometer (veh/km). Application of the Greenshields model corroborated these findings, demonstrating that speeds decrease sharply with increasing density (dropping to approximately 20 km/h at 200 veh/km), leading to a significant reduction in traffic flow efficiency at such high-density levels.
Interpretation: This high traffic density translates directly into substantial congestion, impeded movement, and tangible negative impacts on the visual and heritage character of the historic center. Furthermore, the reduced traffic flow efficiency indicates the current network's inability to effectively accommodate this volume of vehicular traffic.
Implications for Revitalization: Such high volumes of private vehicle traffic directly conflict with the principles and objectives of sustainable urban revitalization, which advocate for reduced private vehicle dependency in historic cores. Consequently, managing and restricting private vehicle access (e.g., limiting it to peripheral areas or implementing time-based restrictions) emerges as a critical and essential measure to preserve the heritage fabric, minimize environmental and noise pollution, improve safety, and enhance the overall quality of the urban environment in alignment with sustainability requirements.
Figure 13 illustrates the relationship between speed, density, and traffic flow. The first diagram shows a linear speed decline with increasing density, the second highlights the peak flow at optimal density, and the third demonstrates low flow at reduced speeds, emphasizing the need for traffic restrictions and sustainable transport solutions.
A custom tool for calculating traffic flow using Greenshields Model is available at: https://qdwcpz.csb.app/.
Figure 13. Field survey routes, spatial distribution of bicycle use density, public transport routes, public transport stations, and service area of the public transport station in the historic center of Al-Kifl City using GIS
(4) Public transport buses
Field surveys indicated that public transport service in Al-Kifl relies primarily on 14-passenger minibuses operating solely along the main arterial road (Figure 14). The city possesses only one terminal, situated on the periphery of the historic center, with no additional stations or stops within the historic fabric itself. Consequently, effective service coverage is concentrated within a narrow radius of approximately 300 to 500 meters from this terminal and main route.
Figure 14. Service area of the center: neighborhood area and residential district using GIS
This situation reveals severe deficiencies in the current public transport system regarding spatial coverage and infrastructure. Reliance on a single route and terminal leaves large portions of the historic center effectively unserved, creating significant accessibility barriers for residents and visitors who lack private vehicles or prefer not to use them.
Such inadequacy in public transport provision critically undermines the objectives of sustainable and inclusive revitalization. It fails to offer equitable access for all to the historic center and its amenities, and inevitably forces greater reliance on private vehicles, thereby exacerbating congestion and pollution. Therefore, revitalization strategies must incorporate fundamental improvements and expansion of the public transport network as a core component. This should involve exploring options for new intra-center routes (using appropriately sized vehicles), increasing service frequency, establishing safe and convenient stops, and potentially integrating complementary public transport modes to ensure effective and sustainable access for everyone.
6.3.2 Sustainable transport patterns
Field surveys revealed a complete absence of automated public transport systems (e.g., autonomous shuttles, Personal Rapid Transit) and a lack of widespread adoption of electric transport modes within Al-Kifl's historic center. Furthermore, there is a clear deficiency in the essential supporting infrastructure required for such advanced systems, including equipped stations, dedicated routes, and smart surveillance and guidance systems.
This absence signifies the historic center's total reliance on conventional transport modes and a lag in embracing modern developments in sustainable and intelligent mobility. The lack of supporting infrastructure reflects not only a technological unpreparedness but also highlights deeper challenges related to urban planning and spatial allocation within a sensitive and complex historic fabric.
Although implementing some advanced technologies poses challenges in a historic context, neglecting to plan for or explore the integration of context-appropriate sustainable transport solutions (automated or electric) signifies missing future opportunities to enhance mobility efficiency, significantly reduce environmental impact, and improve quality of life. Therefore, sustainable revitalization strategies should encompass feasibility studies and long-term planning to consider the potential introduction of clean and smart transport technologies that are sensitive to the heritage context. The aim should be to improve overall accessibility and transform the center into an attractive, balanced urban area that meets sustainability goals while preserving its historical identity.
6.3.3 Functional proximity
(1) Residential district and neighborhood center:
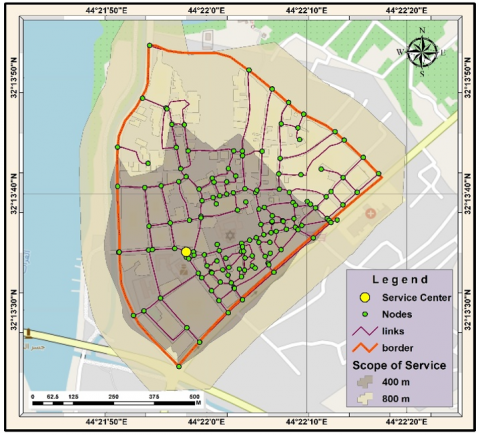
The studies area integrates characteristics of both a residential district (as per municipal boundaries) and a neighborhood unit (based on its population of 4245 residents). Accessibility patterns to the service center were analyzed within two radii: 400 meters for the neighborhood center and 800 meters for the residential district center. A central point was designated to represent the service center, and network analysis within a Geographic Information Systems (GIS) environment was employed to delineate service coverage based on the road network of the historical center.
The results demonstrated comprehensive coverage for all residents, this high level of current accessibility is an important strategic asset and a key feature of the sustainable activation process. It promotes walking, reduces the need to use vehicles for short daily trips, and supports social cohesion and interaction within the neighborhood. Therefore, activation strategies must prioritize maintaining and enhancing this feature see Figure 15.
Figure 15. Network connectivity using GIS and DepthmapX
(2) Network connectivity
Analysis of the road network identified 100 links and 148 nodes. Application of the Gamma Index to assess network connectivity yielded a value of 0.23. Spatial analysis using DepthmapX further revealed that high connectivity levels are confined to the city's main road and a few central axes, while most other parts of the historic center exhibit low connectivity and lack functional road integration.
The very low Gamma Index value signifies poor overall functional efficiency of the network and limited route choice availability. This is primarily attributed to the organic nature of the historical layout, where the network evolved in an unstructured manner over different periods responding to residents' needs, resulting in poor integration between different parts of the center despite node concentration around key landmarks like the historic Al-Nukhaila Mosque.
While reflecting historical authenticity, this low and fragmented connectivity can impede ease of movement and navigation within the historic center, particularly for unfamiliar users or services. It may also lead to the isolation of certain areas and potentially limit economic vitality. Therefore, while respecting the historic layout, revitalization strategies should aim to improve navigability through clear and effective signage systems and readily available spatial information. Furthermore, the feasibility of creating strategic pedestrian linkages at specific points could be explored to enhance permeability and functional integration without causing major disruptions to the historic fabric, thereby supporting a more vibrant and integrated historic core see (Figure 16).
Figure 16. Scope of service and Average Nearest Neighbor Index using GIS
A custom tool was developed by the researcher to calculate the Gamma Index, accessible via: https://d49v88.csb.app/.
6.3.4 Transport infrastructure
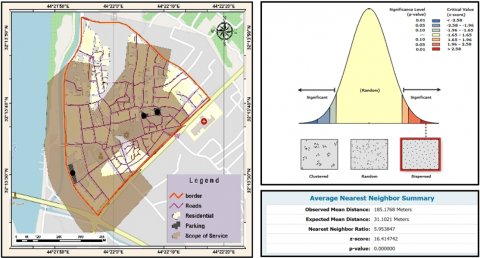
(1) Parking
The field survey identified three parking facilities: one privately owned on the left side of the study area (1,490 m²) and two associated with the historic Al-Nukhaila Mosque (1,400 m²). GIS Nearest Neighbor Analysis revealed a highly dispersed distribution pattern for existing parking facilities (NNR = 5.95), significantly exceeding expected random distribution and indicating spatial inefficiency. Network coverage analysis further showed that parking service is heavily concentrated around major historical landmarks, leaving other parts of the historic center underserved. Critically, a complete absence of dedicated parking facilities linked to sustainable public transport within 500 meters (i.e., park-and-ride) was observed.
This simultaneously dispersed yet concentrated pattern signifies an inefficient, ad-hoc parking system that lacks strategic planning and fails to serve the historic center uniformly or adequately. The absence of park-and-ride facilities highlights a major gap in integrating parking management with broader sustainable transport objectives.
This inefficient and poorly integrated parking system negatively impacts accessibility, contributes to visual clutter and potential heritage degradation (in cases of uncontrolled on-street parking), and fails entirely to support sustainable mobility goals. Therefore, sustainable revitalization necessitates a comprehensive parking management strategy. This strategy should involve optimizing the management of existing spaces, potentially consolidating parking into well-designed facilities (preferably peripherally located), implementing control measures (e.g., pricing, permits), and crucially, developing dedicated park-and-ride facilities that are well-connected to improved public transport services, aligning with recommended sustainable revitalization policies, see Figure 17.
Figure 17. Streets in the historic center of Al-Kifl
(2) People with special needs
Field surveys confirmed an almost complete absence of essential accessibility facilities for people with special needs – such as adequate ramps, accessible pathways, and elevators in public buildings – throughout the historic center.
This severe lack of facilities constitutes a major physical and social barrier, effectively preventing individuals with disabilities and the elderly from navigating the center independently and participating fully in its activities. This situation is interpreted as stemming from weak public policies concerning universal access, the lack of clear and binding regulations mandating universal design standards, and historical neglect by planning and executive authorities.
The exclusion of a significant segment of the community due to physical barriers directly contradicts the principles of sustainable, equitable, and socially inclusive revitalization. Ensuring access for all is not merely a technical requirement but a fundamental aspect of social equity and urban quality of life. Consequently, revitalization plans and strategies for Al-Kifl's historic center must prioritize addressing this deficiency systematically. This necessitates the integration and application of Universal Design principles across all public realm improvements (providing ramps, tactile paving, clear routes, accessible restrooms, available information) and within public and heritage buildings (where technically feasible and respecting heritage values), in order to create a truly welcoming and usable historic center for everyone, without exception. Table 5 provides a summary of all indicators.
Table 5. Measurement of indicators summary
|
Main Indicator |
Sub-Indicator |
Measurement Method |
Standard |
Case Study Reality |
|
Diversity in Traditional Transport Modes |
Pedestrian Movement |
Using the Voronoi Diagram and GIS analysis to measure pedestrian density (number of persons per m²) |
Acceptable density: between 2 and 3.9 persons/m² to ensure smooth and stable movement |
In some pathways, the pedestrian density reached 2.96 persons/m²; the relatively lower value is attributed to weak attractive facilities, indicating the need to enhance the urban environment and attraction factors |
|
Bicycles |
K-Means Clustering analysis in GIS to determine clusters of bicycle usage density |
Medium density: 20–50 trips per 1000 persons and a usage rate ranging between 5%–15% |
Bicycle usage is very limited (less than 5%) and mainly concentrated among children and school students; this is due to the absence of dedicated lanes and weak awareness of sustainable transport |
|
|
Private Vehicles |
Applying the Greenshields model to measure traffic flow (relationship between speed and density) and analyzing it using GIS |
Average traffic level: density of 30–50 vehicles/km and speed of 30–60 km/h |
Vehicle density sometimes reaches 150–200 vehicles/km at speeds of 15–60 km/h, leading to congestion and negatively affecting the historic character of the center. It is recommended to restrict private vehicle entry and promote public transport |
|
|
Public Transport Buses |
Field survey and service area analysis using network tools in GIS |
Availability of public transport stations within 300–500 meters from users, with a travel time not exceeding 5–10 minutes |
There is only one station at the edge of the historic center, limiting public transport coverage; residents must walk 5–7 minutes to access it, leading to greater reliance on private vehicles |
|
|
Sustainable Transport Patterns |
Automated Transportation |
Field survey and GIS data analysis to identify proposed station locations and routes |
Automated transport stations within a distance not exceeding 500 m, with a travel time of 5–7 minutes, and equipped with smart infrastructure (e.g., cameras, signage) |
There is currently no infrastructure for automated transportation in the historic center, necessitating the inclusion of smart, automated transport solutions in future revitalization plans |
|
Electric Transportation |
Field survey and GIS analysis to determine electric transport routes and charging stations |
Coverage over a distance of 30–50 km; charging stations spaced 500–1000 m apart, with a capacity of 2–12 passengers |
There are no stations or facilities for electric transportation; this calls for a strategy to encourage investment in this form of sustainable transport |
|
|
Functional Proximity |
Residential District & Neighborhood Center |
Network analysis using GIS to determine service areas |
400 m for neighborhood centers and 800 m for residential district centers, reducing reliance on private vehicles and promoting walking |
Analysis shows almost comprehensive coverage for residents within 400 and 800 m, supporting access to essential services and enhancing the center’s vitality |
|
Network Connectivity |
Gamma Index measurement and analysis using DepthmapX to assess road connectivity |
Gamma value ranges from 0 to 1; the closer the value is to 1, the higher the connectivity |
The index reached 0.23, reflecting weak connectivity in the historic organic road network; this calls for a careful re-structuring of the network without compromising its heritage value |
|
|
Transport Infrastructure |
Parking |
Averaged Nearest Neighbor Index in GIS to determine the distribution pattern of parking lots and analyze the service area |
Even distribution of parking lots on the periphery of the historic center, linked to sustainable public transport, within a distance not exceeding 500 m |
The results indicate a scattered distribution; the average distance between parking lots is 185 m, which limits mobility efficiency and increases congestion. It is recommended to establish multi-story parking facilities outside the historic center |
|
Facilities for People with Special Needs |
Field survey and interviews with relevant authorities; verification of ramps, elevators, and Braille signage |
Provision of design elements that ensure inclusive access, such as ramps, elevators, and audio-visual signals |
There are no specialized facilities or ramps for people with special needs within the historic center; this constitutes a major obstacle to their full integration into social and cultural activities |
The study results indicate that enhancing accessibility plays a pivotal role in the revitalization of the historical center of Al-Kifl, underscoring its significance in promoting urban sustainability and supporting socio-economic development. The study identified major challenges, including weak infrastructure and the absence of comprehensive and integrated planning.
Regarding diversity in traditional transportation modes, the study revealed a notable decline in pedestrian density, averaging 2.96 persons/m², which is below the optimal threshold of 3.9 persons/m² required to foster urban vitality. Bicycle usage was recorded at less than 5%, primarily due to the lack of dedicated and safe cycling lanes, increasing reliance on private vehicles, whose density ranged between 150 and 200 vehicles per kilometer, leading to a decrease in mobility speed to approximately 20 km/h and an increase in traffic congestion and environmental pollution. The public transport system exhibited clear spatial limitations, with service availability restricted to a narrow range (300–500 meters from the transit hub), reducing its effectiveness for both residents and visitors.
Concerning sustainable transport, the findings revealed a complete absence of infrastructure to support electric and automated transportation, limiting the potential for adopting sustainable transport strategies that are essential for improving the urban environment, reducing harmful emissions, and enhancing the attractiveness of the historical center.
Regarding functional proximity, network analysis using the Gamma Index confirmed weak network connectivity, with a low value of 0.23, significantly limiting social, economic, and cultural interactions. In contrast, spatial accessibility analysis demonstrated adequate coverage, with accessibility to neighborhood centers within 400 meters and residential district centers within 800 meters, ensuring acceptable walking distances.
Regarding transport infrastructure, the results highlighted the inadequacy of available parking facilities and their inefficient spatial distribution, posing additional mobility challenges within the center. Specifically, the current parking distribution was found to be suboptimal, with an average spacing of approximately 185 meters between parking facilities, emphasizing the need for better-planned and strategically located parking spaces. Additionally, a significant lack of accessibility facilities for individuals with disabilities was observed, further hindering universal and effective access for this critical demographic.
The study underscores the urgent need for integrated planning strategies that enhance accessibility through the development of all transportation modes and infrastructure, while ensuring the provision of essential facilities for individuals with disabilities. These measures are vital for achieving the sustainability of the urban center while preserving its historical and cultural identity.
The study findings confirm that accessibility is a key factor in achieving urban sustainability and promoting sustainable revitalization of historical city centers, as demonstrated by the analytical study of Al-Kifl’s historical center. The research highlights the critical role of accessibility in revitalizing the historical center by improving connectivity between residential areas and religious and cultural landmarks, thereby fostering social and economic interaction in the region.
The results reveal significant challenges related to deficiencies in the existing infrastructure, particularly the lack of suitable facilities for sustainable transport modes, such as electric and automated transportation, which hinders genuine urban sustainability. While pedestrian infrastructure is relatively adequate, its utilization remains limited due to the absence of attractive public spaces for residents and visitors.
Additionally, the study underscores the urgent need to improve public transport infrastructure, including expanding service coverage, optimizing bus stop distribution, and developing smart parking systems on the periphery of the center. Establishing dedicated and sustainable routes for electric and automated transport is also crucial. The findings emphasize the importance of integrating accessibility for individuals with disabilities through dedicated pathways and ramps, ensuring independent access for all demographic groups.
Finally, the study presents a set of practical indicators that can be incorporated into sustainable urban planning policies, aiming to balance historical and cultural preservation with urban development. These indicators enhance the potential for successful revitalization projects in historical cities and offer a replicable model for similar urban areas, reinforcing accessibility as a fundamental driver of sustainability and long-term urban resilience.
The research emphasizes enhancing accessibility as a key strategy for revitalizing historical centers. It recommends expanding accessibility data to facilitate detailed assessments of urban interventions, supporting sustainable transport infrastructure and urban connectivity, which in turn boosts economic, social, and cultural activities.
Additionally, the study highlights the importance of site-specific research to integrate heritage sites with local communities, fostering social engagement while preserving cultural identity. It also calls for clear accessibility standards, particularly for individuals with disabilities, ensuring inclusive and sustainable access to historical centers.
(1) Appendix. Scription of Custom Analytical Tools
To enhance analytical transparency and reproducibility, the study employs three custom-developed web tools. These tools were designed and programmed by the researcher and are openly accessible via the links provided below. Each tool directly supports one of the key spatial or statistical analyses conducted in this research.
a. Pedestrian Density Mapping Tool using Voronoi Diagrams (https://z3zl6s.csb.app/): This tool enables users to visualize pedestrian density patterns by generating Voronoi diagrams based on input coordinates. It supports spatial interpretation of accessibility and walkability within urban centers, particularly in relation to service proximity and human flow distribution.
b. Traffic Flow Estimation Tool using Greenshields Model (https://qdwcpz.csb.app/): This tool calculates traffic flow characteristics by applying the Greenshields linear model, using input values such as speed and density. It was instrumental in quantifying vehicular movement patterns across the study area and assessing roadway performance.
c. Network Connectivity Tool using Gamma Index (https://d49v88.csb.app/): This tool computes the Gamma Index to evaluate the connectivity and efficiency of the street network. It supports comparative spatial analysis between different urban layouts, reflecting the structural accessibility of the built environment.
All tools were tested for functionality, and the links are fully operational. They serve as extensions to the GIS and statistical analyses presented in the study.
[1] Baqralsham, N.J., Al-Khafaji, A.S. (2025). Functions and activities as a catalyst for successful sustainable adaptive reuse of heritage areas: A study of the religious center of Karbala city, Iraq. International Journal of Sustainable Development and Planning, 20(1): 75-87. https://doi.org/10.18280/ijsdp.200109
[2] Huang, J., Hu, X., Wang, J., Lu, A. (2023). How diversity and accessibility affect street vitality in historic districts? Land, 12(1): 219. https://doi.org/10.3390/land12010219
[3] Ruiz-Rodrigo, A., Morales, E., Lakoud, M., Riendeau, J., Lemay, M., Savaria, A., Routhier, F. (2024). Experiencing accessibility of historical heritage places with individuals living with visible and invisible disabilities. Frontiers in Rehabilitation Sciences, 5: 1379139. https://doi.org/10.3389/fresc.2024.1379139
[4] Çelimli, M.A., Oral, M. (2022). Completely accessibility solutions for historical building and areas in the multi-layered city center of Sivas. ICONARP International Journal of Architecture and Planning, 10(2): 891-915. https://doi.org/10.15320/iconarp.2022.228
[5] OECD. (2021). Transport Strategies for Net-Zero Systems by Design. https://doi.org/10.1787/0a20f779-en
[6] Şahin Körmeçli, P. (2024). Accessibility of urban tourism in historical areas: Analysis of UNESCO World Heritage Sites in Safranbolu. Sustainability, 16(6): 2485. https://doi.org/10.3390/su16062485
[7] Lei, H., Zhou, Y. (2022). Conducting heritage tourism-Led urban renewal in Chinese historical and cultural urban spaces: A case study of Datong. Land, 11(12): 2122. https://doi.org/10.3390/land11122122
[8] Farhan, S.L., Merie, U.A.A.K., Nasar, Z. (2024). Revitalizing historic city center a comparative methodology of current approaches and alternatives. Journal of Cultural Heritage Management and Sustainable Development. https://doi.org/10.1108/JCHMSD-08-2022-0148
[9] Rahman, M., Piccolo, F., Bonafede, G. (2019). Sustainable urban revitalization within a historical urban neighborhood-a useful approach to complete. Journal of Advanced Research in Construction and Urban Architecture, 4: 35-53.
[10] Colantonio, A., Dixon, T., Ganser, R., Carpenter, J., Ngombe, A. (2009). Measuring socially sustainable urban regeneration in Europe. Creating Sustainable Environments, pp. 1-234.
[11] Tallon, A. (2020). Urban Regeneration in the UK. https://doi.org/10.4324/9781351030304
[12] Abdullah, S.F.K., Al-Alwan, H.A. (2019). Urban resilience in the sustainable urban regeneration of historic city centers. Association of Arab Universities Journal of Engineering Sciences, 26(4): 130-143. https://doi.org/10.33261/jaaru.2019.26.4.015
[13] Kim, J.K. (2022). This is our voice: Revitalizing ren as a homiletical concept for resistance to anti-Asian hate crimes. Practical Theology, 15(3): 285-296. https://doi.org/10.1080/1756073X.2021.2023079
[14] Balsas, C.J. (2007). City centre revitalization in Portugal: A study of Lisbon and Porto. Journal of Urban Design, 12(2): 231-259. https://doi.org/10.1080/13574800701306328
[15] Gao, J., Wu, B. (2017). Revitalizing traditional villages through rural tourism: A case study of Yuanjia Village, Shaanxi Province, China. Tourism Management, 63: 223-233. https://doi.org/10.1016/j.tourman.2017.04.003
[16] Mrak, I., Ambruš, D., Marović, I. (2022). A holistic approach to strategic sustainable development of urban voids as historic urban landscapes from the perspective of urban resilience. Buildings, 12(11): 1852. https://doi.org/10.3390/buildings12111852
[17] Ristic, M., Frank, S. (2019). Urban Heritage in Divided Cities: Contested Pasts. Routledge. https://doi.org/10.4324/9780429460388
[18] McTominey, A. (2022). Bibliography of urban history 2022. Urban History, 49(4): 828-874. https://doi.org/10.1017/S0963926822000402
[19] Wiedmann, F., Salama, A.M., Mirincheva, V. (2014). Sustainable urban qualities in the emerging city of Doha. Journal of Urbanism: International Research on Placemaking and Urban Sustainability, 7(1): 62-84. https://doi.org/10.1080/17549175.2013.870088
[20] AL Fadala, E.S., Furlan, R. (2018). Sustainable neighborhoods in the state of Qatar: Msheireb downtown Doha. Saudi Journal of Engineering and Technology. https://doi.org/10.21276/sjeat.2018.3.7.2
[21] Amerio, M. (2020). Doha metro project: 3TI lesson learned. Transportation Research Procedia, 45: 866-873. https://doi.org/10.1016/j.trpro.2020.02.082
[22] Tannous, H.O., Furlan, R., Major, M.D. (2020). Souq waqif neighborhood as a transit-oriented development. Journal of Urban Planning and Development, 146(4): 05020023. https://doi.org/10.1061/(ASCE)UP.1943-5444.0000615
[23] Hasan, M., Fadli, F. (2023). Multimodal transport for smart mobility in emerging cities: Case of Doha. In Proceedings of the International Conference on Civil Infrastructure and Construction (CIC), pp. 933-940. https://doi.org/10.29117/cic.2023.0120
[24] Al-Hammadi, M.I. (2023). Deterritorialization in the context of cultural heritage and globalizing Msheireb downtown Doha. Frontiers in Sustainable Cities, 5: 1186781. https://doi.org/10.3389/frsc.2023.1186781
[25] Al-Thani, S.M.A. (2021). Tod's role in enhancing urban quality of life and preserving built heritage: The case of Msheireb downtown Doha (Master's thesis).
[26] Ciommi, M., Chelli, F.M., Carlucci, M., Salvati, L. (2018). Urban growth and demographic dynamics in southern Europe: Toward a new statistical approach to regional science. Sustainability, 10(8): 2765. https://doi.org/10.3390/su10082765
[27] Marra, F., Rosa, C., Silvestri, D., Bordoni, P., Bulian, F., Florindo, F., Salvini, R. (2024). Predict: Assessing the seismic response in the city of Rome, Part 1. New data for a geologic overview. Annals of Geophysics, 67(3): SE325. https://doi.org/10.4401/ag-9116
[28] Heo, T., Kim, K., Kim, H., Lee, C., Ryu, J.H., Leem, Y.T., Ko, J. (2014). Escaping from ancient Rome! Applications and challenges for designing smart cities. Transactions on Emerging Telecommunications Technologies, 25(1): 109-119. https://doi.org/10.1002/ett.2787
[29] Jiménez Martín, D., Ramírez Saiz, A., Ajuriaguerra Escudero, M.A. (2022). Urban accessibility in world heritage cities. Accessibility considerations in pedestrian routes in historic city centres. In Transforming our World through Universal Design for Human Development, pp. 499-506. https://doi.org/10.3233/SHTI220879
[30] Coppola, P., Papa, E. (2013). Accessibility planning tools for sustainable and integrated land use/transport (LUT) development: An application to Rome. Procedia-Social and Behavioral Sciences, 87: 133-146. https://doi.org/10.1016/j.sbspro.2013.10.599
[31] Di Mascio, P., Fusco, G., Grappasonni, G., Moretti, L., Ragnoli, A. (2018). Geometrical and functional criteria as a methodological approach to implement a new cycle path in an existing urban road network: A Case study in Rome. Sustainability, 10(8): 2951. https://doi.org/10.3390/su10082951
[32] Kurzhanskiy, A.A., Varaiya, P. (2015). Traffic management: An outlook. Economics of Transportation, 4(3): 135-146. https://doi.org/10.1016/j.ecotra.2015.03.002
[33] Miller, E.J. (2018). Accessibility: Measurement and application in transportation planning. Transport Reviews, 38(5): 551-555. https://doi.org/10.1080/01441647.2018.1492778
[34] Graells-Garrido, E., Serra-Burriel, F., Rowe, F., Cucchietti, F.M., Reyes, P. (2021). A city of cities: Measuring how 15-minutes urban accessibility shapes human mobility in Barcelona. PLoS ONE, 16(5): e0250080. https://doi.org/10.1371/journal.pone.0250080
[35] Pareekh, P., Mitra, S., Majumdar, B.B. (2017). Quantifying dimensions of transportation diversity: A city-based comparative approach. Transportation Research Procedia, 25: 3174-3187. https://doi.org/10.1016/j.trpro.2017.05.359
[36] Steffen, B., Seyfried, A. (2010). Methods for measuring pedestrian density, flow, speed and direction with minimal scatter. Physica A: Statistical Mechanics and Its Applications, 389(9): 1902-1910. https://doi.org/10.1016/j.physa.2009.12.015
[37] Kędziorek, P., Kasprzyk, Z., Rychlicki, M., Rosiński, A. (2023). Analysis and evaluation of methods used in measuring the intensity of bicycle traffic. Energies, 16(2): 752. https://doi.org/10.3390/en16020752
[38] Wang, C.H., Chen, N. (2021). Do multi-use-path accessibility and clustering effect play a role in residents' choice of walking and cycling? (No. 21-12). Mineta Transportation Institute. https://doi.org/10.31979/mti.2021.2011
[39] Liu, Y., Ding, X., Ji, Y. (2023). Enhancing walking accessibility in urban transportation: A comprehensive analysis of influencing factors and mechanisms. Information, 14(11): 595. https://doi.org/10.3390/info14110595
[40] Bannaga, S.E.I. (2018). Revitalization of greater Khartoum urban transportation system. Future Cities and Environment, 4: 10-10. https://doi.org/10.5334/fce.2
[41] Yang, S., Kim, J.H., Sohn, W., Kotval-K, Z. (2020). Developing a revitalization planning and design guideline for enhancing land use performance of a shrinking city. Journal of People, Plants, and Environment, 23(4): 387-398. https://doi.org/10.11628/ksppe.2020.23.4.387
[42] Perotti, E., Ospina, A.M., Bianchin, G., Simonetto, A., Dall’Anese, E. (2023). Renewable-based charging in green ride-sharing. Scientific Reports, 13(1): 15425. https://doi.org/10.1038/s41598-023-42042-z
[43] Shi, J., Gao, Y., Wang, W., Yu, N., Ioannou, P.A. (2019). Operating electric vehicle fleet for ride-hailing services with reinforcement learning. IEEE Transactions on Intelligent Transportation Systems, 21(11): 4822-4834. https://doi.org/10.1109/TITS.2019.2947408
[44] Bencherif, A., Tie, M., Martel, R., Bouilly, D. (2024). Automated and parallel transfer of arrays of oriented graphene ribbons. NPJ 2D Materials and Applications, 8(1): 53. https://doi.org/10.1038/s41699-024-00491-8
[45] Al-Ansari, H.A., Al-Khafaji, A.S. (2023). Enhancing public health through sustainable urban design: An examination of transportation and green space integration. Journal of Urban Development and Management, 2(2): 104-114. https://doi.org/10.56578/judm020205
[46] Shaukat, N., Khan, B., Ali, S.M., Mehmood, C.A., Khan, J., Farid, U., Ullah, Z. (2018). A survey on electric vehicle transportation within smart grid system. Renewable and Sustainable Energy Reviews, 81: 1329-1349. https://doi.org/10.1016/j.rser.2017.05.092
[47] Gulino, M.S., Laschi, M., Zonfrillo, G., Fabbri, M., Garcia, E., Miklis, P., Vangi, D. (2024). Development of an innovative microvehicle for urban mobility. Open Research Europe, 4: 190. https://doi.org/10.12688/openreseurope.18231.1
[48] Bamwesigye, D., Hlavackova, P. (2019). Analysis of sustainable transport for smart cities. Sustainability, 11(7): 2140. https://doi.org/10.3390/SU11072140
[49] Lelo, K., Chiaradia, F., Monni, S., Tomassi, F. (2024). 15-minute city: An attempt to measure proximity to urban services in Rome. https://doi.org/10.20944/preprints202409.1182.v1
[50] Modak, S., Sanyal, S. (2024). Road network structure of Varanasi city based on connectivity and spatial pattern. GeoJournal, 89(1): 25. https://doi.org/10.1007/s10708-024-11003-y
[51] Gülhan, G. (2023). Demand-oriented generation of urban parking policies. Online Journal of Art & Design, 11(5): 498-509.
[52] Zhuo, K., Qiu, Q., Zhang, Y., Li, F., Xu, L. (2024). Research on time-division multiplexing planning and design strategies for parking lots under the theory of compact cities. Landscape Architecture Frontiers, 12(2): 30-44. https://doi.org/10.15302/J-LAF-1-020093
[53] Hassine, S.B., Mraihi, R., Lachiheb, A., Kooli, E. (2022). Modelling parking type choice behavior. International Journal of Transportation Science and Technology, 11(3): 653-664. https://doi.org/10.1016/j.ijtst.2021.09.002
[54] Zhao, Z., Zhang, Y., Zhang, Y. (2020). A comparative study of parking occupancy prediction methods considering parking type and parking scale. Journal of Advanced Transportation, 2020(1): 5624586. https://doi.org/10.1155/2020/5624586.
[55] Terras, M.M., Jarrett, D., McGregor, S.A. (2021). The importance of accessible information in promoting the inclusion of people with an intellectual disability. Disabilities, 1(3): 132-150. https://doi.org/10.3390/disabilities1030011
[56] Benjamin, S., Bottone, E., Lee, M. (2021). Beyond accessibility: Exploring the representation of people with disabilities in tourism promotional materials. Journal of Sustainable Tourism, 29(2-3): 295-313. https://doi.org/10.1080/09669582.2020.1755295
[57] Al-Assadi, K.H.F., Al Kaabi, A.A. (2024). Geomorphological changes of the terrestrial features of the Euphrates River between the cities of Al-Kifl and Al-Mishkhab using geographic information systems (GIS). Natural and Engineering Sciences, 9(2): 347-358. https://doi.org/10.28978/nesciences.1574446
[58] Al-Jaberi, A.A., Al-Khafaji, A.S., Ivankina, N.A., Al-Sawafi, M.H. (2019). The idea of pedestrian pockets as a key for successful transit-oriented development for Najaf city-Republic of Iraq. IOP Conference Series: Materials Science and Engineering, 698(3): 033029. https://doi.org/10.1088/1757-899X/698/3/033029
[59] Khaleq, A., Lami, A.L., Sami Mehdi, S., Ali, A.L. (2020). Understanding architectural heritage complexity: The case of developing an HBIM for the tomb complex of ‘Prophet Ezekiel-Al Kifl’ in Iraq. Connections: Exploring Heritage, Architecture, Cities, Art, Media.
[60] Mahmood, T.M. (2023). The role of religious architecture in increasing tourist attraction: A study of a sample of visitors to the shrine of Dhu Al-Kif. Czech Journal of Multidisciplinary Innovations, 24: 92-108. https://doi.org/10.5281/zenodo.10650460
[61] Abed, G.A., Manii, J.K., Ali, J.H. (2022). Some engineering properties of ancient fire clay bricks discovered at the Dilbat Archaeological Site, South of Hilla City. Iraqi Geological Journal, 55(1B): 121-130. https://doi.org/10.46717/igj.55.1B.12Ms-2022-02-28
[62] Mohammed, M.K., Rashid, M.H. (2020). Measurement of radon concentration in random samples from liquefaction water network in Al-Kifl district of Babylon/Iraq. NeuroQuantology, 18(7): 45-48. https://doi.org/10.14704/nq.2020.18.7.NQ20191
[63] Stillman, N.A. (2024). Ezekiel’s Tomb (al-Kifl). Brill, Leiden, The Netherlands. https://doi.org/10.1163/1878-9781_ejiw_SIM_0007520