Hamdi*![]() | Sirojuzilam Hasyim
| Sirojuzilam Hasyim![]() | M. Syafii
| M. Syafii![]() | Ahmad Albar Tanjung
| Ahmad Albar Tanjung![]()
© 2024 The authors. This article is published by IIETA and is licensed under the CC BY 4.0 license (http://creativecommons.org/licenses/by/4.0/).
OPEN ACCESS
This study aims to evaluate the effect of economic growth, imports and exports on food inflation in four ASEAN countries, namely Timor Leste, Laos, Cambodia and Myanmar, over the period 2003 to 2024. This study fills a gap in the literature that rarely explores the simultaneous interaction between these variables in the context of food inflation in ASEAN countries with high inflation rates. The method used in this study is panel data analysis with Fixed Effect model. This model was chosen after a series of statistical tests, including the Chow test and Hausman test, which showed that the Fixed Effect model is more suitable for handling cross-country variation and overcoming potential heteroscedasticity and multicollinearity problems. The results show that economic growth has a significant negative effect on food inflation, while import and export variables show no statistically significant effect. These findings highlight the importance of policies that support domestic economic growth as a way to control food inflation. The main contribution of this study is the provision of new insights into how macroeconomic factors such as economic growth, imports and exports affect food inflation in ASEAN countries. The results are expected to serve as a reference for policymakers in formulating more effective economic strategies to address food inflation challenges in the region.
food inflation, economic growth, exports, imports
Economic challenges are important issues faced by all countries. An emerging economic challenge is the problem of inflation. ASEAN countries, particularly Timor Leste, Laos, Cambodia and Myanmar, face significant food inflation problems. This problem has the potential to have a severe impact on the economies and welfare of individuals in the region. Macroeconomic variables, such as the rate of economic expansion, import and export volumes, have a large impact on food inflation in these countries. Therefore, understanding the correlation between these elements and food inflation is crucial for formulating effective inflation control policies and tactics in each region. Fan et al. [1] conducted a study on the impact of the COVID-19 pandemic on food production, trade and distribution in ASEAN. Data and information were gathered for the study from five ASEAN nations, namely Indonesia, Malaysia, the Philippines, Thailand, and Vietnam. The results of this study indicate that the COVID-19 epidemic has had a significant effect on the production, commerce, and distribution of food in ASEAN. The implementation of social distancing and lockdowns by ASEAN member states has led to a decrease in food demand and created volatility in the food market.
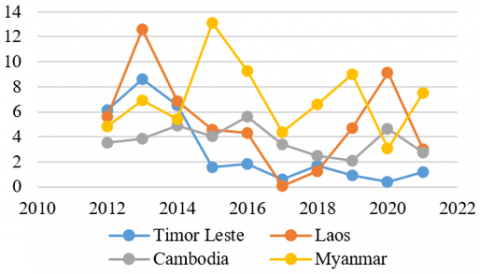
Food inflation rates (Figure 1) in ASEAN countries, particularly Timor Leste, Laos, Cambodia and Myanmar, have fluctuated. Below is data on food inflation in four Southeast Asian countries, specifically Timor Leste, Laos, Cambodia and Myanmar, covering the period 2012 to 2021. Food inflation is measured by the annual percentage increase in the average cost of food.
Figure 1. Food inflation rates for Timor Leste, Laos, Cambodia and Myanmar
In many nations, especially in developing countries where a substantial section of the population relies on agriculture for their livelihoods and food security, food inflation is a major economic burden. In Southeast Asia, Timor Leste, Laos, Cambodia, and Burma currently have the steepest rises in the cost of food. A variety of internal and external issues contribute to high food inflation there, such as uneven domestic economic expansion, reliance on imported nourishment, and fluctuations in worldwide commodity pricing. Places with severe food price growth risk economic unpredictability, deeper impoverishment, and greater food shortage, particularly affecting those with few resources who struggle as staple goods become costlier [2].
This data shows that each country has a different pattern of food inflation. The food inflation rate in Timor Leste experienced a spike of 8.60% in 2013 but then settled at a level below 2% until 2020. The cause of food inflation in Timor Leste is that Timor Leste's infrastructure, including roads and transportation, is still inadequate, hindering efficient food distribution from production areas to consumption areas. This can lead to disruptions in food production and food availability in the market. Timor Leste has limited food production capacity, relying mainly on the subsistence agriculture sector. Rising food demand and dependence on food imports have led to very high food prices, making it unaffordable for the poor.
In 2013, Laos experienced a 12.60% spike in food inflation. In subsequent years, there were variations, but in 2020 and 2021, there was a substantial increase once again. Laos continues to experience difficulties in ensuring sufficient food accessibility for the entire population, especially in rural areas that are difficult to access through transportation and food distribution networks. The occurrence of natural disasters such as floods, droughts and prolonged periods of drought can adversely affect agricultural yields, leading to a spike in food costs.
Food inflation in Cambodia has remained generally stable, consistently below 5% over the years, with a slight increase in 2016. The agricultural sector in Cambodia continues to be burdened by issues such as poverty, unpredictable weather conditions, reliance on outdated technology, and high fuel costs. Given the importance of the agricultural industry, any increase in food prices can have a significant impact on the daily lives of Cambodians, especially those who depend on agriculture for their income.
Food inflation in Myanmar shows a mixed trend, with a high spike of 13.09% in 2015, followed by a period of stabilization below 10%. Climate change, dependence on food imports, and inadequate infrastructure are some of the main reasons contributing to food inflation in Myanmar. In addition, the ongoing political and social crisis in Myanmar has the potential to worsen the food situation and availability for the people of Myanmar.
Food inflation has become a pressing global problem, spurring policymakers and academics to investigate its root causes. Several analyses have underscored various influencers of rising food costs, such as fluctuating international commodity rates, fiscal and monetary maneuvers, and climate change disrupting harvests [3]. Given the intricate interplay of factors, more scrutiny is required of economic expansion's impact, trade flows, and food inflation in especially susceptible ASEAN nations. Specifically, the importing and exporting dynamics of the most afflicted countries in the Association of Southeast Asian Nations region deserve concentrated inspection.
A major problem faced by ASEAN countries such as Timor Leste, Laos, Cambodia and Myanmar is how to manage the growing food inflation. Uneven economic growth in the region has led to economic instability that affects food prices. In addition, the high dependence on food imports makes these countries vulnerable to price fluctuations in the global market. When international food prices increase, these countries are often unable to keep up with domestic demand, which in turn drives food inflation [4].
In order to achieve the objective, the proper policies that are aimed at economic diversification as well as local food production to improve food security at the domestic level have been proposed by food security experts. Notwithstanding this, the implementation of these policies entails meticulous programming as well as efficient coordination of the government together with the private sector. Besides, other efforts include strengthening fiscal and monetary policies that can control food inflation as well as reducing dependence on food imports from countries that are experiencing conflict or production problems [2]. The scientific literature also cites several approaches to food inflation. An analogous rise is also likely to occur in domestic food prices if the price of food commodities in the global market goes up by one percent, especially in import-dependent countries. As a specific solution proposed, food security can be enhanced through the adoption of sustainable agricultural practices that will minimize reliance on global markets. In this study, we encourage the adoption of agricultural technology and innovation to achieve productivity improvement and food price stability.
In addition, research by Saleem et al. [3] analyzing the factors influencing inflation in Pakistan proves that economic stability can be achieved through proper fiscal policy management and also through controlling monetary variables such as interest rates. This study provides an important message that the right monetary policy can be used as an effective instrument for controlling food inflation even in developing countries. A recent study by Samal et al. [2] also points out the effect of climate change on food production which can cause the price to be increased. Hence, they suggest that more proactive policies to mitigate climate change and investment in agricultural technologies that are more resilient to extreme climatic conditions would be the solutions to reduce the negative impact of climate change on food inflation.
There have been numerous studies aimed at understanding the various factors affecting food inflation, yet there is a void in the existing literature regarding the simultaneous interaction of economic growth, imports and exports in influencing food inflation in ASEAN countries. Typically, research targets one or two components only, neglecting the interconnections between those variables as a whole. The studies by Saleem et al. [3] do provide insights that are relevant, but they do not address the question of whether three variables interact simultaneously in an ASEAN context experiencing high food inflation.
In addition, Research by Samal et al. [2] has highlighted the significance of external factors like climate change and global market dynamics, but the lack of in-depth examination of how different economies react to food inflation has identified the gap that needs to be filled. The existing literature does not address the fact that the countries in this study, namely Timor Leste, Laos, Cambodia, and Myanmar, are structurally different and have unique economic and social characteristics.
This study aims to examine the effect of economic growth, imports and exports on food inflation in the four ASEAN countries with the highest food inflation rates, namely Timor Leste, Laos, Cambodia and Myanmar, over the period 2003 to 2024. This study seeks to make a new contribution to the literature by analyzing the simultaneous interaction between the three variables, something that has not been explored much in the context of ASEAN countries.
The novelty of this study lies in its comprehensive approach to identifying the determinants of food inflation in countries with different economic characteristics. As such, the results of this study are expected to provide deeper insights for policy makers in designing effective strategies to control food inflation and strengthen national food security. The scope of this study covers panel data analysis for the period 2003 to 2024, focusing on key macroeconomic variables affecting food inflation in four selected ASEAN countries.
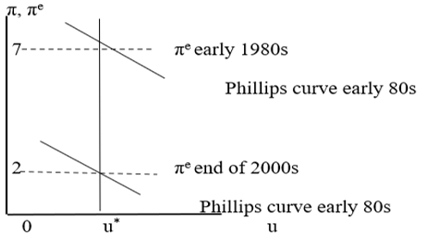
The Phillips Curve Theory presents an essential concept in macroeconomics that helps in understanding the inverse relationship between inflation and the rate of unemployment. Since it was first proposed by A.W. Phillips in 1958, The central bank policy across the world has been one of the most significant tools in economic policy analysis. This relationship suggests that when the unemployment rate decreases, inflation tends to increase, and vice versa. The underlying premise is that a reduction in unemployment would enhance individuals' buying power, therefore stimulating the demand for commodities and services, hence resulting in an upward pressure on prices or inflation. Specifically, when the unemployment rate is low, inflation tends to be high, and vice versa. However, over time, there is no lasting compromise between inflation and unemployment, so only inflation will have a substantial effect. In 1958, A. W. Phillips conducted a study using data from the UK from 1861 to 1957. His analysis led to the basic findings that are now referred to as the original Phillips curve (Figure 2).
Figure 2. Phillips curve
When aggregate demand increases, the economy shifts towards the upper left on the short-run Phillips curve, resulting in an increase in inflation (π). If inflation continues, inflation expectations (πe) and the Phillips curve will also increase. Various economic theories have tried to determine the main variables responsible for food inflation in several countries. Food inflation exacerbates the financial difficulties of individuals with limited income.
Du et al. [5] conducted a study on the correlation between oil price fluctuations and food inflation. This study used weekly time series data from 1998 to 2009. The stochastic volatility model was used in this study to analyze the weekly prices of crude oil, corn, and wheat. In his 2015 study on the impact of food prices on food inflation in India, Sasmal [6] discovered a clear statistical correlation between food costs and food inflation. More precisely, increased food costs result in elevated food inflation rates in India.
Ofori et al. [7] conducted a study in Ghana which showed that money supply has an important and favorable impact on inflation in Ghana. Inflation in Ghana is significantly influenced by the rate of increase in the money supply, both in the short and long term. Inflation is significantly influenced by the money supply. The findings indicate that it is imperative for policymakers to preserve the central bank's independence in order to mitigate the influence of the money supply on inflation.
Monfared and Akin [8] in their study in Iran demonstrated a close relationship between exchange rates and inflation. The prevailing price of foreign currencies is one of the major factors determining the inflation rate in the Iranian economy. The study emphasizes the relevance of no more to be transparent in implementing the foreign exchange policy. Thus, a stable inflationary expectation will be maintained, and the exchange rate will avoid excessive fluctuations. The central bank can do this by adopting a more conservative policy towards the exchange rate while at the same time ensuring that both inflation and the exchange rate are considered. It is of great importance not to let the money supply grow excessively when regulating it since this phenomenon is one of the main inflationary causes if we want to avoid economic decline.
In their article "Factors", Kuma and Gata [9] discussed the situation of the increasing cost of living in Ethiopia and reviewed the different factors that bring it about. The determinants of food price inflation in Ethiopia were examined using a panel data regression model and monthly data from 2006 to 2019. The results indicate that food price inflation in Ethiopia is affected by different variables such as the world prices rise, the local currency depreciation, the increase in demand, and the decrease in domestic production.
The theory of the Phillips Curve in sustainable development requires a wider scope in its interpretation. Sustainable development is a concept that needs to be not only economic growth but also the welfare of society and the environment. In fact, high inflation can be a major contributor to the undermining of economic stability which is indispensable for sustainable development. Food inflation, in particular, can strike at the heart of people's lives.
The application of the Phillips Curve theory to food inflation necessitates a clear understanding of how inflationary expectations are influencing the current inflation rate. Through different channels, the anchored inflation expectations are often affected, sometimes even by food prices, which is the largest part of the household budget, especially in the developing countries [10]. A sudden spike in food prices can generate inflation expectations in the future leading to an inflationary spiral that is more difficult to tame.
Besides, the key to successful sustainable development is the stability of food prices. The issue is not just the social cost but also the general economic stability. Thus, regulations aimed at inflation must take into account the influence of food prices, particularly in countries that are predisposed to fluctuations in global food prices.
2.1 Impact of economic growth on food inflation
It is common for economic growth to be perceived as a rise in people's purchasing power, which can be a driving force for the increases in food products' demand. People are likely to devote the extra income to boosting their food consumption, both in terms of quantity and quality. It is most obvious in the developing countries, where the rapid economic growth is usually followed by a great rise in food consumption [11, 12].
On the other hand, economic growth does not always have the same positive effect on food inflation. Growth may push inflation over the limit, a point where it becomes harmful. Research has shown that inflation over some threshold can be a brake on economic growth [13, 14]. For instance, if food inflation climbs above 4%, it may then be a drag on overall economic growth, and hence, consumer purchasing power will cut down, and consumption levels will fall.
In addition, food price volatility can destabilize the economy and hinder long-term economic growth. Sharp price fluctuations can make it difficult for producers and consumers to plan long-term production and consumption, which in turn can lead to inefficiencies in resource allocation [15]. This shows the importance of food price stability in supporting sustainable economic growth.
2.2 Impact of imports on food inflation
Food imports play an indispensable role in dictating domestic food inflation rates for many nations, predominantly developing countries heavily reliant on imports to satisfy nutritional demands. If worldwide agricultural commodity pricing escalates, food importing countries frequently endure striking upticks in homegrown victual valuations. This phenomenon whereby transnational market fluctuations directly impact internal market valuations has been termed the pass-through effect. While self-sufficient states witness more tempered domestic nourishment cost increases following worldwide price surges, import-dependent realms absorb global changes with amplified domestic repercussions [16].
In addition to global prices, While the exchange rate between domestic and foreign currencies influences food price inflation significantly, the relationship is complex. A weakening local money means imported foods become costlier for buyers. Traders pass on these increased costs at markets and shops. Research on Nigeria, a location reliant on buying nourishment from abroad, demonstrates exchange rate disturbances can lengthen food inflation over the long haul. However, the link is not definitive. For example, a short-lived currency slide may have minimal impact if stockpiles are ample. Meanwhile, versatile harvests lessen dependence on imports and their price changes overseas. The degree and permanence of exchange rate fluctuations together with supply factors shape their effect on what consumers pay [17].
On the other hand, high dependence on food imports makes countries vulnerable to global price fluctuations and exchange rate volatility. Countries that do not have adequate domestic food production often have to face high food inflation when there is a rise in global prices or depreciation of the domestic currency. This shows the importance of diversifying food sources and strengthening domestic food production to reduce dependence on imports and stabilize domestic food prices.
2.3 Impact of exports on food inflation
Exports of food products significantly impact food inflation in nations with sizable farming. Increasing a country's exports of edibles potentially decreases domestic supply, thereby potentially increasing local market food prices. For instance, studies in Pakistan reveal how substantial food exports could result in native food inflation, particularly if the home supply inadequately fulfills internal needs. Likewise, other grain-prolific countries exporting much maize risked citizens consuming less as more shipments sailed, with domestic bounties swaying harder to purchase. Simultaneously, importing nations gained economic benefits from the shiploads of affordable nourishment, feeding more populous at cheaper tariffs [18].
In addition, exchange rate policies are a double-edged sword with regard to food inflation. Devaluations of the domestic currency can make exports more competitive abroad, potentially driving up volumes shipped overseas. However, currency weakness also renders imports more costly. As a result, food prices within the country are prone to rise sharply. Studies from Uganda reveal that fluctuations in exchange rates frequently produce sizable swings in the cost of sustenance, chiefly by altering the expense of imported nutritional provisions. Furthermore, governments often face dilemmas around regulating food exports, especially amid high prices. Some administrations opt to curb shipments abroad to ensure sufficient national supply and tame costs. But export constraints risk decreasing earnings for farmers and industry, in addition to diminishing the international competitiveness of a nation's edible exports [19].
2.4 Application of Phillips curve in economic policy
In applying the Phillips Curve theory to economic policy, particularly in relation to food inflation, policymakers must consider various interrelated factors. Economic stability and control of inflation cannot be achieved by focusing only on the unemployment rate. Food inflation, as one of the main components of headline inflation, must be controlled through policies that include import, export and exchange rate management [20, 21].
Controlling food inflation requires a comprehensive approach that includes increasing domestic food production, diversifying food sources, and a stable exchange rate policy. For example, to mitigate the negative impact of global food price fluctuations, the government can increase domestic food production and strengthen national food security, making it less dependent on imports [17, 18]. In addition, social protection for vulnerable groups is also important to mitigate the negative impact of food inflation on people's welfare, especially in the context of developing countries [11, 15].
In the long run, applying the Phillips Curve theory in the context of sustainable development requires policies that not only focus on controlling inflation and unemployment, but also consider food security, social welfare, and environmental sustainability [7, 22]. Only with a holistic approach can economic policy support sustainable and inclusive growth, which benefits the entire society.
Economic stability achieved through controlling inflation and unemployment must be combined with strategies that promote sustainable development. This includes ensuring that economic policies support food security and reduce social inequality [20, 23]. Thus, the application of the Phillips Curve theory is not only relevant in macroeconomic policymaking but also in designing broader and sustainable development policies.
This study uses annual secondary panel data from 2003 to 2021 to analyze inflation, economic growth, imports, and exports in ASEAN countries. The data used is sourced from the World Bank (https://data.worldbank.org) The objects of the data used are four countries in the ASEAN region with the highest food inflation values, namely Timor Leste, Laos, Cambodia, and Myanmar. We chose these four countries as objects in this study because they are countries with the highest inflation rates during the study period and these four countries are included in the group of low to middle income countries in ASEAN. These nations have a substantial population that may be included in the analysis of food inflation, which directly affects the well-being of individuals, particularly those with humble income. The data analysis used is panel data regression with a fixed effects model conducted with the help of eViews. The selection of the fixed effects estimation model is based on the provisions of the model test to be carried out, namely the Chow test and the Hausman test and to avoid parameter estimates being biased and inconsistent, by controlling for variables that remain constant in time but differ between individuals [24].
The next model used in this investigation is as follows:
INF = β0 + β1PEit + β2IMPit + β4EXPit + uit
INF denotes inflation, PE denotes economic growth, IMP denotes imports, while EXP serves as a representation of exports. The variables used in this study are as follows: the independent variable (Y) represents food inflation in percentage, while the dependent variable (X) represents economic growth (in US dollars), imports (in US dollars), and exports (in US dollars). The underlying assumption of this study is that there exists a substantial impact, either individually or collectively, of the independent variables on the degree of food inflation in the four countries under investigation.
4.1 Model selection test
4.1.1 Chow test results
Table 1 shows the results of the Chow test applied to the regression model used in this study. The Chow test aims to identify any structural changes in the regression model estimated based on data divided into segments. Based on the test results, the value of the cross-section chi-square statistic is 30.159061 with a probability of 0.0000. This probability value is smaller than the significance level of 0.05, indicating that the null hypothesis, which states that there is no significant difference between the regression coefficients among the data segments, can be rejected. Therefore, this result supports the use of the Fixed Effects Model in the subsequent analysis.
Table 1. Chow test
|
Effects Test |
Statistic |
d.f. |
Prob. |
|
Cross-section F |
11.203363 |
(3,69) |
0.00000 |
|
Cross-section Chi-square |
30.159061 |
3 |
0.00000 |
This finding corroborates literature emphasizing the Chow test's importance in detecting structural variations between regression models segmented from data, especially when divided nonuniformly [25, 26]. While the Chow test illuminated the necessity of employing a Fixed Effects Model for this research, signifying the regression coefficients vary among the analyzed data subsets, Binkley and Young [27] would likely agree that disturbances spanning classifications or intervals can influence predictor variable impact. This panel examination exposed divergent coefficient behavior crosswise the divisions, highlighting the desirability of segment-particular parameter estimates. Their perspective regards the Chow test as a worthwhile instrument for evaluating coefficient persistency across sets or eras.
In addition, the adaptation of the Chow test for use with cross-sectional time series data, as applied in this research, confirms the relevance of this approach when examining intricate and diverse information [28]. The results of this study are also in line with the findings of Kennedy et al. [29] which structural variations can be uncovered utilizing the Chow evaluation to recognize alterations in financial interactions between factors throughout a time period. This is particularly important within the circumstance of macroeconomic examination among the nations of Southeast Asia, which contain differing economic profiles and whose relationships have evolved over decades. The findings align with prior studies demonstrating the Chow test's capabilities for detecting changes in economic linkages between metrics over the long term.
4.1.2 Hausman test results
In panel data analysis, Table 2 presents the outcomes of the Hausman test used to ascertain the most suitable regression model between the Fixed Effect Model and the Random Effect Model. The Hausman test results show a chi-square statistical value of 33.610089 with a probability of 0.0000, which is smaller than the significance level of 0.05. The present findings lead to the rejection of the null hypothesis that the Random Effect Model is the suitable model. Hence, these results suggest that the Fixed Effect Model is the most suitable model for further investigation.
Table 2. Hausman test
|
Correlated Random Effects - Hausman Test |
|||
|
Equation: RE |
|
|
|
|
Test cross-section random effects |
|||
|
Test Summary |
Chi-Sq. Statistic |
Chi-Sq. d.f. |
Prob. |
|
Cross-section random |
33.610089 |
3 |
0.00000 |
While the results of the Hausman specification test confirmed previous findings that a fixed effects model best addresses endogeneity concerns inherent in panel data, we nevertheless examined the random effects model due to the advantages of its efficiency. However, the test soundly rejected the random effects specification in favor of its fixed counterpart, evidencing the degree to which the independent variables correlate with hard-to-observe participant-level effects [30, 31]. This correlation introduces bias and inconsistency if left unchecked, as the random effects model is designed. In summary, the test outcome agrees with the economic theory that a fixed effects approach more rigorously accounts for potential endogeneity and thus generates more reliable estimates in this particular context [32].
In various studies, such as those conducted by Soo and Elliott [33] and Al-Nsour [34], the Hausman test has proven pivotal in validating model choice, notably for panel data analysis. While the Fixed Effects Model, corroborated through the Hausman test herein, facilitated a more nuanced inspection of independent variable impacts on dependents. By accounting for individualized cross-sectional variances, more dependable and legitimate parameter appraisals emerge within ASEAN's economic evaluations. Nevertheless, the test's utility remains bounded, as peripheral idiosyncrasies can impact outcomes. A critical gaze considers predictive values alongside contextual contingencies and variabilities unexplained. Overall, the technique helps but does not solve the challenge of extracting precision from unpredictable dynamic systems.
4.1.3 Fixed effect model
Based on the model selection test, the best model that can be used in this study is the Fix Effect Model. Then the estimation results are obtained as presented in Table 3.
Table 3. Fixed effect model
|
Variable |
Coefficient |
Std.Error |
t-Statistic |
Prob. |
|
C |
30.37902 |
24.47696 |
1.241127 |
0.2188 |
|
PE |
-2.52E-10 |
7.65E-11 |
-3.296135 |
0.0016 |
|
IMP |
2.57E-14 |
4.96E-14 |
0.518294 |
0.6059 |
|
EXP |
-2.065067 |
2.76E+00 |
-0.749007 |
0.4564 |
|
R-squared |
0.365686 |
|||
|
F-statistic |
6.62982 |
|||
|
Prob (F-statistic) |
0.000014 |
|||
The above results can form a linear equation as follows:
Y = 30.37902 - 2.52E-10*X1 + 2.57E-14*X2 - 2.065067*X3
Table 3 shows the estimation results of the Fixed Effect model used to analyze the relationship between economic growth (PE), imports (IMP), and exports (EXP) to food inflation in four ASEAN countries. Based on the estimation results, the Economic Growth (PE) variable shows a coefficient of -2.52E-10 with a probability value of 0.0016, which indicates a negative and significant relationship with food inflation. This means that a one percent increase in economic growth in these countries correlates with a decrease in food inflation by 2.52E-10. In addition, the Import variable (IMP) has a coefficient of 2.57E-14 and a positive relationship with food inflation, although it is not statistically significant with a probability value of 0.6059. Finally, the Export variable (EXP) shows a coefficient of -2.065067, indicating that an increase in exports can reduce food inflation, but with low significance (probability 0.4564).
The results of the Fixed Effect model show that economic growth has a significant negative impact on food inflation in ASEAN countries, in line with economic theory which states that increases in production capacity and economic efficiency can lower inflationary pressures [35]. This finding confirms the importance of economic stability in controlling food prices, as indicated by the significant negative coefficient of the economic growth variable (PE).
Imports play a complex role in domestic food inflation. While imports fulfill shortages and expand consumer choice, overreliance opens vulnerability. In times of global price swings, importing costs rise and inflation follows within. Meantime, self-sufficiency brings security yet limits variety. A balanced approach considers changing global dynamics and diversifies sources and domestic production. Managing tradeoffs requires nuanced policy sensitive to international flows and local needs alike [36].
On the other hand, while exports held a slight deflationary impact on food costs, the low statistical import of that relationship recommends trade projections narrowly targeted food stability. Indeed, amplifying food deliveries abroad may generate domestic surpluses to mollify price volatility, yet ASEAN nations examine such effects as inconsistent and faint. Therefore, these findings offer meaningful understanding: policies aiming to shift agricultural exports and imports demand judicious counterbalancing to realize steady, affordable sustenance. A well-regulated trade strategy could preserve competitive edge while safeguarding the food security of citizens home and abroad [37].
4.1.4 T-test results
Table 3 presents the estimation results of the Fixed Effect model used to analyze the effect of economic growth (PE), imports (IMP), and exports (EXP) on food inflation in four ASEAN countries. Based on the t-test results, the Economic Growth (PE) variable has a t-count of 3.296135, which exceeds the critical t-value of 1.99210, as well as a significance value of 0.0016, which is smaller than the 0.05 threshold. This indicates that PE has a statistically significant influence on food inflation. In contrast, the Import variable (IMP) with a t-count of 0.518294 and a probability value of 0.6059, and the Export variable (EXP) with a t-count of 0.749007 and a probability value of 0.4564, do not show a significant influence on food inflation in these ASEAN countries.
Economic growth has a statistically significant relationship with inflation according to the t-test results for the variable representing economic performance. This aligns with the theoretical perspective that productivity gains stemming from development can help curb price pressures in the agricultural sector [38]. The negative relationship between the PE factor and food costs implies higher growth is linked to lesser inflation, backing the strategic value of prioritizing balanced expansion over the long haul. Such an approach can facilitate inflation control in emerging settings where strengthening output frequently relieves supply-side constraints on necessities.
While the t-test uncovers that Import and Export have no noteworthy impact on nourishment expansion, the relationship between worldwide exchange and expansion is substantially more complex. The impacts of imports and fares on sustenance costs might be weakened by outside elements outside of this model, like worldwide value changes and household strategies. Then again, homegrown elements, for example, financial approach choices could influence how worldwide exchange streams filter into family unit spending plans [39]. By considering plenty of outside and inward components simultaneously, financial specialists can build up a more total comprehension of how worldwide exchange joins with expansion over the long haul. The relationship between borders and swelling isn't direct but instead contingent upon an assortment of fluctuating factors, both remote and residential [40].
4.1.5 F test results
Table 3 presents the estimation results of the fixed effect model to measure the effect of economic growth (PE), imports (IMP), and exports (EXP) on food inflation in four ASEAN countries. The F-count value obtained is 6.62982, which is greater than the F-table value of 3.972. In addition, the resulting probability (significance) value is 0.000014, which is smaller than 0.05. This indicates that simultaneously, the variables of economic growth, imports, and exports have a significant influence on food inflation at the 95% confidence level.
The F-test results show that the regression model used is able to explain variations in food inflation significantly by considering the independent variables, namely economic growth, imports and exports. This is in line with statistical theory which states that if the F-count value exceeds the F-table and the probability value is smaller than the predetermined significance level, then the model is valid and the independent variables together have a significant relationship with the dependent variable [41].
However, it is important to note that although the F test shows the significance of the overall model, it does not explain the significance of each independent variable individually. Therefore, these results need to be complemented with a t-test analysis to evaluate the individual influence of each variable on food inflation. In addition, basic assumptions of the F test such as residual normality and homoscedasticity need to be observed to ensure the validity of the results obtained [41].
The next step is testing the validity of the model by using multicollinearity and heteroscedasticity tests on the fixed effect estimation model.
4.1.6 Heteroscedasticity test
Figure 3 displays the residual graph obtained from the regression model used in this study. Based on the residual graph, the blue line showing the residual value does not cross the specified extreme limits, which are 500 and -500. This indicates that the residual variance of the model is constant, which means that there are no symptoms of heteroscedasticity in the model used.
Figure 3. Residual graph
The results shown by the residual graph in Figure 3 support the assumption of homoscedasticity in the regression model used. Homoscedasticity refers to the condition where the variance of error terms or residuals is constant across levels of independent variables, which is an important assumption in classical linear regression analysis. The absence of heteroscedasticity in the model ensures that the parameter estimates obtained are efficient and the resulting statistical inference is valid [42, 43].
The literature suggests that when heteroscedasticity is present, the resulting standard errors in the regression model may become biased, which may ultimately affect the hypothesis test results and confidence intervals. Therefore, the detection and treatment of heteroscedasticity is an important step in regression analysis [44, 45]. In the context of this study, the absence of heteroscedasticity as indicated by the residual graph ensures that the model used meets the necessary regression assumptions so that the analysis results are reliable and interpretations can be made with a high degree of confidence [46].
4.1.7 Multicollinearity test
Table 4 displays the correlation matrix between the independent variables used in the regression model, namely economic growth (PE), imports (IMP), and exports (EXP). The correlation coefficient between PE and IMP is 0.240739, between PE and EXP is 0.662860, and between IMP and EXP is 0.619508. All these correlation coefficient values are below the threshold of 0.85, indicating that there is no high correlation between the independent variables.
Table 4. Correlation matrix between independent variables
|
PE |
IMP |
EXP |
|
|
PE |
1.000000 |
0.240739 |
0.662860 |
|
IMP |
0.240739 |
1.000000 |
0.619508 |
|
EXP |
0.662860 |
0.619508 |
1.000000 |
The results of this correlation analysis show that the regression model used is free from multicollinearity problems, where all correlation coefficients between independent variables are smaller than 0.85. Multicollinearity, if present, can cause inflation in the standard errors of the regression coefficients, which in turn makes it difficult to determine the individual effect of each predictor variable on the dependent variable [47]. Thus, these findings indicate that the regression model used can produce more accurate and valid parameter estimates.
The literature supports the use of a correlation matrix as an initial tool to detect multicollinearity in regression analysis. When the correlation coefficient between two independent variables exceeds 0.8 or 0.9, this is usually an indication of significant multicollinearity, which requires further treatment such as removal of one of the variables or application of techniques such as Principal Component Analysis (PCA) or regularization such as Ridge Regression [48, 49]. In the context of this study, the absence of multicollinearity ensures that the relationship between the independent and dependent variables can be analyzed without concerns of bias caused by high correlation between independent variables [46].
This study has analyzed the effect of economic growth, imports, and exports on food inflation in four ASEAN countries, namely Timor Leste, Laos, Cambodia, and Myanmar, using the Fixed Effect model. The results of the analysis show that economic growth has a significant negative effect on food inflation, while imports and exports show no significant effect. This finding confirms the importance of economic policies that focus on sustainable growth to control food inflation [35, 38].
While agricultural productivity and efficiency are crucial to mitigating food inflation, ASEAN governments should employ a holistic strategy. Strengthening local supply chains through improved infrastructure and expanded cooperation can curb fluctuations. At the same time, calibrating trade policies to balance international competitiveness with domestic stability is prudent. Rather than relying solely on imports or exports, a multi-pronged effort across different sectors would be better for economic growth and social welfare. No single measure can provide the ultimate panacea, but coordinated planning that addresses production, distribution and markets can jointly cushion the impact of inflation [36, 39].
This study has several limitations that need to be noted. First, the analysis is limited to four ASEAN countries with high food inflation rates, so the findings may not be generalizable to all ASEAN countries or other developing countries. Second, although the Fixed Effect model used has been proven to be effective in overcoming heteroscedasticity and multicollinearity [42, 46], it cannot capture the influence of time-invariant independent variables.
While the study provided useful initial insights, further examination across additional developing nations could help validate whether trends persist more broadly. Scholars may wish to explore dynamic interplays between macroeconomic shifts and culinary cost increases throughout Southeast Asia and beyond to strengthen understanding's generalizability. Alternative approaches too, such as time series analysis unconfined by fixed effects, promise deeper understanding of how economic variables like GDP connect to nutritional expense alterations. Overall, expanding perspective cross-nationally and modeling-wise may fortify comprehension of inflation's relationship with macro-level changes in crucial ways [40, 49]. Further research also needs to consider the impact of external factors such as climate change and global price volatility on food inflation, which are not fully covered in the current model [43].
This article is the result of doctoral dissertation research in 2023 entitled "Analysis of Determinants of Food Inflation in ASEAN Countries: PVAR Model Approach" with author: Prof. Dr. Lic.rer.reg. Sirojuzilam Hasyim SE, Co-Author 1: Dr. M. Syafii, SE, S.Pd.,M.Si, Co-Author 2: Dr. Ahmad Albar Tanjung, S.E., M.Si, Co-Author 3: Hamdi.
[1] Fan, S., Teng, P., Chew, P., Smith, G., Copeland, L. (2021). Food system resilience and COVID-19–Lessons from the Asian experience. Global Food Security, 28: 100501. https://doi.org/10.1016/j.gfs.2021.100501
[2] Samal, A., Ummalla, M., Goyari, P. (2022). The impact of macroeconomic factors on food price inflation: An evidence from India. Future Business Journal, 8: 15. https://doi.org/10.1186/s43093-022-00127-7
[3] Saleem, F., Haider, Z., Shoukat, S., Shafiq, S., Zahid, A., Shahzad, A., Hassan, W. (2013). Determinants of inflation in Pakistan. Interdisciplinary Journal of Contemporary Research in Business, 4(9): 245-252.
[4] Milton, F. (1956). The quantity theory of money: A restatement. In Milton Friedman “Studies in the Quantity Theory of Money” The University of Chicago Press, Chicago, USA.
[5] Du, X., Cindy, L.Y., Hayes, D.J. (2011). Speculation and volatility spillover in the crude oil and agricultural commodity markets: A Bayesian analysis. Energy Economics, 33(3): 497-503. https://doi.org/10.1016/j.eneco.2010.12.015
[6] Sasmal, J. (2015). Food price inflation in India: The growing economy with sluggish agriculture. Journal of Economics, Finance and Administrative Science, 20(38): 30-40. https://doi.org/10.1016/j.jefas.2015.01.005
[7] Ofori, C.F., Danquah, B.A., Zhang, X. (2017). The impact of money supply on inflation, a case of Ghana. Imperial Journal of Interdisciplinary Research, 3(1): 2312-2318.
[8] Monfared, S., Akin, F. (2017). The relationship between exchage rates and inflation: The case of Iran. European Journal of Sustainable Development, 6(4): 329. https://doi.org/10.14207/ejsd.2017.v6n4p329
[9] Kuma, B., Gata, G. (2023). Factors affecting food price inflation in Ethiopia: An autoregressive distributed lag approach. Journal of Agriculture and Food Research, 12: 100548. https://doi.org/10.1016/j.jafr.2023.100548
[10] Palley, T. (2012). The economics of the Phillips curve: Formation of inflation expectations versus incorporation of inflation expectations. Structural Change and Economic Dynamics, 23(3): 221-230. https://doi.org/10.1016/j.strueco.2012.02.003
[11] Nguyen, A.T. (2018). The relationship among economic growth, trade, unemployment, and inflation in south Asia: A vector autoregressive model approach. Asian Journal of Economics and Empirical Research, 5(2): 165-172. https://doi.org/10.20448/journal.501.2018.52.165.172
[12] AlKhazraji, Z. (2024). Analysis of causal and integrative relationship between inflation, terms of trade and food prices in Iraq for 2000-2021. Al Kut Journal of Economic and Administrative Sciences, 16(50): 637-656. https://doi.org/10.29124/kjeas.1650.31
[13] Runganga, R. (2020). Inflation and economic growth in Zimbabwe is there any inflation threshold level? International Journal of Applied Economics Finance and Accounting, 8(1): 1-10. https://doi.org/10.33094/8.2017.2020.81.1.10
[14] Hossin, M.S. (2015). The relationship between inflation and economic growth of Bangladesh: An empirical analysis from 1961 to 2013. International Journal of Economics Finance and Management Sciences, 3(5): 426-434. https://doi.org/10.11648/j.ijefm.20150305.13
[15] Mustafa, A.M.M., Sivarajasingham, S. (2019). Dynamic linkages between food inflation and its volatility: Evidence from Sri Lanka economy. Journal of Asian Finance Economics and Business, 6(4): 139-145. https://doi.org/10.13106/jafeb.2019.vol6.no4.139
[16] Furceri, D., Loungani, P., Simon, J., Wächter, S. (2016). Global food prices and domestic inflation: Some cross-country evidence. Oxford Economic Papers, 68(3): 665-687. https://doi.org/10.1093/oep/gpw016
[17] Lawrence, A.O. (2023). Impact of monetary policy on disaggregate inflation in Nigeria: A structural var approach. International Journal of Multidisciplinary Research and Growth Evaluation, 4(5): 139-149. https://doi.org/10.54660/.ijmrge.2023.4.5.139-149
[18] Afzal, M., Mian, S. (2020). Determinants of food inflation in Pakistan: Empirical evidences. Proceedings, 36(1): 104. https://doi.org/10.3390/proceedings2019036104
[19] Sachitra, V., Padmini, C. (2021). COVID-19 challenging period and agriculture sector in Sri Lanka: Way to lead. Asian Journal of Advances in Agricultural Research, 15(4): 21-34. https://doi.org/10.9734/ajaar/2021/v15i430160
[20] Murphy, A. (2018). The death of the Phillips curve? Federal Reserve Bank of Dallas, Working Paper 1801. https://doi.org/10.24149/wp1801
[21] Paloviita, M. (2006). Inflation dynamics in the Euro area and the role of expectations. Empirical Economics, 31(4): 847-860. https://doi.org/10.1007/s00181-006-0057-6
[22] Adelakun, O, Ngalawa, H. (2020). The role of oil prices in Philips curve modeling and forecasting of inflation. Journal of Economic and Financial Sciences, 13(1): 499. https://doi.org/10.4102/jef.v13i1.499
[23] Simister, J. (2017). The Phillips curve and oil prices. International Research in Economics and Finance, 1(1): 62-71. https://doi.org/10.20849/iref.v1i1.272
[24] Mummolo, J., Peterson, E. (2018). Improving the interpretation of fixed effects regression results. Political Science Research and Methods, 6(4): 829-835. https://doi.org/10.1017/psrm.2017.44
[25] Sotirakopoulos, K., Barham, R., Piper, B., Nencini, L. (2015). A statistical method for assessing network stability using the Chow test. Environmental Science Processes & Impacts, 17(10): 1841-1850. https://doi.org/10.1039/c5em00325c
[26] Sánchez-Rivero, M., Martín, J.M., Rangel, M. (2020). Characterization of birdwatching demand using a logit approach: Comparative analysis of source markets (national vs. foreign). Animals, 10(6): 965. https://doi.org/10.3390/ani10060965
[27] Binkley, J.K., Young, J.S. (2023). The Chow test with time series-cross section data. Journal of Statistical and Econometric Methods, 12(1): 35-53. https://doi.org/10.47260/jsem/1213
[28] Weiler, S., Loomis, J., Richardson, R., Shwiff, S. (2002). Driving regional economic models with a statistical model: Hypothesis testing for economic impact analysis. Review of Regional Studies, 32(1): 97-111. https://doi.org/10.52324/001c.8442
[29] Kennedy, P., Schmitz, A., Linscombe, S., Zhang, F. (2022). The impact of cultivar development and cultural practices on Louisiana rice yield. Agrosystems Geosciences & Environment, 5(1): e20231. https://doi.org/10.1002/agg2.20231
[30] Ejrnæs, M., Holm, A. (2006). Comparing fixed effects and covariance structure estimators for panel data. Sociological Methods & Research, 35(1): 61-83. https://doi.org/10.1177/0049124106289109
[31] Parabak, N., Azis, M. (2021). The effect of leverage and asset prices on mutual fund risk in mutual fund companies in Indonesia. Journal of Management Small and Medium Enterprises (SMES): 14(3): 365-373. https://doi.org/10.35508/jom.v14i3.5607
[32] Guggenberger, P. (2009). The impact of a Hausman pretest on the asymptotic size of a hypothesis test. Econometric Theory, 26(2): 369-382. https://doi.org/10.1017/s0266466609100026
[33] Soo, K.T., Elliott, C. (2010). Does price matter? Overseas students in UK higher education. Economics of Education Review, 29(4): 553-565. https://doi.org/10.1016/j.econedurev.2009.10.016
[34] Al-Nsour, O. (2020). Ownership structure and dividend policy in Jordan. Finance and Business Economies Review, 4(3): 1-24. https://doi.org/10.58205/fber.v4i3.1560
[35] Allison, P.D. (2009). Fixed Effects Regression Models. Sage Publications.
[36] Crubaugh, B. (2020). Neighborhood development organizations and neighborhood disadvantage: Race, resources, and inequality in Chicago. Nonprofit and Voluntary Sector Quarterly, 50(1): 27-53. https://doi.org/10.1177/0899764020941928
[37] Li, J., Akaliyski, P., Schäfer, J., Kendall, G., Oddy, W., Stanley, F., Strazdins, L. (2017). Non-linear relationship between maternal work hours and child body weight: Evidence from the western Australian pregnancy cohort (Raine) study. Social Science & Medicine, 186: 52-60. https://doi.org/10.1016/j.socscimed.2017.05.046
[38] Saragih, A., Supriana, T. (2023). Analysis of demand and supply of tomato (solanum lycopersicum l.) in North Sumatra province. International Journal of Research and Review, 10(3): 392-396. https://doi.org/10.52403/ijrr.20230346
[39] Mas'adah, M., Hanfan, A. (2022). Explore cross-selling, up-selling, and sales promotion to increase the sales volume of pt. Brebes branch pawnshop. In Proceedings of the 2nd International Conference on Social Science, Humanities, Education and Society Development (ICONS 2021), pp. 122-126. https://doi.org/10.2991/assehr.k.220101.019
[40] Nasution, R.A.N., Saragih, I.S. (2023). The influence of self-efficacy and organizational climate on employee performance. Enrichment Journal of Management, 13(1): 127-134. https://doi.org/10.35335/enrichment.v13i1.1204
[41] Jamshidian, M., Jennrich, R., Liu, W. (2007). A study of partial F tests for multiple linear regression models. Computational Statistics & Data Analysis, 51(12): 6269-6284. https://doi.org/10.1016/j.csda.2007.01.015
[42] Hayes, A., Cai, L. (2007). Using heteroskedasticity-consistent standard error estimators in OLS regression: An introduction and software implementation. Behavior Research Methods, 39(4): 709-722. https://doi.org/10.3758/bf03192961
[43] Santo, C.A. (2007). Beyond the economic catalyst debate: Can public consumption benefits justify a municipal stadium investment? Journal of Urban Affairs, 29(5): 455-479. https://doi.org/10.1111/j.1467-9906.2007.00360.x
[44] Linh, H.T.D., Linh, T.N. (2023). Impacts of globalisation on economic growth in Europe Union countries. Ho Chi Minh City Open University Journal of Science-Economics and Business Administration, 13(1): 87-102. https://doi.org/10.46223/hcmcoujs.econ.en.13.1.2206.2023
[45] Naziri, D., Belton, B., Loison, S.A., Reardon, T., Shikuku, K.M., Kaguongo, W., Maina, K., Ogello, E., Obiero, K. (2023). COVID-19 disruptions and pivoting in SMES in the hidden middle of Kenya's potato and fish value chains. International Food and Agribusiness Management Review, 26(3): 409-434. https://doi.org/10.22434/ifamr2022.0120
[46] Napitupulu, R.B., Simanjuntak, T.P., Hutabarat, L., Damanik, H., Harianja, H., Sirait, R.T.M., Tobing, C.E.R.L. (2021). Penelitian Bisnis, Teknis dan Analisis Data Dengan SPSS-STATA-EVIEWS (1st ed.). Madenatera.
[47] Snani, H., Snani, H., Tannoubi, A., Chortane, O.G., Azaiez, F. (2024). Balance and deep connections: The impact of physical activity on body and sexual self-esteem, psychological distress, and marital satisfaction among adults. Frontiers in Sports and Active Living, 6: 1343951. https://doi.org/10.3389/fspor.2024.1343951
[48] Cieślik, M., Bekiranov, S. (2014). Combinatorial epigenetic patterns as quantitative predictors of chromatin biology. BMC Genomics, 15(1): 76. https://doi.org/10.1186/1471-2164-15-76
[49] Bo, Y., Song, C., Wang, J., Li, X. (2014). Using an autologistic regression model to identify spatial risk factors and spatial risk patterns of hand, foot and mouth disease (HFMD) in mainland China. BMC Public Health, 14(1): 358. https://doi.org/10.1186/1471-2458-14-358