Hikmah*![]() | Asrial
| Asrial![]() | Arifin Sanusi
| Arifin Sanusi![]()
© 2024 The authors. This article is published by IIETA and is licensed under the CC BY 4.0 license (http://creativecommons.org/licenses/by/4.0/).
OPEN ACCESS
Tourist satisfaction with facilities and cleanliness is the most critical component in tourism behaviour. These behaviours influence destination choices and product consumption, tourists' choices, and future decisions to revisit the destination. This research measures tourist satisfaction with facilities and cleanliness at Air Cina or Oesina Beach, Lifuleo Village, Kupang Regency, East Nusa Tenggara Province. The method used is quantitative descriptive to get an overview of the condition of tourist facilities and cleanliness at the research case location. This study's population were tourist visitors from March to September 2023. One hundred respondents were collected using an accidental sampling technique and the Rao method. Data was collected through questionnaires and documentation, while data analysis techniques used product moment tests, multiple regression and t-test hypothesis verification. Through surveys of visitors, this research reveals that although tourists are generally satisfied, several aspects still need improvement. The research results showed that the environmental cleanliness and tourist facilities of Air Cina were stated to be in moderate/fair condition by correspondents, respectively 62% and 84%. Data analysis shows that tourists are generally satisfied with the availability of facilities such as parking, toilets and food stalls. However, several aspects of cleanliness need more attention, such as waste management and cleanliness of the beach area. These findings highlight the importance of managing tourist destinations oriented towards customer satisfaction. The implication of this research is the need to improve the quality of facilities, especially in terms of cleanliness, and develop more effective waste management programs. These results provide important implications for developing sustainable tourism at Air Cina Tourism Beach.
environment, infrastructure, behavior, visitors
Air Cina Beach is one of the tourist attractions in Kupang district, which has sufficient potential to be managed and developed. This beach is located in Lifoleu village, West Kupang district. The white sand beach is a favorite tourist attraction as well as a mainstay tourist attraction, which is expected to increase the number of tourist visits, both domestic and foreign tourists. Some of the facilities owned by this beach tourist destination include a counter post, gazebo, toilet, kiosk, clean water, trash can, environmental road, boat (Sampan, in Indonesia), snorkeling equipment, lifejacket, underwater camera, walkie talkie, and electric generator, parking area. With this facility, it is hoped that tourists will feel comfortable and satisfied when visiting this tourist attraction. If the facilities are not maintained, it will disrupt the comfort and satisfaction of tourists.
In general, the development of Air Cina Beach as a tourist destination has excellent potential to contribute to several Sustainable Development Goals (SDGs), one of which is decent work and economic growth by creating new jobs for the surrounding community, both directly and indirectly. Then, cities and settlements can be made sustainable, where tourism can contribute to developing better infrastructure and improving local communities' quality of life. In addition, sustainable tourism development must pay attention to preserving biodiversity, terrestrial ecosystems, and underwater life, where responsible tourism management can encourage the preservation of marine ecosystems and other natural resources.
On the other hand, tourist satisfaction is a benchmark for improving the quality of tourism products to increase visits and form tourist loyalty. Generally, the level of satisfaction means the stage of consumer reaction to the services provided by the provider. According to González et al. [1], satisfaction is based on a person's background or experience compared to the service performance obtained. Meanwhile, overall tourist satisfaction includes many integrated service satisfaction processes as expressed by Kušen [2], including tourists' pre-experience and post-experience processes [3, 4].
In a competitive market economy, much attention has been paid to measuring consumer satisfaction [5-7]. In business, it is explicitly determined by customer satisfaction and thus will achieve customer loyalty. In service and facility provision, the company interacts with customers, and critical assessments can be made to build satisfaction and subsequent consequences [8, 9]. Empirical studies state that satisfaction is a pleasant and satisfying consumer response [10, 11]. When a particular product or service meets consumer expectations, satisfaction is achieved, and consumers retain the service. On the other hand, if the product quality fails to meet buyers' demands, dissatisfaction causes consumers not to buy or recommend the product further, resulting in business failure. Assessing customer satisfaction compared to product performance and customer feedback can help managers improve their service performance [12].
Likewise, the tourist aspect is also influenced by the satisfaction process. According to Yoon and Uysal [13], the most likely influence on tourist satisfaction is the existence of push and pull factors that influence tourists' emotions. The push factor is the desire to travel; the pull factor is the destination's attractiveness. The performance of these two factors cumulatively results in overall satisfaction and significantly impacts loyalty or word-of-mouth publicity with further confirmation of tourists revisiting the destination [14]. Furthermore, Oppermann [15] argues that tourists' intention to revisit a destination or recommend it to others is determined mainly by the extent of their loyalty. Tourists' positive evaluation of goods, services, and other facilities a destination provides can encourage repeat visits and increase recommendations (word of mouth) to other potential tourists.
For this reason, the white sand beach tourist attraction Air Cina offers tourist attractions, accessibility, facilities, and tourism support services. This tourist attraction will later become a benchmark for the level of tourist satisfaction during and after visiting the tourist attraction. In line with this, the satisfaction obtained by tourists will influence the development of coastal tourist attractions. When tourist satisfaction increases, it will automatically influence whether or not the tourism sector develops. Other factors determining tourist satisfaction can also be seen from several aspects, including transportation, accommodation, cleanliness, security, and shopping. Cleanliness is one of the factors of tourist satisfaction, and cleanliness adds to the beauty of tourist attractions. This cleanliness also triggers comfort when traveling. However, this cleanliness cannot be separated from the awareness of tourists who visit tourist destinations because the cleanliness at the Air Cina Beach tourist location has begun to be neglected. It can also be seen that there is plastic waste on the beach, which makes it look dirty.
On the other hand, developing the tourism sector effectively SDGs No. 8, creating inclusive and sustainable economic growth and increasing employment opportunities. SDG 8 is one of the 17 SDGs the United Nations (UN) set. The main goal of SDG No. 8 is to increase inclusive and sustainable economic growth and create productive and decent work opportunities for all. However, it is essential to remember that tourism development must be carried out sustainably and pay attention to social and environmental aspects. According to Kumar [16], sustainable tourism is a comprehensive approach to responsible tourism development that benefits local communities physically, economically, and socially. Therefore, sustainable tourism can be a tourism development tool supporting low-income people and the community. Tourism is one of the development options most people desire because of its benefits, which directly and indirectly contribute to increasing welfare [17].
Currently, some marketing research involves determining the constructs that cause when someone perceives a need. For example, searching for products to fulfill these needs [18], consuming products and services, and deciding to visit these destinations in the future [19]. Some literature includes contributions positively related to tourist satisfaction and repurchase intention [15, 20]. Many complex theoretical, statistical, and mathematical frameworks have been developed in the complex, dynamic, and multi-criteria-driven context of service quality research and construct measurement. Among them, the Norms model, which has been applied by Križaić [21], was developed by Woodruff et al. [22], and the consumer satisfaction/ dissatisfaction (CS/D) model by David and Wilton [23]. Apart from these theoretical models, various statistical methods are also used to deal with the problem of customer satisfaction evaluation, such as regression analysis, factor analysis, descriptive statistical analysis, probit-logit, and cluster analysis. In this regard, this paper aims to measure tourist satisfaction with beach destinations using descriptive statistical analysis. In this approach, tourist satisfaction is measured by perceptions of the tourist facility services offered and the level of cleanliness at beach tourism. Then, measure the simultaneous influence of independent and dependent variables on environmental cleanliness and tourist facilities on tourist satisfaction.
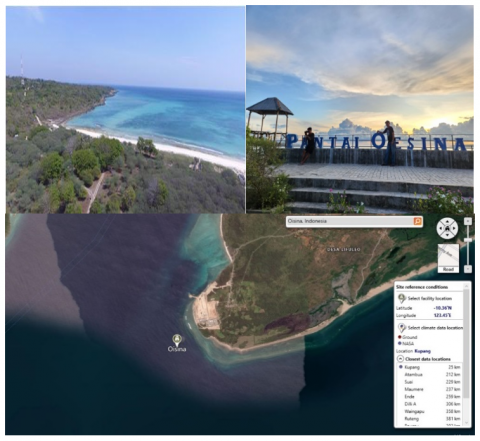
Air Cina Beach is located in the Sawu Sea Aquatic National Park (ANP), Lifuleo Village, Kupang Regency, East Nusa Tenggara Province, Indonesia. Geographically, Air Cina Beach is located at Latitude -10,350N and Longitude 123,460E, as seen in Figure 1. The distance from the center of Kupang City to Cina beach is ±45 km with a travel time of 1 hour. The name Air Cina Beach does not mean that its residents come from Cina, but because of its history for decades as a place for ships from Cina to dock. Air Cina Beach is also called Oesina Beach by local people. "Oe" means "water," and the word "sina" comes from the ancestors of the Nefo Village people who lived around the coast. Air Cina Beach offers beauty that is no less than other beaches in Kupang. The views are beautiful, the sea is blue, the sand is clean and slightly pink, with sufficient area for various tourist activities.
Figure 1. Map of air cina beach (Oesina beach)
Currently, Air Cina Beach has started to become a tourist destination for domestic tourists who want to enjoy beach tourism. In general, the activities usually carried out by visitors at this beach include swimming, fishing, boating/canoeing, grilling fish, playing in the sand, meeting and taking photos. The development of Air Cina Beach has been supported by the National Marine Conservation Area (NMCA or BKKPN, in Indonesia) in developing a marine ecotourism-based economy. In this case, BKKPN has focused on sustainable and collaborative management to ensure the sustainability of marine biodiversity, cultural values, and community welfare. Apart from that, the development of beach tourism facilities and infrastructure is also supported by The Nature Conservancy (TNC) and APPeK Workshop (local NGO).
In this regard, BKKPN Kupang allocated funds for assistance and the development of ecotourism in Lifuleo Village and the construction of marine tourism facilities and infrastructure in 2016. The same year, Lifuleo Village Pokdarwis received assistance with supporting tools for marine tourism management from the Directorate General of Marine Spatial Management of the Indonesian Ministry of Maritime Affairs and Fisheries. Visitors coming to Air Cina Beach have increased from July 2016 until now. The average number of visitors reaches 690 people/day and even more on holidays. This potential triggers the people of Lifuleo Village to start exploiting this potential.
3.1 Research methods
The choice of quantitative descriptive methods using various statistical tests will provide a clear and comprehensive picture of the level of tourist satisfaction with the facilities and cleanliness at Air Cina Beach Tourism. This method makes it possible to measure tourist satisfaction numerically, for example, using a Likert scale. That will provide more objective and accessible data to analyze than qualitative data. Quantitative data allows us to compare tourist satisfaction with various facilities and aspects of cleanliness. In addition, with a reasonably representative sample, the research results can be generalized to a broader tourist population. In this paper, several statistical tests are used that are commonly used in tourist satisfaction research, such as the t-test, F-test, correlation test and regression analysis. That is done with particular consideration for Air Cina Tourism Beach in the local context and taking into account unique factors, such as visitor characteristics, types of facilities available, and hygiene standards applicable in the area. In addition, facilities and cleanliness should be considered, as well as other variables that might influence satisfaction, such as accessibility, security, and entrance ticket prices.
The research was conducted from March to September 2023 at the Air Cina Beach tourist location. Research data was collected through survey and ex post facto methods using self-administered questionnaires and distributed to 100 tourists consisting of 53 women and 47 men. Based on age level, 71% of respondents were predominantly between 18-29 years old, followed by 20% aged 30-50 years, and the remaining 9% were over 51 years old. Most of the respondents had a senior high school (SHS) education, 59%, a bachelor's degree, 29%, and the fewest had junior high school and postgraduate education, namely 8% and 4%.
The population in this study are consumers who are visiting the Air Cina tourist beach. It is assumed that it is yet to be known precisely how many tourists visit this tourist spot daily. Based on regional origin, the data shows that the majority of tourists come from the city of Kupang-NTT (69%) and Kupang Regency ((29%); the rest come from outside NTT Province (2%). The characteristics of respondents based on type of work illustrate that tourist visitors to Cina's coast primarily have other types of work, such as traders, entrepreneurs, casual workers, homemakers, and other unemployed, as shown in Figure 2.
Figure 2. Profile of respondents based on occupation
The technique used is to provide respondents with a list of statements to fill in according to the answer choices available. The type of instrument regarding tourist satisfaction, environmental cleanliness, and tourist facilities used is a multiple-choice questionnaire. Each statement item in the instrument is provided with five frequency response choices for respondents, and the answer choices are adjusted based on the indicators of each category, both positive and negative. Table 1 shows the data types and data collection techniques this research requires.
Table 1. Sources and data collection techniques
|
No. |
Data Type |
Data Collection Technique |
Data Sources |
|
|
Instrument |
Tool |
|||
|
|
Primary |
|||
|
|
Tourist satisfaction |
Questionnaire |
List of statements |
Traveler |
|
|
Environmental hygiene |
Questionnaire |
List of statements |
Traveler |
|
|
Tourist facilities |
Questionnaire |
List of statements |
Traveler |
|
|
Secondary |
|||
|
|
Type and number of tourists |
Documentation |
Note, Copy, Photo, record |
Tourist area manager |
|
|
Availability of facilities |
Documentation |
Note, Copy, Photo, record |
Tourist area manager |
Later, the instrument was tested to determine the validity and reliability of the instrument. Testing the validity or accuracy of each statement item in measuring variable categories. Pearson's product-moment correlation formula is used to calculate the correlation coefficient of each item score with the total score. Then, instrument testing was conducted on 30 respondents from the research population excluded from the research sample. The instrument is valid if the test results show that the calculated rvalue for each item is more significant than the rtable (rcount > rtable; with alpha 5% = 0.361). Cronbach alpha is calculated to test the reliability and internal consistency of satisfaction scores [24]. Testing process The validity and reliability of the instrument were carried out with the help of IBM SPSS Statistics Version 25.0 for Windows. The instrument is declared reliable if it obtains a score of >0.60. The variables used consist of the independent variable and the dependent variable. The independent variable consists of environmental cleanliness (X1) and tourist facilities. (X2) and customer satisfaction (Y) as the dependent variable.
3.2 Research instruments
This paper uses three instruments: tourist satisfaction, environmental cleanliness, and tourist facilities.
1) Tourist satisfaction
Conceptually, tourist satisfaction is a person's happiness or disappointment that arises after comparing the performance (results) of the product they are considering with the expected performance (expectations). However, from an operational definition, tourist satisfaction can be measured from material questionnaires regarding the satisfaction of tourists who visit tourist attractions. Indicators include interest in returning to visit, suitability of visitor expectations, recommendations through word of mouth, consumer complaints, suggestions, view, access/affordability, and security/comfort. These indicators are an instrument grid of tourist satisfaction variables, as shown in Table 2.
Table 2. List of tourist satisfaction instruments
|
No. |
Indicator |
Initial Item Number |
Total |
Valid Item Number |
|||
|
Positive (+) |
Negative (-) |
Positive (+) |
Negative (-) |
Total |
|||
|
1. |
Interest in returning to visit |
2,3,4,5 |
1,6 |
6 |
2,3,4,5 |
1,6 |
6 |
|
2. |
Suitability of visitor expectations |
7,11 |
8,9,10 |
5 |
7, 11 |
8, 10 |
4 |
|
3. |
Recommendations through word of mouth |
12, 16 |
13, 14, 15 |
5 |
12, 16 |
13, 14, 15 |
6 |
|
4. |
Consumer complaints and suggestions |
20, 21 |
17, 18, 19 |
5 |
20 |
17, 19 |
3 |
|
5. |
Natural beauty |
22, 23, 25 |
24, 26 |
5 |
22, 25 |
24, 26 |
4 |
|
6. |
Access/Affordability |
27, 28, 29 |
30, 31 |
5 |
27, 28, 29 |
31 |
4 |
|
7. |
Security/Convenience |
32, 35, 36 |
33, 34 |
5 |
32, 35, 36 |
33 |
4 |
|
|
Total |
19 |
17 |
36 |
17 |
13 |
30 |
2) Environmental cleanliness
Environmental cleanliness is a human effort to keep the environment from being dirty to create a healthy and comfortable environment. Environmental cleanliness can be seen from the results of a questionnaire regarding the cleanliness of the tourist beach environment, which includes (1) waste management, (2) the tourist environment is free from rubbish, and (3) tourist facilities and infrastructure that look clean and tidy. Table 3 shows a grid of environmental cleanliness instruments.
Table 3. List of environmental cleanliness instruments
|
No. |
Indicator |
Initial Item Number |
|
Valid Item Number |
|||
|
Positive (+) |
Negative (-) |
Total |
Positive (+) |
Negative (-) |
Total |
||
|
1. |
Waste management |
1,6,7,8,9,10 |
2,3,4,5 |
10 |
1,6,7,8,9,10 |
2,3,4,5 |
10 |
|
2. |
Waste free environment |
11,12,13,14,16,19,20 |
15,17,18 |
10 |
11,12,13 |
15,17,18 |
10 |
|
3. |
Facilities and infrastructure are clean and tidy |
21,22,26,33 |
23,24,25,27,28,29,30,31,32 |
13 |
21,26,33 |
23,25,28,29,30,31,32 |
10 |
|
|
Total |
17 |
16 |
33 |
12 |
14 |
26 |
3) Tourist facilities
Tourist facilities are physical equipment provided by service providers to be used by consumers in carrying out their activities. These tourist facilities include facility design, functional value, aesthetics, supporting conditions, and supporting equipment, an instrument grid, as shown in Table 4.
Table 4. List of tourist facilities instruments
|
Indicator |
Initial Item Number |
Total |
Valid Item Number |
|||
|
Positive (+) |
Negative (-) |
Positive (+) |
Negative (-) |
Jml |
||
|
1. Facility design 2. Function value 3. Aesthetics 4. Supportive conditions 5. Supporting equipment |
1,3,4 8,9,10,12 13,14,15 20,23 25,28,29 |
2,5,6 7,11 16,17,18 19,21,22,24 26,27,30 |
6 6 6 6 6 |
1,3,4 9,10 13,14,15 20 28,29 |
2,5,6 7 16,17,18 19,21,22,24 26,27,30 |
6 3 6 5 5 |
|
Total |
15 |
15 |
30 |
11 |
14 |
25 |
3.3 Data analysis techniques
1) T-test analysis
In this paper, descriptive and inferential analysis techniques are used. Descriptive analysis techniques are used to describe or describe the data collected without the intention of making general conclusions or generalizations. Data presentation includes data frequency and percentage, average value (mean), median, standard deviation mode, curve graph variant, and histogram. Meanwhile, inferential analysis techniques are used to analyze sample data, and the results are applied to the population, with the primary tool of inferential analysis, namely, the null hypothesis (Ho). In addition, quantitative analysis is t-test analysis, which is used to process data obtained from a list of questions in the form of a questionnaire into the form of numbers and calculations with the help of the SPSS program application.
Next, a t-test was carried out, which aimed to test the proof of the hypothesis regarding the partial significance of the effect using Eq. (1). In this case, partially analyze the relationship between environmental cleanliness variables and tourist facilities and tourist satisfaction variables. The relationship between these variables can show how far the independent variables, individually and simultaneously, can explain variations in tourist satisfaction variables.
$t=\frac{r \sqrt{n-2}}{\sqrt{\left(1-r^2\right.}}$ (1)
where, r = correlation coefficient; n = number of data.
By using partial testing, the following hypothesis is formulated:
X1 Testing:
- There is no influence of environmental cleanliness on tourist satisfaction at Cina Beach, Kupang Regency (Ho: β1 = 0).
- There is an influence of environmental cleanliness on tourist satisfaction at Cina Beach, Kupang Regency (Ha: β1 ≠ 0)
X2 Testing:
- There is no influence of tourist facilities on tourist satisfaction at Cina Beach, Kupang Regency (Ho: β1 = 0).
- There is an influence of tourist facilities on tourist satisfaction at Cina Beach, Kupang Regency (Ha: β1 ≠ 0).
Based on this hypothesis, there are two variables (X) to determine the ttable value, namely, environmental cleanliness (X1) and tourist facilities (X2), with a significance of 5% from 100 respondents (because it is two-sided, the significance is 0.025). With a significance of 0.025 and df = 98 (100-2), the ttable value is 1.98. The ttest criteria are as follows:
- If tcount > ttable or Sig < α, then Ho is rejected, Ha is accepted, meaning that there is a partial influence between environmental cleanliness and tourist facilities on tourist satisfaction;
- If tcount < ttable or Sig > α, then Ho is accepted, and Ha is rejected, meaning there is no partial influence of environmental cleanliness and tourist facilities on tourist satisfaction.
$F h=\frac{R^2 / k}{\left(1-R^2\right) /(n-k-1)}$ (2)
where, R = Multiple correlation coefficient; n = number of samples; k = number of components of the independent variable.
To get the f table value, use the formula ftable= (k;n-k). Value k=2(x1&x2); n-k(100-2). Based on the F distribution table for a probability of 0.05, with k(2);n-k(98), the Ftable value = 3.09. The decision-making criteria used for the Ftest are as follows:
- If Fcount > Ftable or Sig < α, then Ho is rejected, Ha is accepted, meaning that there is a simultaneous influence between service quality, facilities, and location on consumer satisfaction;
- If Fcount < Ftable or Sig > α, then Ho is accepted, and Ha is rejected, meaning there is no simultaneous influence between service quality, facilities, and location on consumer satisfaction.
3.4 Validity and reality test
The validity test aims to measure whether a questionnaire is valid or not. An item is said to be valid if the corrected item-total correlation value is more significant than 0.3. If the correlation of each factor is positive and the magnitude is 0.3 or above, then the factor is a strong construct. Valid questionnaire items can be used as a reference for further research. The validity test results:
(1) Environmental cleanliness of the 33 items tested obtained seven invalid statement items with rcount < rtable = 0.361, and 26 valid statement items;
(2) Tourist facilities from 30 tested items, five invalid statement items were obtained, with rcount < rtable = 0.361, and 25 valid statement items; and,
(3) Tourist satisfaction variable: of the 36 statement items, six items are invalid, with rcount < rtable = 0.361, and 30 items are stated.
Next, the reliability test measures a questionnaire indicating a variable or construct. A questionnaire is said to be reliable or reliable if a person's answers to statements are consistent. The criteria for a research instrument are said to be reliable using Cronbach's Alpha technique if the reliability coefficient is more significant than 0.6. The reliability test results for each variable are obtained as follows:
(1) Environmental cleanliness variable with 26 valid items, declared reliable with a reliability coefficient of 0.802>0.60;
(2) Tourist facilities with 25 valid statement items are declared reliable with a reliability coefficient of>0.60; and,
(3) Tourist satisfaction was declared reliable from 30 valid items with a reliability coefficient of 0.885>0.60.
4.1 Statistical description
In regression analysis, many model assumptions exist, namely multicollinearity, inconsistent variance (non-homogeneity), heteroscedasticity tests, linearity, and autocorrelation [25]. In addition, some multiple regression assumptions that are considered vital commit violations such as standard distribution errors. On the other hand, a study is considered fulfilling if it has an appropriate design, such as independence of observations. If one or more assumptions are violated, the existing model is no longer reliable and unacceptable in estimating population parameters [26].
4.1.1 Normal distribution test
Figure 3 shows the results of the data normality test, which produces a curve shape with a normally distributed pattern. In contrast, Figure 3b shows the results of the P-Plot normality test, which produces a diagonal line with a normally distributed pattern. Based on Table 5, the normality test results obtained by the Kolmogorov-Smirnov method are 0.144 > 0.05 to ensure that the data has a typical distribution pattern. These results indicate that the data is generally distributed in that the residuals are distributed normally and vice versa.
Table 5. Kolmogorov-Smirnov test
|
N |
100 |
|
|
Normal Parametersa,b |
Mean |
.0000000 |
|
Std. Deviation |
5.37886382 |
|
|
Most Extreme Differences |
Absolute |
.078 |
|
Positive |
.034 |
|
|
Negative |
-.078 |
|
|
Test Statistic |
.078 |
|
|
Asymp. Sig. (2-tailed) |
.144c |
|
(a)
(b)
Figure 3. Normal distribution test results (a) Data normality histogram; (b) Normality plot
4.1.2 Heteroscedasticity test
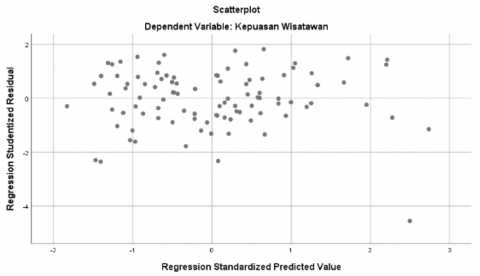
The heteroscedasticity test aims to test whether, in the regression model, there is an inequality of variance from the residuals of one observation to another. The basis of heteroscedasticity test analysis is that if there is a specific pattern, such as the points forming a particular regular pattern (wavy, widening, then narrowing), it indicates that heteroscedasticity has occurred. According to Klein et al. [27], one of the assumptions of multiple regression analysis is homoscedasticity error. Heteroscedasticity, often found in psychological or behavioral data, may be caused by the misspecification of omitted nonlinear predictor terms or unobserved predictors not included in the model. Figure 4 shows the results of the heteroscedasticity test on a scatterplot graph where the points are spread randomly and above and below the number 0 for tourist satisfaction. This means that heteroscedasticity does not occur in the regression model, so the regression model is suitable for use.
Figure 4. Heteroscedasticity of the scatterplot graph
4.1.3 Glejser test
According to Godfrey [28], the Glejser test for heteroscedasticity only applies to conditional symmetry. Therefore, a modification of the Glejser Test is recommended. The proposed test statistic is asymptotically valid even if the disturbances are not symmetrically distributed and can be used to test heteroscedasticity when a conditional location function other than the conditional mean is estimated. The Glejser test that has been carried out shows no significant relationship between all independent variables and the residual absolute value with a significance of more than 0.05. This means that this model is free from heteroscedasticity (Table 6).
Table 6. Heteroscedasticity
|
Model |
Unstandardized Coefficients |
Standardized Coefficients |
t |
Sig. |
|
|
B |
Std. Error |
Beta |
|||
|
(Constant) |
2.436 |
2.766 |
|
.881 |
.381 |
|
Cleanliness |
-.111 |
.051 |
-.323 |
-2.177 |
.032 |
|
Tourist facilities |
.134 |
.053 |
.377 |
2.539 |
.013 |
4.1.4 Multicollinearity test
The multicollinearity test tests whether the regression model finds a correlation between independent variables. Multicollinearity can be seen from the tolerance value and variance inflation factor (VIF). The cutoff value is commonly used to indicate the presence of multicollinearity; if the tolerance value is above > 0.1 and the VIF (variance inflation factor) is below or < 10, then multicollinearity does not occur. Table 7 shows that the tolerance and VIF values for the variables Cleanliness (X1) and Tourist Facilities (X2) are 0.438 > 0.1 and VIF 2.285 < 10, which means that there is no multicollinearity in these variables.
Table 7. Multicollinearity test
|
Model |
Unstandardized Coefficients |
Standardized Coefficients |
t |
Sig. |
Collinearity Statistics |
||
|
B |
Std. Error |
Beta |
Tolerance |
VIF |
|||
|
(Constant) |
50.548 |
4.799 |
|
10.533 |
.000 |
|
|
|
Cleanliness |
.299 |
.089 |
.391 |
3.374 |
.001 |
.438 |
2.285 |
|
Tourist facilities |
.245 |
.091 |
.310 |
2.677 |
.009 |
.438 |
2.285 |
4.1.5 Autocorrelation test
The Autocorrelation test aims to test whether, in the linear regression model, there is a correlation between the confounding error in period t and the confounding error in period t-1 (previous). One method that can be used to detect autocorrelation's presence or absence is the Durbin-Watson test. With the taking criteria, if D-W is equal to 2, then perfect autocorrelation does not occur as a rule of thumb (short rule); if the D-W value is between 1.5-2.5, then there are no symptoms of autocorrelation. Table 8 shows the results of the autocorrelation test.
Table 8. Autocorrelation
|
Model |
R |
R Square |
Adjusted R Square |
Std. Error of the Estimate |
Durbin-Watson |
|
|
.656 |
.430 |
.419 |
5.434 |
2.210 |
Condition:
a) There is autocorrelation if d is smaller than dL or more significant than (4-dU).
b) If d lies between dL and (4-dU), it means there is no autocorrelation.
c) If d lies between dL and dU or between (4-dU) and (4-dL), then it does not produce a definite conclusion.
Based on the DW table, it is obtained that dL= 1.6337 and dU = 1.7152 and 4-dU = 2.2848. At the same time, the results of the D-W analysis obtained a value of d = 2.210, which shows that the D-W value is located between dL and 4-DU (1.6337 < 2.210> 2.284), or If the D-W value is between 1.5-2.5, then there are no symptoms of autocorrelation.
4.2 Hypothesis testing
Table 9. Partial test
|
Model |
Unstandardized Coefficients |
Standardized Coefficients |
t |
Sig. |
|
|
B |
Std. Error |
Beta |
|||
|
(Constant) |
50.548 |
4.799 |
|
10.533 |
.000 |
|
Cleanliness |
.299 |
.089 |
.391 |
3.374 |
.001 |
|
Tourist facilities |
.245 |
.091 |
.310 |
2.677 |
.00 |
In this paper, hypothesis testing has been carried out partially (t-test) and simultaneously (F-test). As shown in Table 9, it is known that the probability value of tcount is 3.374 >ttable 1.98 (two-party test), and the significance value of the cleanliness variable is 0.001<0.025 (two-party test), so H0 is rejected, and Ha is accepted. This shows that the cleanliness variable has a significant effect on tourist satisfaction. Likewise, with tourist facilities, where H0 is rejected, and Ha is accepted, wherein the partial test the t-calculated probability value is 2.677 >ttable 1.98 (two-party test) and the significance value of the tourist facilities variable is 0.009 < 0.025 (two-party test). Thus, the tourist facility variable has a significant effect on tourist satisfaction.
Furthermore, the results of the simultaneous test (F Test) are shown in Table 10. As is known, the simultaneous test aims to test the influence of the independent variables (cleanliness and tourist facilities) on the dependent variable (tourist satisfaction) together (simultaneously). The significance level is α = 5% and df (k:n-k-1). It can be seen that the Fcount probability value is 36.660>Ftable is 3.09, and the significance value of the cleanliness and tourist facilities variables is 0.000<0.05. That shows that H0 is rejected and Ha is accepted, in that cleanliness and tourist facilities significantly affect tourist satisfaction.
Table 10. Simultaneous test
|
ANOVAa |
|||||
|
Model |
Sum of Squares |
df |
Mean Square |
F |
Sig. |
|
Regression |
2165.025 |
2 |
1082.512 |
36.660 |
.000b |
|
Residual |
2864.285 |
97 |
29.529 |
|
|
|
Total |
5029.310 |
99 |
|
|
|
|
a. Dependent Variable: Tourist Satisfaction |
|||||
|
b. Predictors: (Constant), Tourist facilities, Cleanliness |
|||||
Next, to determine the effect of the independent variable on the dependent variable, a coefficient of determination (R2) test is carried out. Table 11 shows the coefficient of determination test where a value of 0.655 or close to 1 is obtained, which explains that the independent variables provide almost all the information needed to predict variations in the dependent variable. Conversely, if the coefficient of determination (R²)=0, the independent variable cannot explain its effect on the dependent variable. Apart from that, it can be seen that the termination coefficient value for the adjusted R square value is 0.419. This means that the ability of the independent variables (environmental cleanliness and tourist facilities) to explain the dependent variable (tourist satisfaction) is 41.90%. Thus, the remaining 58.10% of the adjusted square value is explained by other variables not discussed in this research, such as location distance, geographical conditions of transportation, accommodation, comfort, security, and shopping.
Table 11. Coefficient of determination test
|
Model Summary |
||||
|
Model |
R |
R Square |
Adjusted R Square |
Std. Error of the Estimate |
|
1 |
.656a |
.430 |
.419 |
5.434 |
|
a = Predictors: (Constant), Tourist facilities, Cleanliness |
||||
4.3 Analysis and findings
4.3.1 Environmental hygiene conditions
There are five indicators to determine the condition of environmental cleanliness (X1) at the Cina Beach location, which are divided into very bad (VB), bad (B), moderate (M), good (G), and very good (VG). Figure 5 shows that the three highest environmental cleanliness assessment measurement indicators are at a medium level (above 50%), followed by the second level, poor, and the third, good. Only a few visitor ratings give ratings of very good and very bad levels.
Based on the frequency distribution, it can be seen that the condition of the environmental cleanliness score is in the theoretical score interval between 68-88, with a score of 62% (Table 12). This means that, on average, respondents stated that the cleanliness of the China Beach tourist environment was in the moderate/sufficient category.
Figure 5. Measurement of environmental cleanliness indicators
Table 12. Frequency distribution of environmental cleanliness score categories
|
Class Intervals |
Frequency Absolute |
Class Boundaries |
Category |
Frequency Relative (%) |
Relative Frequency Cumulative (%) |
|
26-46 |
0 |
46.5 |
B |
0 |
0 |
|
47-67 |
31 |
67.5 |
VB |
31 |
31 |
|
68-88 |
62 |
88.5 |
M |
62 |
93 |
|
89-109 |
7 |
109.5 |
G |
7 |
100 |
|
110-130 |
0 |
130.5 |
VG |
0 |
100 |
|
100 |
100 |
4.3.2 Condition of tourist facilities
Based on direct measurements of respondents, a primary picture of the tourist facility variable (X2) was obtained, as shown in Figure 6. The distribution of variable frequencies tends to form a symmetrical curve. Around 29% of respondents were in the average group, 36% were below average, while there were 35% above average.
Figure 6. Tourist facilities (X2)
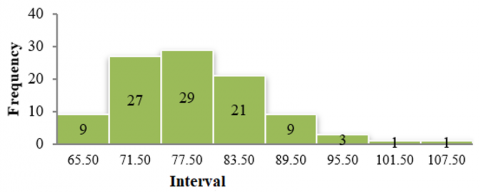
Like environmental cleanliness conditions, tourist facilities are divided into five indicators, as shown in Figure 7. It can be seen that with an average empirical score of 75.4, the condition of tourist facilities is in the theoretical score interval between 65-84 with a score of 84%. These results mean that, on average, respondents stated that Oesina tourist facilities were in the medium category (M).
Figure 7. Line diagram for the tourism facilities category (X2)
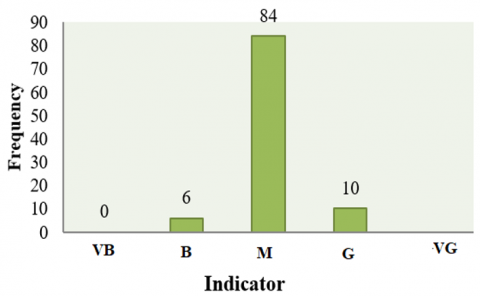
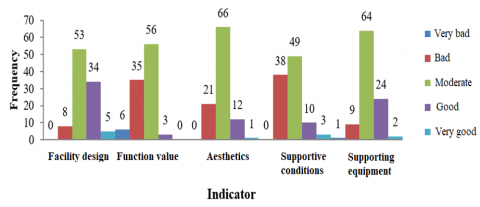
Next, testing was carried out for each indicator of the tourism facilities variable (facility design, functional value, aesthetics, supporting conditions, and supporting equipment), giving results as in Figure 8.
Figure 8. Tourist facility variable indicators
It can be seen that the average assessment of tourist facilities available at tourist beaches is at a medium level with a percentage of between 49 – 66%. This shows that the tourist facilities tourism managers provide still need to be improved to increase their attractiveness to tourists.
4.3.3 Conditions of tourist satisfaction
Tourist satisfaction is the Y variable shown in Figure 9.
Figure 9. Histogram of tourist satisfaction (Y)
Based on this figure, the median value and mode of tourist satisfaction tend to be close to the average score. This means that the distribution of variable frequencies tends to form a symmetrical curve. Around 57% of respondents were in the average group, 23% were below average, while there were 20% above average.
To find out the score categories for tourist satisfaction conditions, a frequency distribution of score categories is then arranged in five intervals, and the results are shown in Table 13. It can be seen that tourist satisfaction conditions are in the theoretical score interval between 78-101, with a score of 89%. These results show that the average respondent stated that tourist satisfaction in the Oesina area was in the medium category (M), as shown in Figure 10.
Furthermore, testing each indicator of the tourist satisfaction variable (interest in visiting, conformity to expectations, word of mouth, complaints and suggestions, views, access, safety, and comfort) gives results as in Figure 11. It can be seen that customer satisfaction with the seven indicators shows that there are five the highest tourist assessment indicator with a moderate score, only the conformity expectations indicator shows the highest good score (47%), and one has the highest lousy rating with a score of 45% on the complaints and suggestions indicator.
Figure 10. Line diagram of tourist satisfaction category (Y)
Figure 11. Variable indicator of tourist satisfaction
Table 13. Distribusi frekuensi kategori skor Kepuasan wisatawan (Y)
|
Class Intervals |
Frequency Absolute |
Class Boundaries |
Category |
Frequency Relative (%) |
Relative Frequency Cumulative (%) |
|
30-53 |
0 |
53.5 |
B |
0 |
0 |
|
54-77 |
2 |
77.5 |
VB |
2 |
2 |
|
78-101 |
89 |
101.5 |
M |
89 |
91 |
|
102-125 |
9 |
125.5 |
G |
9 |
100 |
|
126-149 |
0 |
149.5 |
VG |
0 |
100 |
|
100 |
100 |
4.4 Discussion
According to Huh and Uysal [29], there is a relationship between destination attributes and overall satisfaction with cultural/heritage experiences, gender, length of stay, and decision-making timeframe. Previously, it was also stated by Yavuz [30] that the satisfaction-based evaluation process was measured based on tourist demographic patterns such as age, gender, social background, income, marital status, employment, education, and travel behavior patterns. Meanwhile, Font [31] emphasized that age, education level, nationality, and occupation determine the travel decision process. The results of the tourist demographic and socio-economic survey from this study show that most tourists in this region are young tourists, with an age range of 18 to 29 years, accounting for 71% of respondents. This group is dominated by high school students at 59%, followed by undergraduates at 29%, and the rest are junior high school and postgraduate students. The survey found that 45% were traders, entrepreneurs, freelancers, homemakers, and unemployed (Figure 2). The number of male tourists at 53% is almost comparable to female tourists at 47%.
The descriptive statistics in Table 3 show that of the seven attributes of tourist satisfaction, four attributes have the highest positive assessment: interest in revisiting, views, access, and security. On the other hand, only the recommendation attribute via word of mouth has the highest unfavorable rating. Likewise, the environmental cleanliness instrument has three indicators (Table 4). Here, it can be seen that the indicators of clean and tidy tourist facilities and infrastructure show relatively high negative assessments from tourists. This has also been shown in Figure 10 at the medium level assessment with a percentage between 49-55%. However, on the other hand, indicators for waste management and a waste-free environment show relatively high positive assessments. Once again, to identify the dimensions underlying this destination indicator, analysis was carried out to measure three variables, including environmental cleanliness (X1), tourist facilities (X2), and tourist satisfaction (Y). As a result, tourists' assessments for the three variables are at a medium level (Figure 5-11). This assessment provides information on how the Cina Beach destination needs to improve tourist satisfaction with the 15 indicators studied in this paper. The assessment range for the level of cleanliness of the destination environment is at a score of 62% with three indicators, tourist facilities are at a score of 84% with five indicators, and the level of customer satisfaction is at a score of 89% with seven indicators. In addition, consistent and robust correlations between indicators and variables are maintained and labeled based on the characteristics and properties of the variables from which the indicators originate.
On the other hand, many studies have been conducted to test several destination attributes in measuring tourist satisfaction. Many of them are general, while others are more specific. Examining these attributes is not the aim of this research; instead, it focuses on the attributes that are most selective but representative and appropriate to local perspectives. Therefore, this research seeks to justify tourist satisfaction with 15 attributes taken from tourism literature surveys and in the local context. The discussion and findings of this research show that tourists at Cina Beach show different opinions towards various destination services. As a final analysis, a multiple regression model with the ordinary least squares method was used to determine whether these retained factors had a valid impact on the overall level of tourist satisfaction. Here, the coefficients of two variables (environmental cleanliness and tourist facilities) are used as independent variables, and tourist satisfaction scores are used as the dependent variable in the multiple regression model. The multiple linear regression analysis results found that location, cleanliness, and facilities had a positive and significant effect on visitor satisfaction. In addition, indicators of interest in returning to visit and access to tourist beach locations provide hope, with tourist rating levels at scores of 64 and 65%.
Furthermore, many factors influence destination selection and its competitiveness. In general, in academic literature and practice, it has been widely accepted that satisfaction with destination factors is the main prerequisite for tourists in choosing a tourist destination [32]. Shonk et al. [33] further defines destination satisfaction as a multidimensional assessment of its attribute characteristics and its evaluation during and after returning from the destination. Satisfaction is a factor in a destination's ability to fulfill tourists' functions, services, and social and psychological needs. Likewise, tourist visits to Cina Beach destinations certainly have their satisfaction for tourists. Tourist satisfaction with tourism destinations is a multidimensional concept with many interrelated factors. The expected satisfaction can be a reason to make a return visit. In addition, the tourism sector is becoming increasingly crucial for regional and economic development because this sector can contribute to regional income. The tourism sector grows the economy through the creation and existence of employment opportunities so that it can reduce poverty. With its natural and cultural riches, Kupang Regency strives to become one of the priority tourist destinations. It can be seen from the increase in weekend tourist visits, especially on the Cina Beach, reaching 1000 people. Therefore, it is hoped that in the future, the Cina Beach destination will have additional facilities to increase tourists' interest in visiting. For example, travel agents, information centers, health facilities, fire extinguishers, hydrants, TIC (Tourism Information Center), tour guides, and information boards.
In addition, improving tourism facilities and cleanliness at the beach will attract more tourists and significantly contribute to achieving the SDGs. Combining efforts to preserve the environment, improve community welfare, and sustain economic growth, Air Cina Beach can become a sustainable tourist destination that will benefit current and future generations. From an environmental conservation perspective, better waste management, nature conservation, sustainable energy use and ecosystem restoration are needed. Meanwhile, community welfare will impact job creation, increase village income, preserve culture, and empower the community. That will impact sustainable economic growth, increasing regional competitiveness and the growth of local businesses such as accommodation, restaurants and souvenir shops.
A comprehensive approach needs to be taken to achieve optimal results, involving various parties such as local government, communities, tourism businesses and academics. Several steps that can be taken include: (1) preparing a tourism management plan with SWOT analysis, identifying potential and problems, as well as formulating clear goals and strategies; (2) increasing human resource capacity through training for the community and officers related to tourism management, environmental cleanliness and tourist services; (3) cross-sector collaboration by building synergies between various related sectors, such as tourism, the environment and community empowerment; and (4) regular monitoring and evaluation of the implementation of the tourism management plan and carrying out evaluations for improvement.
In this study, several findings can be the basis for improving tourism management and policy-making at Air Cina Beach. These include increasing public awareness and ongoing educational campaigns to increase public awareness about the importance of keeping the environment clean and the negative impacts of waste. Then develop tourism awareness groups who are active in maintaining the cleanliness and beauty of the beach and improving facilities by increasing the number and type of facilities needed, such as toilets, bathrooms, trash cans and seating, as well as regular repairs and maintenance of existing facilities.
Another finding is the need to build environmentally friendly facilities, for example, using renewable energy, easily recycled materials, and an integrated waste management system, from collection and waste sorting to final processing. Therefore, it is necessary to establish a waste bank to incentivise people who collect waste and collaborate with scavengers to increase the added value of waste. Lastly, rules must be consistently enforced by formulating straightforward and easy-to-understand cleanliness and environmental management regulations. Thus, consistent law enforcement against rule violators will impose strict sanctions on violators to provide a deterrent effect. Apart from that, specifically for Air Cina Beach tourism managers and policy makers, it is necessary to carry out a Sustainable Education Campaign, form an Active Tourism Awareness Group (ATAG) and provide incentives or awards to individuals or groups who are active in maintaining the cleanliness of the beach environment.
The results of studies focused on Air Cina Beach can provide a precious contribution to the world of tourism and sustainable development. Among them is a deeper understanding of local tourists' preferences for facilities and cleanliness, which may be different from foreign tourists. It is essential to design facilities and management programs that meet the expectations of local communities. Then, the impact of local tourists' social media activity can provide insight into how they share their experiences and recommend or criticize this destination. This study can then help develop more specific key performance indicators (KPI) to measure the success of sustainable development efforts at Air China Beach. For example, by measuring changes in tourist satisfaction levels over time, we can assess waste management programs' effectiveness or new facilities' construction. The contribution of this study can be developed into a contextual measurement model by adapting existing tourist satisfaction measurement instruments to make them more relevant to the context of Air Cina Beach, for example, by adding questions about the importance of local cultural values or the environmental impact of tourism activities. For example, combining quantitative (survey) and qualitative (in-depth interviews) methods can provide a more comprehensive picture of the factors influencing tourist satisfaction. In addition, the results of this research can be a reference for other areas that have similar characteristics to Air Cina Beach. It can then be developed by identifying different tourist segments (e.g., families, young couples, adventure tourists) and providing policy recommendations tailored to the needs of each segment.
The findings of this research indicate that tourists' evaluation of destination attributes is still the most critical indicator of overall tourist satisfaction. Air Cina Beach tourists have different opinions regarding the various service indicators selected for this study. Tourists are interested in returning to visit tourist destinations and the view of access to beach locations. However, the lowest level of satisfaction was observed in facilities and infrastructure attributes such as facility design, functional value, aesthetics, supporting conditions, and supporting equipment.
As global competitiveness in the tourism industry increases and the challenges it will face in the coming years, destination managers and other market players on the Air Cina Beach must pay careful attention to improving existing services and expanding other facilities that are negatively evaluated by tourists in this research. Considering the government's limited resources, investors, market players, and beneficiaries of this sector must do the same to advance the development of the tourism sector, especially in destination areas and the country as a whole.
The author would like to thank the regular financial support (Grant No.: 23/UN.15.13.3/PPK/SPK/IV/2023), Faculty of Teacher Training and Science, University of Nusa Cendana – Kupang.
|
ANP |
Aquatic National Park |
|
ATAG |
Active Tourism Awareness Group |
|
KPI |
Key Performance Indicators |
|
NMCA |
National Marine Conservation Area |
|
SDGs |
Sustainable Development Goals |
|
TNC |
The Nature Conservancy |
|
UN |
United Nations |
|
VIF |
Variance Inflation Factor |
|
SHS |
Senior High School |
[1] González, M.E.A., Comesaña, L.R., Brea, J.A.F. (2007). Assessing tourist behavioral intentions through perceived service quality and customer satisfaction. Journal of Business Research, 60(2): 153-160. https://doi.org/10.1016/j.jbusres. 2006.10.014
[2] Kušen, E. (2016). Tourism attraction system. Evolution of Destination Planning and Strategy: The Rise of Tourism in Croatia, 29(4): 119-148. https://doi.org/10.1007/978-3-319-42246-6_7
[3] Barsky, J. (1992). A strategy for customer satisfaction. Cornell Hotel and Restaurant Administration Quarterly, 33(5): 32-40. https://doi.org/10.1016/0010-8804(92)90025-z
[4] Kumar, V., Nayak, J.K. (2014). The role of self-congruity and functional congruity in influencing tourists’ post visit behaviour. Advances in Hospitality and Tourism Research (AHTR), 2(2): 24-44.
[5] Saqib, N. (2019). A positioning strategy for a tourist destination, based on analysis of customers’ perceptions and satisfactions: A case of Kashmir, India. Journal of Tourism Analysis: Revista de Análisis Turístico, 26(2): 131-151. https://doi.org/10.1108/JTA-05-2019-0019
[6] Boatswain, M.L. (2015). Decoy effects in brand positioning. Doctoral dissertation, Kingston University.
[7] Velázquez, B.M., Saura, I.G., Molina, M.E.R. (2011). Conceptualizing and measuring loyalty: Towards a conceptual model of tourist loyalty antecedents. Journal of Vacation Marketing, 17(1): 65-81. https://doi.org/10.1177/1356766710391450
[8] Ravald, A., Grönroos, C. (1996). The value concept and relationship marketing. European Journal of Marketing, 30(2): 19-30. https://doi.org/10.1108/03090569610106626
[9] Brady, M.K., Cronin Jr, J.J., Brand, R.R. (2002). Performance-only measurement of service quality: A replication and extension. Journal of Business Research, 55(1): 17-31. https://doi.org/10.1016/S0148-2963(00)00171-5
[10] Ngo, V.M. (2018). Measuring customer satisfaction: A literature review. In Proceedings of the 7th International Scientific Conference Finance and Performance of Firms in Science, Education and Practice, pp. 1637-1654.
[11] Giese, J.L., Cote, J.A. (2014). Defining consumer satisfaction. Academy of Marketing Science Review, 2000(1): 1-24.
[12] Vu, N.K.D. (2021). Service quality and its impact on customer satisfaction. https://doi.org/10.6084/m9.figshare.17089454
[13] Yoon, Y., Uysal, M. (2005). An examination of the effects of motivation and satisfaction on destination loyalty: A structural model. Tourism Management, 26(1): 45-56. https://doi.org/10.1016/j.tourman.2003.08.016
[14] Kozak, M., Rimmington, M. (2000). Tourist satisfaction with Mallorca, Spain, as an off-season holiday destination. Journal of Travel Research, 38(3): 260-269. https://doi.org/10.1177/004728750003800308
[15] Oppermann, M. (2000). Tourism destination loyalty. Journal of Travel Research, 39(1): 78-84. https://doi.org/10.1177/004728750003900110
[16] Kumar, S. (2019). Implementing sustainable tourism as a pro-poor and community development approach. Journal of Tourism Quarterly, (2): 78-82.
[17] Moscardo, G., Konovalov, E., Murphy, L., McGehee, N.G., Schurmann, A. (2017). Linking tourism to social capital in destination communities. Journal of Destination Marketing & Management, 6(4): 286-295. https://doi.org/10.1016/j.jdmm.2017.10.001
[18] Usman, U., Kazmi, S.M.O. (2015). Business research measuring of satisfaction and post-purchase process. https://doi.org/10.13140/RG.2.1.2656.4004
[19] Stevens, B.F. (1992). Price value perceptions of travelers. Journal of Travel Research, 31(2): 44-48. https://doi.org/10.1177/004728759203100208
[20] Petrick, J.F., Morais, D.D., Norman, W.C. (2001). An examination of the determinants of entertainment vacationers’ intentions to revisit. Journal of Travel Research, 40(1): 41-48. https://doi.org/10.1177/004728750104000106
[21] Križaić, V. (2014). Application of norms models with Vectoral system in Construkction projects. Journal of Civil Engineering and Architecture, 8(6): 722-728. https://doi.org/10.17265/1934-7359/2014.06.007
[22] Woodruff, R.B., Cadotte, E.R., Jenkins, R.L. (1983). Modeling consumer satisfaction processes using experience-based norms. Journal of Marketing Research, 20(3): 296-304. https://doi.org/10.2307/3151833
[23] David, K.T., Wilton, P.C. (1988). Models of consumer satisfaction formation: An extension. Journal of Marketing Research, 25(2): 204-212. http://doi.org/10.1177/002224378802500209
[24] Yuksel, A. (2001). Managing customer satisfaction and retention: A case of tourist destinations, Turkey. Journal of Vacation Marketing, 7(2): 153-168. https://doi.org/10.1177/135676670100700205
[25] Osborne, J.W., Waters, E. (2003). Four assumptions of multiple regression that researchers should always test. Practical Assessment, Research, and Evaluation, 8(2): 1-5.
[26] Daoud, J.I. (2018). Multicollinearity and regression analysis. Journal of Physics: Conference Series, 949(1): 012009. https://doi.org/10.1088/1742-6596/949/1/012009
[27] Klein, A.G., Gerhard, C., Büchner, R.D., Diestel, S., Schermelleh-Engel, K. (2016). The detection of heteroscedasticity in regression models for psychological data model fit of nonlinear structural equation models view project. Psychological Test and Assessment Modeling, 58(4): 542-568.
[28] Godfrey, L.G. (1996). Some results on the Glejser and Koenker tests for heteroskedasticity. Journal of Econometrics, 72(1-2): 275-299. https://doi.org/10.1016/0304-4076(94)01723-9
[29] Huh, J., Uysal, M. (2004). Satisfaction with cultural/heritage sites. Journal of Quality Assurance in Hospitality & Tourism, 4(3-4): 177-194. https://doi.org/10.1300/J162v04n03_12
[30] Yavuz, N.F. (1994). Market segmentation study of visitors to North Cyprus through importance-performance analysis of destination attributes. Virginia Polytechnic Institute and State University.
[31] Font, A.R. (2000). Mass tourism and the demand for protected natural areas: A travel cost approach. Journal of Environmental Economics and Management, 39(1): 97-116. https://doi.org/10.1006/jeem.1999.1094
[32] Sánchez-García, I., Currás-Pérez, R. (2011). Effects of dissatisfaction in tourist services: The role of anger and regret. Tourism Management, 32(6): 1397-1406. https://doi.org/10.1016/j.tourman.2011.01.016
[33] Shonk, D.J., Christopher Greenwell, T., Bravo, G., Won, D. (2012). Site selection, satisfaction, and intent to return: An exploratory study of the perceptions of rights holders of small-scale sporting events. Journal of Convention & Event Tourism, 13(1): 1-15. https://doi.org/10.1080/15470148.2012.649580