Kasman Karimi*![]() | Syamsul Amar
| Syamsul Amar![]() | Idris
| Idris![]()
© 2024 The authors. This article is published by IIETA and is licensed under the CC BY 4.0 license (http://creativecommons.org/licenses/by/4.0/).
OPEN ACCESS
This research aims to examine income inequality, growth and environmental degradation and their determinants in ASEAN countries by focusing on lower middle income countries during 2010-2022 by applying a simultaneous equation approach. The main finding in this research is that there are endogenous influences on each other, including income inequality and growth, as well as income inequality and environmental degradation. Other findings in this research include, the first includes the analysis that income inequality is negatively and significantly influenced by growth and environmental degradation. Meanwhile, unemployment and human resources have a positive and significant effect. Second, growth analysis is negatively and significantly influenced by income inequality, while capital investment has a positive and significant influence. Third, environmental degradation analysis is positively and significantly influenced by income inequality, growth and number of industries, while renewable energy consumption has a negative and significant influence. The recommendation from this research is to produce policy implications based on variables that have a significant influence on the issues of income inequality, growth and environmental degradation to achieve sustainable development.
income inequality, growth, environmental degradation, ASEAN, lower middle income economies, simultaneous equation model
The issue of income inequality cannot be avoided for a country, including the lower middle income economies in ASEAN, so the aim of establishing ASEAN is not only to accelerate growth, but also to advance regional stability in Southeast Asia [1, 2]. As a problem in development, income inequality cannot be completely eliminated because it will still exist in a particular country [3-5]. One of the causes of income inequality is differences in countries' income attainment or differences in growth rates [6, 7]. Furthermore, the condition of income inequality in the ASEAN group of lower middle income economies, which consists of Indonesia, Vietnam, Laos, Cambodia and the Philippines, has been explored through the publication of World Bank data [8]. The phenomenon that occurs is that income inequality between ASEAN countries in the lower middle income economies group is quite moderate because the value has been above 0.3 for the last ten years.
The problem of income inequality cannot be separated from the economic conditions of a country because policies that pursue growth too much will create a threat, namely an increase in inequality [9, 10]. This is because this policy only benefits a few people, making them richer. In contrast, those with low incomes do not receive a tax cut. Based on data from the World Bank, growth in the ASEAN group of lower middle income economies in 2010-2019 was always above 5 percent [8]. However, conditions are different for 2020 and 2021, where growth conditions experienced a quite sharp decline due to the COVID-19 pandemic [8]. Based on the factual phenomenon between income inequality and growth that has been explained, these two variables are believed to be related because they have fluctuation trends that tend to be the same. This shows that income inequality is directly related to growth.
On the other hand, the issue of income inequality and growth cannot be separated from its impact on environmental degradation [11, 12]. In the process of controlling income inequality and growth, environmental aspects are often ignored, thereby causing a decline in environmental quality. The link between income inequality and environmental degradation will encourage a decrease in the carrying capacity of the environment because rich and powerful groups will try to pursue economic profits without paying attention to the environment [13-15]. Then, the link between growth and environmental degradation will also encourage environmental carrying capacity because increasing output will require various natural resources which will trigger exploitation activities and depreciation of natural resources [16].
Fluctuations in environmental degradation have occurred for the ASEAN group of lower middle income economies based on data from the World Bank using carbon emission indicators over the last ten years [8]. Laos is a country that has the lowest level of carbon emissions, but the average growth in carbon emissions is 15.47 percent or 11,794 kilo tons. Then, followed by Cambodia, which is also a country categorized as having a low level of carbon emissions after Laos, where the average growth in carbon emissions was 10.34 percent or 10,457 kilo tons. Meanwhile, the average growth in carbon emissions for Vietnam was 6.56 percent or 229685 kilo tons and the Philippines was 5.86 percent or 116826 kilo tons. The conditions are contrasting for Indonesia as a country that has the highest level of carbon emissions compared to the other four countries, but the average growth in carbon emissions is 3.26 percent or 516,140 kilo tons. The pattern of increasing carbon emission values is generally not the same in all ASEAN countries in the lower middle income economy group.
Apart from the factual phenomena that have been explained, this study is also supported by empirical phenomena examined from various relevant studies, including studies on income inequality and environmental degradation in China, where it was found that increasing income inequality led to the implementation of stricter environmental regulations [17]. Then, a study related to growth and environmental degradation in West Africa, found that the impact of growth in the long term had caused an increase in the quantity of carbon emissions [18]. In addition, the relationship between income inequality and growth has also been studied for groups of developed and developing countries, where it was found that growth had a negative effect on income inequality in developed countries, while contrasting results occurred for developing countries [19].
1.1 Determinants of income inequality
Income inequality can be interpreted as the difference in economic prosperity between the rich and the poor, this is reflected in the difference in income [20, 21]. Empirical studies have found several determinants of income inequality, including that growth will reduce income inequality if wages rise faster than average wages [22, 23]. Then, environmental degradation is one of the factors driving income inequality [24, 25]. Furthermore, unemployment will increase the level of inequality [26, 27]. Additionally, increased corruption leads to greater income inequality [28, 29]. Besides that, the formation of human capital will increase society's productivity, thereby reducing income inequality [30, 31].
1.2 Determinants of growth
Growth is an increase in people's economic activities which causes an increase in the amount of production of goods and services in a country in a certain period. Empirical studies have found several determinants of growth, including high inequality reducing growth in developing countries but encouraging growth in developed countries [32]. Then, legal regulations that maintain the carrying capacity of the environment can hinder growth [33]. Furthermore, human capital plays an important role in enhancing growth [34]. In addition, capital investment is needed to grow the economy [35, 36]. Besides that, net exports will encourage increased output and growth [37, 38].
1.3 Determinants of environmental degradation
Environmental degradation is defined as a reduction in the environment's capacity to meet social and ecological needs. It also said that environmental degradation is a significant threat to human health worldwide. Empirical studies have found several determinants of environmental degradation, including fairer income distribution resulting in lower environmental degradation [39]. Then, growth results in a reduction in natural resources and an increase in environmental pollution [40, 41]. Furthermore, industry is one of the development sectors that has the potential to damage the environment [42, 43]. In addition, renewable energy consumption contributes to reducing environmental degradation [44, 45]. Besides that, poverty causes environmental quality to deteriorate because environmental management does not pay attention to sustainability [46, 47].
Based on explanations from several relevant studies, the studies they conducted have not been analyzed simultaneously, so the novelty of this research fills the gaps in previous research. Novelty in terms of research focus, where this research analyzes three study focuses, namely income inequality, growth and environmental degradation, while no previous study has focused on discussing this issue in the lower middle income economies group in ASEAN. Furthermore, the novelty in terms of research methodology is applying a simultaneous equation approach because this research also considers several exogenous variables that influence income inequality, growth and environmental degradation. Therefore, the specific objectives and research questions in this research include; 1) What is the influence of growth, environmental degradation, unemployment, corruption, and human capital on income inequality? 2) What is the influence of income inequality, environmental degradation, human capital, capital investment, and net export on growth? And 3) What is the influence of income inequality, growth, number if industries, renewable energy consumption, and poverty on environmental degradation?
2.1 Data and variable
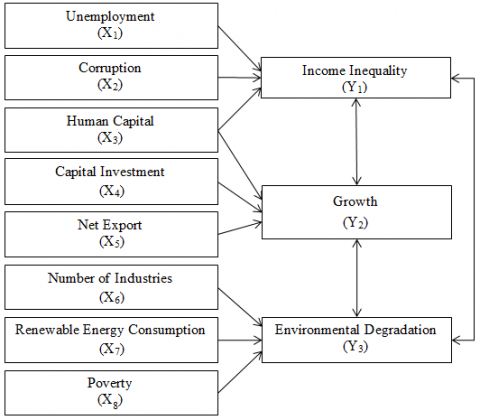
This research uses panel data, where the time series is 12 years for the period 2010 to 2021 and the cross section is the group of lower middle income economies in ASEAN (Indonesia, Vietnam, Laos, Cambodia and the Philippines). The data sources in this research were obtained from World Bank and Fred Economic Data. Then, as previously explained, this research involves three main variables and also considers the determinants of each of these variables, which are summarized in Figure 1.
More specifically, related to the size of each variable that has been determined in Figure 1, it can be described as follows:
Income Inequality $\left(\mathrm{Y}_1\right) \rightarrow$ measured using the Gini index indicator as the distribution of income among people in an economy deviates from a perfectly balanced distribution in the index, which is obtained from World Bank.
Growth $\left(\mathrm{Y}_2\right) \rightarrow$ measured using the annual GDP growth rate expressed in US dollars based on 2015 constant prices in percentage, which is obtained from the World Bank.
Environmental Degradation $\left(\mathrm{Y}_3\right) \rightarrow$ measured using carbon dioxide emissions originating from the combustion of solid, liquid and gas fuels in kilo tons, which is obtained from World Bank.
Unemployment $\left(\mathrm{X}_1\right) \rightarrow$ measured using the labor force that is not working but available to look for work as a percentage of the total labor force, which is obtained from Fred Economic Data.
Corruption $\left(\mathrm{X}_2\right) \rightarrow$ measured using CPIA transparency, accountability and corruption in the public sector ranking in the index, which is obtained from the World Bank.
Human Capital $\left(\mathrm{X}_3\right) \rightarrow$ measured using the human capital per capita index in percentage, which is obtained from Fred Economic Data.
Capital Investment $\left(\mathrm{X}_4\right) \rightarrow$ measured using the growth of gross capital formation or gross domestic investment in percentage, which is obtained from World Bank.
Net Export $\left(\mathrm{X}_5\right) \rightarrow$ measured using the value of all other market goods and services provided throughout the world less imports of goods and services represents the value of all other market goods and services received from around the world as a percentage of GDP, which is obtained from World Bank.
Number of Industries $\left(\mathrm{X}_6\right) \rightarrow$ measured using the annual growth rate of industry added value in percentage, which is obtained from World Bank.
Renewable Energy Consumption $\left(\mathrm{X}_7\right) \rightarrow$ measured using biofuel consumption to final energy consumption in percentage, which is obtained from World Bank.
Poverty $\left(\mathrm{X}_8\right) \rightarrow$ measured using the poverty ratio to the national poverty line in percentage, which is obtained from World Bank.
Figure 1. Research conceptual framework
2.2 Analysis model
This research uses a simultaneous equation model because based on the research conceptual framework in Figure 1, the types of variables used in this research consist of two types, namely endogenous and exogenous. Furthermore, each endogenous also becomes a determining variable for other endogenous. This research has three simultaneous equation models, which are summarized in Eqs. (1) to (3).
$\begin{aligned} & \log \left(\mathrm{Y}_{1 \mathrm{it}}\right)= \alpha_{1.0}+\alpha_{1.1} \mathrm{Y}_{2 \mathrm{it}}+\alpha_{1.2} \log \left(\mathrm{Y}_{3 \mathrm{it}}\right) \\ & \quad+\alpha_{1.3} \mathrm{X}_{1 \mathrm{it}} \\ &+ \alpha_{1.4} \log \left(\mathrm{X}_{2 \mathrm{it}}\right)+\alpha_{1.5} \mathrm{X}_{3 \mathrm{it}}+\varepsilon_{1 \mathrm{it}}\end{aligned}$ (1)
$\begin{gathered}\mathrm{Y}_{2 \mathrm{it}}=\alpha_{2.0}+\alpha_{2.1} \log \left(\mathrm{Y}_{1 \mathrm{it}}\right)+\alpha_{2.2} \log \left(\mathrm{Y}_{3 \mathrm{it}}\right) \\ +\alpha_{2.3} \mathrm{X}_{3 \mathrm{it}} \\ +\alpha_{2.4} \mathrm{X}_{4 \mathrm{it}}+\alpha_{2.5} \mathrm{X}_{5 \mathrm{it}}+\varepsilon_{2 \mathrm{it}}\end{gathered}$ (2)
where, $\alpha$: parameter, $i$: cross section, $t$: time series, $\varepsilon$: error term, log: used for variables whose units are not in percentages.
$\begin{aligned} \log \left(\mathrm{Y}_{3 \mathrm{it}}\right)= & \alpha_{3.0}+\alpha_{3.1} \log \left(\mathrm{Y}_{1 \mathrm{it}}\right)+\alpha_{3.2} \mathrm{Y}_{2 \mathrm{it}} \\ & +\alpha_{3.3} \mathrm{X}_{6 \mathrm{it}} \\ & +\alpha_{3.4} \mathrm{X}_{7 \mathrm{it}}+\alpha_{3.5} \mathrm{X}_{8 \mathrm{it}}+\varepsilon_{3 \mathrm{it}}\end{aligned}$ (3)
Based on Eqs. (1) to (3), it is not possible to get the numerical value of each parameter in each equation because these equations cannot be differentiated from observation or appear to be very similar to each other, so it is necessary to carry out an identification test because of the collection of coefficients. Different structures may fit the same set of data, in which case the following rules apply:
If K - k = m - 1, then the equation is identified
If K - k > m - 1, then the equation is over identified
If K - k < m - 1, then the equation is unidentified
where, $m$: number of endogenous variables in the equation, $\mathrm{K}$: number of exogenous variables in the model, $k$: number of exogenous variables in the equation.
Based on the identification test rules that have been explained, the identification test results for this research are summarized in Eqs. (4) to (6).
$\mathrm{Y}_1 \rightarrow \underset{5>2}{8-3>3-1}$ (4)
$\mathrm{Y}_2 \rightarrow \underset{5>2}{8-3>3-1}$ (5)
$\mathrm{Y}_3 \rightarrow \underset{5>2}{8-3>3-1}$ (6)
Based on the identification test, the simultaneous equation model used in this research is estimated using the Two Stage Least Square (TSLS) method because all equations are over identified. Specifically, TSLS includes structural equation analysis and one of the regression methods. In calculating regression analysis, this method is an extension of the Ordinary Least Square (OLS) method which is used when the correlation conditions between the errors produced in the model are correlated with the independent variables. This method is called TSLS because there are two stages which are basically an extension of the OLS method to solve equations so that there is no bias.
3.1 Determinants of income inequality in ASEAN lower middle income economies
Analysis of the income inequality equation and several determinants that influence it can be seen in Eq. (7).
$\begin{aligned} & \log \left(\mathrm{Y}_{1 \mathrm{it}}\right)=1.49^{* * *}-0.01 \mathrm{Y}_{2 \mathrm{it}}{ }^{* *} \\ & -0.10 \log \left(\mathrm{Y}_{3 i t}\right)^{* * *} \\ & +0.02 \mathrm{X}_{1 \mathrm{it}}{ }^{* * *}-0.03 \mathrm{X}_{2 \mathrm{it}}+0.69 \mathrm{X}_{3 \mathrm{it}}{ }^{* * *} \\ & * * * \text { significant at } \alpha=1 \%,{ }^* \text { significant at } \alpha=5 \% \\ & \end{aligned}$ (7)
First, growth $\left(\mathrm{Y}_2\right)$ has a negative and significant effect on income inequality $\left(\mathrm{Y}_1\right)$ in the lower middle income economies in ASEAN. When economic conditions improve, the demand for goods and services will also increase, which means companies will hire more workers to meet this demand. This will help reduce the unemployment rate and provide opportunities for people to increase their income. The results of this study are supported by the findings [22], they found that growth and income inequality are negatively related because the highest income groups receive a large share of labor income in the form of growth-sensitive payments. Based on these various explanations, the contribution of this research regarding the relationship between growth and income inequality is that governments in the lower middle income economies in ASEAN need to control the level of growth in an effort to reduce income inequality.
Second, environmental degradation $\left(\mathrm{Y}_3\right)$ has a positive and significant effect on income inequality $\left(\mathrm{Y}_1\right)$ in the lower middle income economies in ASEAN. High environmental degradation will increase income inequality because poor environmental quality is the most important issue for the lives of poor people in meeting their needs and supporting their lives. Furthermore, they also use the environment as a source of livelihood and, if the environment experiences high degradation, it will reduce their welfare and result in income inequality. The results of this research are supported by the findings [24], they found that environmental degradation is one of the factors driving income inequality, so that the active role of the government and society is needed to control it so that it does not impact social welfare. Based on these various explanations, the contribution of this research regarding the relationship between environmental degradation and income inequality is that governments in the lower middle income economies in ASEAN need to control environmental degradation as an effort to reduce income inequality.
Third, unemployment $\left(\mathrm{X}_1\right)$ has a positive and significant effect on income inequality $\left(\mathrm{Y}_1\right)$ in the lower middle income economies in ASEAN. The greater unemployment, the more groups of workers will have no income. Unemployment that is too large can reduce the wages of low-income groups so that income inequality becomes higher. Apart from that, a high unemployment rate also causes a decline in social welfare, and can even lead to income inequality between residents in a country. The results of this research are supported by the findings [26], they found that unemployment will increase the level of inequality among society. Based on these various explanations, the contribution of this research regarding the relationship between unemployment and income inequality is that governments in the lower middle income economies in ASEAN need to control unemployment as an effort to reduce income inequality.
Fourth, corruption $\left(\mathrm{X}_2\right)$ has a negative but not significant effect on income inequality $\left(\mathrm{Y}_1\right)$ in the lower middle income economies in ASEAN because all elements of society have agreed to eradicate corruption to tackle corruption. Community participation, cooperation between various institutions, governance, and the use of electronics in reporting activities contribute to efforts to make acts of corruption more difficult. The results of this research are supported by the findings [28], they found that educational inequality results in income inequality. Based on these various explanations, the contribution of this research regarding the relationship between corruption and income inequality is that governments in the lower middle income economies in ASEAN need to maintain the level of the corruption index so that it does not have the potential to cause income inequality. This is because increasing corruption tends to cause bad indications for a country's macroeconomic stability, including the potential for high income inequality.
Fifth, human capital $\left(\mathrm{X}_3\right)$ has a positive and significant effect on income inequality $\left(\mathrm{Y}_1\right)$ in the lower middle income economies in ASEAN. Improving the quality of education in ASEAN, especially in the lower middle income economies, still faces many challenges, so that the distribution of the education sector is not evenly distributed. The impact of educational inequality in the lower middle income economies in ASEAN is the low quality of education in villages, the low quality of human resources and the low opportunity to get a good education. This condition indicates that production efficiency is low and tends to continue the problem of poverty between generations. The results of this research are supported by the findings [30], they found that educational inequality results in income inequality. Based on these various explanations, the contribution of this research regarding the relationship between human capital and income inequality is that governments in the lower middle income economies in ASEAN need to distribute human capital evenly as an effort to reduce income inequality.
3.2 Determinants of growth in ASEAN lower middle income economies
Analysis of the growth equation and several determinants that influence it can be seen in Eq. (8).
$\begin{aligned} \mathrm{Y}_{2 \mathrm{it}}= & -2.60-0.09 \log \left(\mathrm{Y}_{1 \mathrm{it}}\right)^{* *}+0.07 \log \left(\mathrm{Y}_{3 \mathrm{it}}\right) \\ & +0.02 \mathrm{X}_{3 \mathrm{it}}+1.38 \mathrm{X}_{4 \mathrm{it}}{ }^{* * *}+0.01 \mathrm{X}_{5 \mathrm{it}}\end{aligned}$ (8)
*** significant at α=1%, ** significant at α=5%
First, income inequality $\left(\mathrm{Y}_1\right)$ has a negative and significant effect on growth $\left(\mathrm{Y}_2\right)$ in the lower middle income economies in ASEAN. Inequality in income distribution occurs because development prioritizes growth rather than equality. Growth continues to be driven to increase regional income and community welfare. However, due to differences in factors of capital ownership and skills in economic activity, the results of growth cannot be enjoyed equally by the entire community. Furthermore, income inequality in the lower middle income economies in ASEAN will reduce people's purchasing power for output in the form of goods or services. People's purchasing power is low, which will hinder economic activity in producing output. A hampered increase in output will result in hampered growth. The results of this research are supported by the findings [32], they found that the relationship between inequality and growth is negative and significant. Based on these various explanations, the contribution of this research regarding the relationship between income inequality and growth is that governments in the lower middle income economies in ASEAN need to control the level of income inequality as an effort to maintain growth stability.
Second, environmental degradation $\left(\mathrm{Y}_3\right)$ has a positive but not significant effect on growth $\left(\mathrm{Y}_2\right)$ in the lower middle income economies in ASEAN because renewable resource development has been carried out in ASEAN, such as The 6th ASEAN Energy Outlook (AEO6). AEO6 provides an overview of the current energy landscape with several possible scenarios for policymakers and stakeholders. This Outlook also examines how ASEAN can meet the energy needs of its growing economy and population until 2040 . One of the targets of ASEAN member countries is to increase the use of renewable energy components to 23 percent by 2025. The results of this research are supported by the findings [33], they found that there was a positive correlation between carbon emissions and growth but it was not significant because the use of the energy mix had been applied to final energy consumption. Based on these various explanations, the contribution of this research regarding the relationship between environmental degradation and growth is that the governments of the lower middle income economies in ASEAN, although the relationship is positive and not significant, the government for each country needs to set an optimal threshold level of environmental damage. towards accelerating growth. The contribution of environmental carrying capacity in the long term will have an impact on growth because the environment is continuously exploited and will cause the depletion of natural resources, especially those that cannot be renewed, which will threaten sustainability for future generations.
Third, human capital $\left(\mathrm{X}_3\right)$ has a positive but not significant effect on growth $\left(\mathrm{Y}_2\right)$ in the lower middle income economies group in ASEAN because improving the quality of education in ASEAN still has many challenges, especially in the lower middle income economies group, namely the issue of educational inequality. Educational inequality is inequality in the availability of infrastructure that supports the educational process and the quality of education between regions, which is related to inequality between regions and inequality between rural and urban areas. The impact of educational inequality in the lower middle income economies in ASEAN is the low quality of human resources, which also has an impact on the low productivity of human resources. In fact, education is an indicator that can influence growth which can increase people's income. The results of this research are supported by the findings [34], they found that educational inequality results in a low human development index, so it does not contribute to increasing growth. Based on these various explanations, the contribution of this research regarding the relationship between human capital and growth is that the governments of the lower middle income economies in ASEAN, although the relationship is positive and not significant, the governments of each country need to increase the quantity and quality of human capital in acceleration drives growth. The long-term contribution of human capital will have an impact on growth because quality human capital will play a role in determining the direction and strategy of growth.
Fourth, capital investment $\left(\mathrm{X}_4\right)$ has a positive and significant effect on growth $\left(\mathrm{Y}_2\right)$ in the lower middle income economies in ASEAN. Capital investment will result in increased production of goods and services in the economy, which will increase growth. Apart from that, increasing capital investment will also open up greater employment opportunities. In this way, the greater the output produced will be, so that this condition will encourage increased growth. The results of this research are supported by the findings [36], they found that the relationship between investment and growth is significantly positive because investment has been seen as a force that influences growth directly and indirectly over the last few decades. Based on these various explanations, the contribution of this research regarding the relationship between capital investment and growth is that governments in the lower middle income economies in ASEAN need to encourage capital investment as an effort to increase growth.
Fifth, net export$\left(\mathrm{X}_5\right)$ has a positive but not significant effect on growth $\left(\mathrm{Y}_2\right)$ in the lower middle income economies in ASEAN because export activities still rely on raw commodities, the competitiveness of export commodities is still low and many international trade plans have been postponed. This condition makes it difficult for potential export commodities to develop. There is a lack of export contribution in influencing growth and if you look at existing export commodities, they still rely on upstream industries or primary commodities whose productivity value, the added value of which is less significant in moving the wheels of the economy. Furthermore, this condition will have an impact on labor absorption and the ability to export while still using capital goods imported from abroad, so that the competitiveness of exports is also more or less influenced by the ability to import. This is what the government must improve so that the contribution of exports can be significant. in influencing growth. The results of this research are supported by the findings [38], they found that international trade has a positive independent effect on economic performance but is not significant. Based on these various explanations, the contribution of this research regarding the relationship between net exports and growth is that the governments of the lower middle income economies in ASEAN, although the relationship is positive and not significant, the government for each country needs to determine superior production from various sectors, which is not only for fulfillment in the domestic market but also for international markets. This is because exports are a source of external income for a country which plays a role in encouraging foreign exchange reserves to accelerate growth.
3.3 Determinants of environmental degradation in ASEAN lower middle income economies
Analysis of the environmental degradation equation and several determinants that influence it can be seen in Eq. (9).
$\begin{aligned} & \log \left(\mathrm{Y}_{3 \mathrm{it}}\right)=2.42^{* * *}+1.32 \log \left(\mathrm{Y}_{1 \mathrm{it}}\right)^{* * *} \\ & \quad+0.03 \mathrm{Y}_{2 \mathrm{it}}{ }^{* *} \\ & \quad+0.09 \mathrm{X}_{6 \mathrm{it}}{ }^{* * *}-0.09 \mathrm{X}_{7 \mathrm{it}}^{* * *}+0.02 \mathrm{X}_{8 \mathrm{it}}\end{aligned}$ (9)
*** significant at α=1%, ** significant at α=5%
First, income inequality $\left(\mathrm{Y}_1\right)$ has a positive and significant effect on environmental degradation $\left(\mathrm{Y}_3\right)$ in the lower middle income economies in ASEAN. Income inequality will encourage a decrease in the carrying capacity of the environment due to pressure on the environment, where rich people are increasingly motivated to pursue profits from the production processes they carry out because they use large amounts of natural input. Apart from that, pressure from poor communities is also increasing to meet their needs because they also use input from nature. The results of this research are supported by the findings [39], they found that efforts to achieve a fairer distribution of power and wealth in society will contribute to improving environmental quality. Based on these various explanations, the contribution of this research regarding the relationship between income inequality and environmental degradation is that governments in the lower middle income economies in ASEAN need to encourage reducing inequality as an effort to improve the carrying capacity of the environment.
Second, growth $\left(\mathrm{Y}_2\right)$ has a positive and significant effect on environmental degradation $\left(\mathrm{Y}_3\right)$ in the lower middle income economies in ASEAN. Conventional growth does not require lower middle income economies in ASEAN to reduce carbon emissions. This condition is not implemented because the implementation of conventional growth does not take into account environmental values, so it will result in an increase in temperature on the earth's surface which triggers global warming. Then, environmental conditions will get worse because growth is based on the extraction and exploitation of natural resources in the form of mining materials and forest products which are very vulnerable to fluctuations in prices of natural resource commodities on the international market. The rapid increase in prices and market demand for wood commodities, forest products, mining products and other natural resources has driven deforestation. The results of this research are supported by the findings [41], they found that growth drives an increase in carbon emissions. Based on these various explanations, the contribution of this research regarding the relationship between growth and environmental degradation is that governments in the lower middle income economies in ASEAN need to apply sustainable development, namely a series of economic activities that do not only focus on increasing output but also consider the environmental carrying capacity to overcome increased environmental damage.
Third, the number of industries $\left(\mathrm{X}_6\right)$ has a positive and significant effect on environmental degradation $\left(\mathrm{Y}_3\right)$ in the lower middle income economies in ASEAN. Economic activities carried out by the industrial sector will produce pollution from its production activities, which will tend to be environmentally unfriendly. The biggest impact of industrial pollution on the environment is decreasing air quality. With many small, medium and large industries emerging, air pollution has had an impact on increasing global warming. The results of this research are supported by the findings [42], they found that industry tends to have a positive impact on social life, but for the environment industry has many negative impacts such as water, pollution and air pollution. Based on these various explanations, the contribution of this research regarding the relationship between the number of industries and environmental degradation is that governments in the lower middle income economies in ASEAN need to implement environmental pollicies, especially regarding controlling industrial waste which has the potential to cause a decline in environmental quality.
Fourth, renewable energy consumption $\left(\mathrm{X}_7\right)$ has a negative and significant effect on environmental degradation $\left(\mathrm{Y}_3\right)$ in the lower middle income economies in ASEAN. The use of renewable energy in economic activities has a major impact on environmental quality. This condition is because renewable energy is a type of environmentally friendly energy because the use of renewable energy will reduce carbon emission levels in the atmosphere. By reducing carbon emissions in the atmosphere, the temperature of the planet Earth will tend to improve. The results of this research are supported by the findings [45], they found that it is important to develop hydro and nuclear power in China to overcome environmental degradation. Based on these various explanations, the contribution of this research regarding the relationship between renewable energy and environmental degradation is that governments in the lower middle income economies in ASEAN need to promote the use of renewable energy in the energy mix in maintaining the environmental carrying capacity of energy use emission levels.
Fifth, poverty $\left(\mathrm{X}_8\right)$ has a positive but not significant effect on environmental degradation $\left(\mathrm{Y}_3\right)$ in the lower middle income economies in ASEAN due to the acceleration of rural development which is reflected in the creation of a stronger economic structure, the availability of better infrastructure and facilities, and growing understanding. and public awareness of environmentally sound development. Based on these various policies, there has been a decline in poor people in the lower middle income economies in ASEAN who are very vulnerable to the use of natural resources to support daily life, so that natural resources are not exploited. The results of this research are supported by the findings [47], they found that environmental quality has decreased because poverty is a major problem in most developing countries but is not significant, however, poverty is one of the main sources of environmental damage in all countries. Based on these various explanations, the contribution of this research regarding the relationship between poverty and environmental degradation is that governments in the lower middle income economies in ASEAN, although the relationship is positive and not significant, governments in each country need to control the level of poverty in order to increase welfare. public. This is because the problem of poverty has the potential for environmental exploitation.
The findings in this research are based on the results of the analysis that has been carried out for the lower middle income economies in ASEAN, namely that reducing income inequality can be achieved through the role of growth, environmental degradation, unemployment and human capital. Then, increased growth can be achieved through the role of income inequality and capital investment. Furthermore, reducing environmental degradation can be achieved through the role of income inequality, growth, number of industries and renewable energy consumption.
The policy implications for income inequality include that the governments of lower middle income economies in ASEAN need to align and sharpen budgeting by the Ministry of Finance in order to distribute definite aid from the central government to regional governments. Uniform information can make the distribution of aid, both direct and indirect, more optimal and right on target. Then, the governments of lower middle income economies in ASEAN also need to carry out development in areas where inequality has been identified so that labor absorption, especially for local communities, can be met, so that the unemployment rate will be reduced and the level of inequality in income distribution can be overcome. Furthermore, governments of lower middle income economies in ASEAN also need to accelerate central government spending for programs to provide economic stimulus and regional spending in order to be able to encourage growth through creating as many jobs as possible to increase equality. Apart from that, the governments of lower middle income economies in ASEAN also need an active role from the ministry of education, including increasing access for school-aged children to have optimal opportunities according to their potential so that they are ready to participate in education at every level they undertake, so that it will improve their abilities and people's opportunities to earn income and decent work.
Policy implications for growth include that the governments of lower middle income economies in ASEAN need to uphold the function of stabilization, allocation and distribution, which focuses on equal distribution of income. All of these functions are important because economic development generally occurs as a result of government intervention, either directly or indirectly. Government intervention is needed in the economy to reduce the impact of income inequality on economic growth. Then, the governments of lower middle income economies in ASEAN also need cooperation between the ministry of education and the ministry of employment to work together to improve the quality of human resources and the quantity of jobs to encourage economic growth. The Ministry of Education strives to improve the quality of the population, such as programs to increase the average length of schooling and reduce the number of people dropping out of school. Apart from that, the Ministry of Manpower needs to increase the quantity of employment opportunities by increasing its investment in various sectors, such as infrastructure, health and education. Furthermore, collaboration between these policies will contribute to increasing output to encourage economic growth.
The policy implications for environmental degradation include that the governments of lower middle income economies in ASEAN need an active role from the coordinating ministry for the economy to implement equitable programs through sustainable development including equal distribution of the benefits of development results between generations, maintaining sustainable community welfare both now and in the future. Then, the governments of lower middle income economies in ASEAN also need to implement sustainable economic programs in a series of economic activities which aim to encourage public policies in creating a green economic system that balances economic growth and environmental protection by paying attention to the environmental carrying capacity. This program needs to be carried out so that every development can maintain good ecological function and access to renewable energy sources. Furthermore, governments of lower middle income economies in ASEAN also need to demand that industry actively participate in waste processing programs that they produce, namely conditions where the amount of residue released into the environment does not exceed the environmental capacity. To achieve this requires a transition from the energy system currently used to a clean energy system in order to achieve a state of balance between human activities and natural balance. Apart from that, governments of lower middle income economies in ASEAN also need to carry out energy conversion from upstream to downstream, which includes managing energy resources and all stages of exploration, production, transportation, distribution and utilization of energy.
[1] Amar, S., Pratama, I. (2020). Exploring the link between income inequality, poverty reduction and growth: An ASEAN perspective. International Journal of Innovation, Creativity and Change, 11(2): 24-41.
[2] Masud, M.M., Kari, F., Banna, H., Saifullah, M.K. (2020). Does income inequality affect environmental sustainability? Evidence from the ASEAN-5. In Climate Change Mitigation and Sustainable Development. Routledge. https://doi.org/10.1080/13547860.2018.1442146
[3] De Haan, J., Sturm, J.E. (2017). Finance and income inequality: A review and new evidence. European Journal of Political Economy, 50: 171-195. https://doi.org/10.1016/j.ejpoleco.2017.04.007
[4] Solt, F. (2020). Measuring income inequality across countries and over time: The standardized world income inequality database. Social Science Quarterly, 101(3): 1183-1199. https://doi.org/10.1111/ssqu.12795
[5] Trump, K.S. (2018). Income inequality influences perceptions of legitimate income differences. British Journal of Political Science, 48(4): 929-952. https://doi.org/10.1017/S0007123416000326
[6] Nguyen, C.P., Schinckus, C., Su, T.D., Chong, F.H.L. (2021). The influence of tourism on income inequality. Journal of Travel Research, 60(7): 1426-1444. https://doi.org/10.1177/0047287520954538
[7] Rubin, A., Segal, D. (2015). The effects of growth on income inequality in the US. Journal of Macroeconomics, 45: 258-273. https://doi.org/10.1016/j.jmacro.2015.05.007
[8] https://data.worldbank.org/, accessed on Jul. 10, 2023.
[9] Amar, S., Satrianto, A., Ariusni, Kurniadi, A.P. (2023). Shock response analysis of Indonesian macroeconomic variables. International Journal of Sustainable Development and Planning, 18(5): 1351-1363. https://doi.org/10.18280/ijsdp.180505
[10] Amar, S., Satrianto, A., Ariusni, Kurniadi, A.P. (2022). Determination of poverty, unemployment, growth, and investment in West Sumatra province. International Journal of Sustainable Development and Planning, 17(4): 1237-1246. https://doi.org/10.18280/ijsdp.170422
[11] Kennedy, T., Smyth, R., Valadkhani, A., Chen, G. (2017). Does income inequality hinder growth? New evidence using Australian taxation statistics. Economic Modelling, 65: 119-128. https://doi.org/10.1016/j.econmod.2017.05.012
[12] Balcilar, M., Gupta, R., Ma, W., Makena, P. (2021). Income inequality and growth: A re‐examination of theory and evidence. Review of Development Economics, 25(2): 737-757. https://doi.org/10.1111/rode.12754
[13] Ota, T. (2017). Growth, income inequality and environment: Assessing the applicability of the Kuznets hypotheses to Asia. Palgrave Communications, 3(1): 1-23. https://doi.org/10.1057/palcomms.2017.69
[14] Khan, S., Yahong, W., Zeeshan, A. (2022). Impact of poverty and income inequality on the ecological footprint in Asian developing economies: Assessment of Sustainable Development Goals. Energy Reports, 8: 670-679. https://doi.org/10.1016/j.egyr.2021.12.001
[15] Ehigiamusoe, K.U., Majeed, M.T., Dogan, E. (2022). The nexus between poverty, inequality and environmental pollution: Evidence across different income groups of countries. Journal of Cleaner Production, 341: 130863. https://doi.org/10.1016/j.jclepro.2022.130863
[16] Kurniadi, A.P., Aimon, H., Amar, S. (2022). Analysis of green growth, biofuel oil consumption, fuel oil consumption and carbon emission in Asia Pacific. International Journal of Sustainable Development and Planning, 17(7): 2247-2254. https://doi.org/10.18280/ijsdp.170725
[17] Wang, X., Xu, Z., Qin, Y., Skare, M. (2022). Foreign direct investment and growth: a dynamic study of measurement approaches and results. Economic Research-Ekonomska Istraživanja, 35(1): 1011-1034. https://doi.org/10.1080/1331677X.2021.1952090
[18] Adu, D.T., Denkyirah, E.K. (2019). Growth and environmental pollution in West Africa: Testing the environmental kuznets curve hypothesis. Kasetsart Journal of Social Sciences, 40(2): 281-288. https://doi.org/10.1016/j.kjss.2017.12.008
[19] Bouincha, M., Karim, M. (2018). Income inequality and growth: An analysis using a panel data. International Journal of Economics and Finance, 10(5): 242. https://doi.org/10.5539/ijef.v10n5p242
[20] Aguiar, M., Bils, M. (2015). Has consumption inequality mirrored income inequality? American Economic Review, 105(9): 2725-2756. https://doi.org/10.1257/aer.20120599
[21] Carvalho, L., Rezai, A. (2016). Personal income inequality and aggregate demand. Cambridge Journal of Economics, 40(2): 491-505. https://doi.org/10.1093/cje/beu085
[22] Wolde, M., Sera, L., Merra, T. M. (2022). Causal relationship between income inequality and growth in Ethiopia. Cogent Economics & Finance, 10(1): 2087299. https://doi.org/10.1080/23322039.2022.2087299
[23] Li, S. (2016). Income inequality and growth in China in the last three decades. The Round Table, 105(6): 641-665. https://doi.org/10.1080/00358533.2016.1246858
[24] Uzar, U., Eyuboglu, K. (2019). The nexus between income inequality and CO2 emissions in Turkey. Journal of Cleaner Production, 227: 149-157. https://doi.org/10.1016/j.jclepro.2019.04.169
[25] Chen, J., Xian, Q., Zhou, J., Li, D. (2020). Impact of income inequality on CO2 emissions in G20 countries. Journal of Environmental Management, 271: 110987. https://doi.org/10.1016/j.jenvman.2020.110987
[26] Pal, S., Villanthenkodath, M.A., Patel, G., Mahalik, M.K. (2022). The impact of remittance inflows on growth, unemployment and income inequality: An international evidence. International Journal of Economic Policy Studies, 1-25. https://doi.org/10.1007/s42495-021-00074-1
[27] Ogbeide, E.N.O., Agu, D.O. (2015). Poverty and income inequality in Nigeria: Any causality? Asian Economic and Financial Review, 5(3): 439. https://doi.org/10.18488/journal.aefr/2015.5.3/102.3.439.452
[28] Khan, S. (2022). Investigating the effect of income inequality on corruption: New evidence from 23 emerging countries. Journal of the Knowledge Economy, 13(3): 2100-2126. https://doi.org/10.1007/s13132-021-00761-6
[29] Yan, B., Wen, B. (2020). Income inequality, corruption and subjective well-being. Applied Economics, 52(12): 1311-1326. https://doi.org/10.1080/00036846.2019.1661953
[30] Sarkodie, S.A., Adams, S. (2020). Electricity access, human development index, governance and income inequality in Sub-Saharan Africa. Energy Reports, 6: 455-466. https://doi.org/10.1016/j.egyr.2020.02.009
[31] Novid, A., Sumarsono, H. (2018). Human development index, capital expenditure, fiscal desentralization to growth and income inequality in East Java Indonesia. Quantitative Economics Research, 1(2): 108-118. http://doi.org/10.17977/um051v1i22018p108-118
[32] Urbano, D., Aparicio, S., Audretsch, D. (2019). Twenty-five years of research on institutions, entrepreneurship, and growth: what has been learned? Small Business Economics, 53: 21-49. https://doi.org/10.1007/s11187-018-0038-0
[33] Aimon, H., Kurniadi, A.P., Amar, S. (2021). Analysis of fuel oil consumption, green growth and environmental degradation in 6 Asia Pacific countries. International Journal of Sustainable Development and Planning, 16(5): 925-933. https://doi.org/10.18280/ijsdp.160513
[34] Amar, S., Satrianto, A., Ariusni, Kurniadi, A.P. (2022). Determination of poverty, unemployment, growth, and investment in West Sumatra province. International Journal of Sustainable Development and Planning, 17(4): 1237-1246. https://doi.org/10.18280/ijsdp.170422
[35] Aimon, H., Putri, K.A., Ulfa, S.S. (2022). Employment opportunities and income analysis before and during COVID-19: Indirect least square approach. Studies in Business & Economics, 17(2): 5-22. https://doi.org/10.2478/sbe-2022-0022
[36] Kurniadi, A.P., Aimon, H., Amar, S. (2021). Determinants of biofuels production and consumption, green growth and environmental degradation in 6 asia pacific countries: A simultaneous panel model approach. International Journal of Energy Economics and Policy, 11(5): 460-471. https://doi.org/10.32479/ijeep.11563
[37] Mahmoodi, M., Mahmoodi, E. (2016). Foreign direct investment, exports and growth: Evidence from two panels of developing countries. Economic Research-Ekonomska Istraživanja, 29(1): 938-949. https://doi.org/10.1080/1331677X.2016.1164922
[38] Uddin, H., Khanam, M.J. (2017). Import, export and growth: The case of lower income country. Journal of Business and Management, 19(1): 37-42. https://doi.org/10.9790/487X-1901053742
[39] Liu, C., Jiang, Y., Xie, R. (2019). Does income inequality facilitate carbon emission reduction in the US? Journal of Cleaner Production, 217: 380-387. https://doi.org/10.1016/j.jclepro.2019.01.242
[40] Aimon, H., Kurniadi, A.P., Triani, M. (2022). Determination of natural gas consumption and carbon emission in natural gas supplying countries in Asia Pacific. International Journal of Energy Economics and Policy, 12(6): 96-101. https://doi.org/10.32479/ijeep.13536
[41] Mirza, F.M., Kanwal, A. (2017). Energy consumption, carbon emissions and growth in Pakistan: Dynamic causality analysis. Renewable and Sustainable Energy Reviews, 72: 1233-1240. https://doi.org/10.1016/j.rser.2016.10.081
[42] Zhang, N., Zhou, P., Kung, C.C. (2015). Total-factor carbon emission performance of the Chinese transportation industry: A bootstrapped non-radial Malmquist index analysis. Renewable and Sustainable Energy Reviews, 41: 584-593. https://doi.org/10.1016/j.rser.2014.08.076
[43] Zhang, Y.J., Da, Y.B. (2015). The decomposition of energy-related carbon emission and its decoupling with growth in China. Renewable and Sustainable Energy Reviews, 41: 1255-1266. https://doi.org/10.1016/j.rser.2014.09.021
[44] Aimon, H., Kurniadi, A.P., Amar, S. (2023). Scenario of reducing carbon emission through shifting consumption of non-renewable energy to renewable energy in Asia pacific 2023-2030. In IOP Conference Series: Earth and Environmental Science, 1151(1): 012016. https://doi.org/10.1088/1755-1315/1151/1/012016
[45] Long, X., Naminse, E.Y., Du, J., Zhuang, J. (2015). Nonrenewable energy, renewable energy, carbon dioxide emissions and growth in China from 1952 to 2012. Renewable and Sustainable Energy Reviews, 52: 680-688. https://doi.org/10.1016/j.rser.2015.07.176
[46] Bruckner, B., Hubacek, K., Shan, Y., Zhong, H., Feng, K. (2022). Impacts of poverty alleviation on national and global carbon emissions. Nature Sustainability, 5(4): 311-320. https://doi.org/10.1038/s41893-021-00842-z
[47] Khan, S.A.R. (2019). The nexus between carbon emissions, poverty, growth, and logistics operations-empirical evidence from southeast Asian countries. Environmental Science and Pollution Research, 26(13): 13210-13220. https://doi.org/10.1007/s11356-019-04829-4