Hanani Farhah Harun*![]() | Maharani Abu Bakar
| Maharani Abu Bakar![]() | Mimi Hafizah Abdullah
| Mimi Hafizah Abdullah![]()
© 2024 The authors. This article is published by IIETA and is licensed under the CC BY 4.0 license (http://creativecommons.org/licenses/by/4.0/).
OPEN ACCESS
Portfolio weights often exhibit instability when positioning is based on expected returns estimated using historical data, with the normal distribution assumption in many models proving irrelevant for swift investor decision-making. To address these shortcomings, this study introduces a methodology incorporating asset information through implied volatility and a median-variance approach. The latter, notable for its flexibility in application without relying on normal-distribution assumptions, guides the construction of portfolios through stock ranking determined by implied volatility. This research employs the semiparametric option model of Extended Generalized Leland (EGL) to estimate implied volatility for stock selection, focusing on the Dow Jones Industrial Average (DJIA) index. The preselection phase integrates risk premiums into the model, with the resulting subset of stocks subject to various strategies considering short-selling and zero-correlation constraints to accommodate broader investment strategies setting of environmental, social, and governance (ESG). The findings reveal that the information derived from the median-variance approach significantly enhances portfolio selection, leading to markedly higher Sharpe ratios, increased returns, and reduced volatility. By providing a robust, flexible, and data-driven approach to portfolio selection, our methodology not only offers investors a means to make informed decisions but also holds the potential to guide sustainable investments.
portfolio optimization, median-variance portfolio, semiparametric option pricing, implied volatility, transaction cost, short selling, zero correlation
Market participants continue to seek the most effective strategy for constructing optimal asset allocation models, such as the Capital Asset Pricing Model (CAPM) and classical mean-variance analysis. However, existing models often rely heavily on historical price data, leading to limitations in portfolio optimization strategies. Theoretical advancements in portfolio optimization, particularly since Markowitz's seminal work [1], have spurred interest in alternative approaches that can better capture market dynamics and improve portfolio performance.
While many studies have explored the use of historical return data to approximate optimal portfolios [2-5], these approaches often exhibit poor out-of-sample performance and are susceptible to estimation biases [2, 4, 6, 7]. Even forward-looking approaches struggle to outperform simple heuristic strategies like the naïve 1/N portfolio, especially in portfolios with a large number of assets [8]. This study is motivated by the persistent underperformance of portfolios constructed using traditional methods, highlighting the need for alternative approaches that can mitigate these challenges.
The main challenge in the classical model of optimization analysis is obtaining high-quality historical data to perform a thorough analysis. Nowadays, researchers have taken a different direction by using data of option prices. Similar studies use forward-looking data to solve portfolio optimization models [4, 9-11]. In fact, several studies have demonstrated that the use of higher-order moments or additional information can address this issue [12, 13].
The previous findings are largely based on simulations or historical data. Thus, this study is one of a series of studies that attempt to focus on the information implied by options in solving the portfolio optimization problem. The semiparametric option pricing models are based on the extended models of Leland [14, 15] applied in a model-free framework developed by Bakshi et al. [16]. This model-based nonparametric framework is referred to as Extended Generalized Leland (EGL) models in this study. New option-implied adjusted information (volatility) is generated based on the EGL function. The models are assumed to reduce the model misspecification errors caused by the Leland models while eliminating the infeasible pricing problems in the model-free framework.
Most methods assume that the data are normally distributed, although this is often not the case. The assumption of a normal distribution of returns is not always relevant for investors in making quick investment decisions. Assuming a normal distribution of returns does not accurately reflect the true distribution of asset returns in financial markets. In reality, financial data often exhibit characteristics such as skewness, kurtosis, and fat tails, which deviate from the normal distribution assumption. This can lead to misestimation of risk and potentially flawed investment decisions, as the normal distribution assumption may underestimate the likelihood of extreme events or outliers. Therefore, relying solely on models that assume normality can result in suboptimal portfolio allocations and increased exposure to unexpected market fluctuations.
Instead, the median-variance approach can be implemented without the requirement that the data be normally distributed. The flexibility of this approach makes it an effective strategy, yet it has not been demonstrated that a portfolio constructed using the median-variance approach improves portfolio performance when compared to other alternatives.
In fact, some investors prefer tilting their portfolios in response to the shifting environment of portfolios, including Hussain and Goswami [17]. Even though that is not the primary emphasis of this study, the implied information provided in the model is a useful proxy for asset information and can provide a more comprehensive picture of the market.
To address these concerns, we propose a novel methodology of semiparametric pricing model that leverages option-implied information and the median-variance approach to enhance portfolio optimization strategies. By incorporating information implied from option prices, we aim to overcome the limitations of relying solely on historical data and biased estimation techniques. Our study seeks to empirically investigate whether integrating semiparametric option-implied information and the flexible median-variance approach can lead to improved portfolio performance where model preselection is applied. The research question and research objective are aligned as in Table 1.
Table 1. Summary of research direction
|
Issue |
Research Questions |
Research Objectives |
|
Portfolio that is based on historical-data estimation has been found to be poorly performed out-of-sample under normal distribution assumption. No single model outperforms the 1/N naïve portfolio due to biased estimation. |
How does the option-implied information adjusted from the EGL models under median-variance approach that do not rely on the assumption of a normal distribution improve asset allocation strategies? |
To evaluate the performance of portfolios constructed using option-adjusted information implied from the EGL model under median-variance approach. |
The EGL model functions act as an essential link connecting two distinct approaches in financial modeling: the parametric framework represented by the Leland models and the non-parametric framework exemplified by the Bakshi-Kapadia-Madan framework. By blending elements from both methodologies, the EGL model presents a unique semiparametric solution that strikes a balance between flexibility and structure.
Drawing from the foundational principles of the Leland models and the comprehensive framework outlined by Bakshi et al. [16], the EGL model incorporates crucial features such as transaction costs and rebalancing intervals. These integrations enhance the model's realism and practical applicability, ensuring that it accurately captures the complexities of real-world financial markets. In essence, these models generate option-implied adjustments, offering a more accurate representation of market dynamics while addressing model misspecifications.
Moreover, our study incorporates the median-variance approach, which offers flexibility without the restrictive assumption of normality in data distribution. Despite its potential, the effectiveness of portfolios constructed using this approach remains underexplored. Our research fills this gap by empirically evaluating the performance of portfolios constructed via the EGL models and median-variance approach.
Our contributions to the literature are twofold: Firstly, we introduce a novel methodology that integrates option-implied information and the median-variance approach, offering a more robust and flexible portfolio optimization strategy. Secondly, we demonstrate the applicability of this approach across diverse investment scenarios, particularly emphasizing its relevance in environments where normal distribution assumptions may not hold.
By providing a robust, flexible, and data-driven approach to portfolio selection, our methodology not only offers investors a means to make informed decisions but also holds the potential to guide sustainable investments. Recognizing the increasing importance of sustainability in financial markets, our innovative approach could aid governments in aligning investment strategies with broader environmental, social, and governance (ESG) goals. This paper thus not only advances the field of portfolio optimization but also highlights the broader societal impact of adopting such approaches in emerging markets. We believe that by integrating sustainability considerations, our methodology can assist in shaping more responsible and resilient investment practices, contributing to a more sustainable and equitable future.
Four sections are formed in this study. The first two sections describe brief background information of this study, followed by an overview of prior literature on portfolio optimization strategies. The data used is elaborated in Section 3. Section 4 explains the research methodology in investigating each portfolio optimization strategy. The main findings of this part of the study are recorded in Section 5. This study evaluates three types of basic portfolios which comprise of mean-variance portfolio, minimum-variance portfolio and median-variance portfolio as well as its combinations with a total of 36 portfolio strategies are considered in each part of the investigation. Three (3) variants of portfolios are investigated, which are the classical portfolios, short-selling portfolios and zero-correlation portfolios. We conclude in Section 6.
Portfolio optimization plays a crucial role in investment decision-making. Traditionally, mean-variance and minimum-variance strategies, pioneered by Markowitz [1], have been widely used. However, these methods suffer from a critical flaw: they assume normally distributed asset returns. Consequently, its effectiveness may diminish in the face of non-normal return distributions and uncertain parameter estimates. This assumption often crumbles in the face of real-world market complexities, characterized by fat tails, skewness, and heavy volatility clusters [18, 19]. As a result, they lead to biased estimations and suboptimal performance, as highlighted by Demiguel et al. [2] and Jacobs et al. [3] in their out-of-sample studies.
Recognizing this limitation, researchers have proposed diverse approaches for enhanced portfolio optimization. Some researchers, like Ledoit and Wolf [20] and Fang and Post [21], have focused on improved parameter estimation through shrinkage estimators or structured data generating processes inspired by Sharp [22] and Çela et al. [23].
Shrinkage estimators, proposed by researchers such as Ledoit and Wolf [20], aim to strike a balance between sample estimates and prior information. By incorporating external knowledge, these estimators mitigate the bias inherent in purely data-driven estimates. Despite the advancements, these methods still lack comprehensive empirical validation across various market conditions. Similarly, Fang and Post's improved Shrinkage Estimators with robustness to outliers require further empirical validation across different asset classes to ascertain their effectiveness. Their robustness across diverse market conditions remains a critical concern.
Studies such as Jacobs et al. [5] have highlighted the limitations of mean-variance strategies in real-world scenarios. However, there remains a gap in validation across different market regimes, limiting the generalizability of their findings.
Inspired by Sharp [22] and Çela et al. [23], structured data generating processes, on the other hand, offer an alternative to traditional parameter estimation. These approaches leverage additional information beyond historical returns, potentially improving parameter accuracy. Yet, identifying the optimal structure remains challenging. How sensitive are these processes to model misspecification? Can they adapt dynamically to changing market regimes? These questions highlight the need for rigorous empirical testing.
Researchers like Golosnoy and Gribisch [24] advocate for incorporating specific risk measures into portfolio construction. Metrics such as Value at Risk (VaR) and Conditional Value at Risk (CVaR) capture tail risk and extreme events. However, their performance during market stress and across different asset classes warrants scrutiny. It is unclear if they are strong enough to manage a variety of portfolios, particularly ones with intricate dependencies.
Others, like Golosnoy and Gribisch [24], have incorporated specific risk measures, while studies [25-30] have catered strategies to different investor risk preferences. These studies emphasize accounting for tail risk and skewness. These non-normal features significantly impact portfolio behavior.
Bayesian approaches inject uncertainty into portfolio optimization. Barry [31] and Chen and Brown [32] pioneered the use of Bayesian methodologies to introduce uncertainty and enhance risk incorporation. However, the sensitivity of portfolio allocations to the choice of prior distributions remains a central concern. Moreover, scalability to high-dimensional problems—common in real-world portfolios—requires careful consideration.
Many prior studies in portfolio optimization have encountered challenges stemming from a lack of thorough empirical validation across various market conditions, especially when dealing with non-normal distributions. These limitations have hindered the effectiveness of existing methodologies in accurately capturing the complexities of real-world financial markets. In response to these gaps in the literature, this study seeks to overcome these challenges by introducing a novel framework known as the Extended Generalized Leland (EGL) models.
The EGL models represent a synthesis of existing approaches, combining elements from both parametric and non-parametric frameworks to offer a more robust and flexible solution to portfolio optimization. By leveraging option-implied information derived from EGL models, this study aims to enhance asset allocation strategies and improve portfolio performance.
Table 2. Synthesis of existing approaches
|
Approach |
Existing Literature |
Findings |
Limitations |
|
|
Mean-Variance |
[1] |
Pioneered the concept of efficient portfolios based on risk-return trade-offs. |
Assumes normally distributed returns; sensitive to input parameters. |
|
|
Parameter estimation |
Shrinkage estimators |
[20] |
Improved parameter estimation by incorporating prior information. |
Limited empirical validation across diverse market conditions. |
|
Improved shrinkage estimators |
[21] |
Proposed shrinkage estimators with robustness to outliers. |
Empirical validation is needed across various asset classes. |
|
|
Structured data generating - out-of-sample performance |
[5] |
Demonstrated limitations of mean-variance strategies in real-world scenarios. |
Limited validation across different market regimes. |
|
|
Risk measure incorporation |
Specific risk measures |
[24] |
Introduced risk measures (e.g., VaR, CVaR) to capture tail risk. |
Performance during extreme market stress not fully explored. |
|
Tail risk and skewness |
[25] |
Highlighted the impact of non-normality on portfolio behavior. |
Lack of consensus on optimal skewness-adjusted models. |
|
|
Non-normality measures |
[29] |
Investigated alternative risk measures beyond VaR and CVaR. |
Lack of consensus on the most appropriate non-normality measure. |
|
|
Bayesian |
Bayesian estimation |
[31] |
Bayesian methods allow for incorporating prior beliefs. |
Sensitivity to choices of prior distributions; scalability challenges. |
|
Bayesian portfolio optimization |
[30] |
Extended Bayesian approaches to handle high-dimensional portfolios. |
Computational complexity and scalability challenges. |
|
To provide clarity on the integration of EGL models and their implications for portfolio optimization, a summary of the synthesis of existing approaches is presented in Table 2. This table serves as a reference point for understanding how the EGL models address the limitations of previous studies and contribute to advancing the field of portfolio optimization.
While these advancements from existing studies represent considerable progress, this study pushes the boundaries even further by examining two key innovations: (1) option-implied information and (2) median-variance approach. The option-implied information, extracted through the EGL semiparametric model, leverages both implied volatility and risk premium for informed stock selection [4], potentially leading to more robust decision-making. Additionally, the median-variance approach offers a robust alternative as it bypasses the normality assumption and exhibits resilience to outliers, characteristics crucial for navigating real-world data [33-35]. Existing studies often focus solely on historical data, but our approach bridges the gap between past observations and future expectations.
This study not only addresses traditional method limitations but also explores the potential synergies between these innovative approaches and realistic constraints, such as short-selling and zero-correlation, building upon the framework proposed by Jagannathan and Ma [36]. By doing so, this research seeks to achieve improved returns and reduced risks for investors, particularly in unpredictable market environments. This focus aligns with recent studies [37-39], which highlight the importance of realistic constraints and robust risk estimation for optimal portfolio construction.
Ultimately, the findings of this research have the potential to offer valuable insights for portfolio optimization, empowering investors to make informed decisions and navigate complex market dynamics. This pursuit resonates with the broader goals of research by Zhang et al. [40] and Wang et al. [41], which emphasize the need for data-driven and market-adaptive approaches to achieve sustainable investment success.
This study analyzed call and put options for the DJIA index between January 2009 and December 2019. The data collection period specifically ranged from September 2017 to December 2019. While not the most recent data, this period offered a stable and diverse testing ground for our proposed methodology. The choice of the DJIA index ensured representativeness, and the long-term data ensured reliable and robust results, allowing us to focus on developing a flexible approach applicable across various data periods and market conditions.
Despite not targeting the most recent data, our methodology holds significant potential for emerging markets. Often plagued by limited and unreliable historical data, these markets can benefit from our approach's reliance on implied volatility and median-variance selection. Additionally, our methodology isn't constrained by the traditional normal distribution assumption, making it adaptable to the unique market conditions often present in emerging economies. The improved risk-adjusted returns observed in the DJIA study suggest similar potential for emerging market indices, leading to more informed investment decisions and potentially better returns for investors.
To ensure an error-minimized sample for our study, we implemented several sampling procedures adopted from previous literature. The following sampling procedure was applied to exclude any problematic daily option prices:
Observations violating the put-call parity boundary condition, which ensures arbitrage-free pricing, were omitted. This condition ensures that the call and put prices adhere to specific upper and lower bounds based on the underlying asset's price, exercise price, risk-free rate, and dividend yield [16, 42-44].
Only observations with 30 days left to maturity were included in the sample, in line with DeMiguel et al. [4]. This selection criterion aimed to prevent disturbances from immediate trading before expiration and avoid bias introduced by short-term options [42-45].
Observations with zero exercise prices or zero bid-ask spreads were removed, along with those with null transaction prices. Additionally, options with absolute delta values greater than 0.5 or less than 0.02 were excluded to minimize synchronicity issues [46, 47].
Furthermore, the closing time mismatch between DJX options and its underlying index induced a non-synchronous closing price problem. This was addressed by sampling the option contract on the next nearest business day instead of relying solely on the closing prices. Previous literature recommends using intra-daily time-stamped intraday prices for both options and their underlying indices to mitigate this issue [42, 43]. Despite potential challenges in finding options traded on the same day, leveraging the active trading nature in the CBOE option market facilitated this process.
Overall, while the data period might not be the latest, it successfully served our research goals of developing and testing a robust, flexible, and data-driven methodology for portfolio optimization. This methodology, particularly valuable in emerging markets facing data limitations, can empower investors to unlock new opportunities and achieve improved risk-adjusted returns.
This study explores the potential of option-implied information, extracted through the Extended Generalized Leland (EGL) models, to enhance sustainable stock portfolio performance. We investigate whether incorporating market expectations gleaned from option pricing, while accounting for risk premium, can lead to more resilient and rewarding portfolios within the context of sustainable investing.
Our analysis spans three portfolio categories: classical (unconstrained), short-selling, and zero-correlation. The short-selling portfolio incorporates the constraint of allowing positions to fall below zero, while the zero-correlation portfolio enforces zero correlation between assets. Within each category, we further assess three fundamental portfolio construction approaches: mean-variance, minimum-variance, and median-variance, resulting in a total of 36 distinct strategies for evaluation.
These strategies were tested using real data obtained from the options market for the DJIA index. Historical option prices and relevant market parameters were used to construct and simulate the portfolios over the specified time period.
The inclusion of real data ensures that our analysis reflects actual market conditions and dynamics, allowing for more meaningful insights and conclusions. By testing the portfolio strategies on real data, we aimed to provide practical and actionable recommendations for investors seeking to optimize their portfolios in real-world scenarios.
To provide a baseline for comparison, we utilize the naïve 1/N portfolio, where equal weight is assigned to each asset. To assess performance, we employ three key metrics: portfolio return, portfolio standard deviation (risk), and the Sharpe Ratio (risk-adjusted return).
Portfolios constructed using the EGL-derived adjusted information are designated as Portfolios with Option-implied Adjusted Information (POAI), while those without it are labeled Portfolios with No Option-implied Adjusted Information (PNOAI). A detailed breakdown of these portfolio variants and the overall methodological process is provided in Section 4.1 of the paper, further illustrated by the process chart presented in Figure 1.
Figure 1. Process flow of asset allocation strategies
4.1 The Extended Generalized Leland function
This study proposes the Extended Generalized Leland (EGL) models, encompassing both the Generalized Leland-Infused (GLI) and the model-free implied Leland (MFIL) approaches. Both address the limitation of existing model-free frameworks by incorporating transaction costs. The EGL model acts as a bridge between parametric (Leland models) and non-parametric (Bakshi-Kapadia-Madan) frameworks, offering a semiparametric solution. Derived from both Leland models and the framework by Bakshi et al. [16], it integrates features like transaction costs and rebalancing intervals.
The key difference between the GLI and MFIL models lies in their treatment of initial trading costs. While GLI focuses on post-trade costs like transaction fees and rebalancing, MFIL additionally factors in the initial investment cost. Both models are applied to "All-Cash" and "All-Stock" scenarios, leading to four variants designated as MFIL All-Cash, MFIL All-Stock, GLI All-Cash and GLI All-Stock models.
In our study, the EGL models were applied to extract option-implied information by incorporating transaction costs and rebalancing intervals into the calculation of implied volatilities. The GLI model directly calculates calls and puts option prices using Leland's adjusted function, resulting in new option-implied volatilities. On the other hand, the MFIL approach utilizes call and put option prices directly from Leland models and feeds them into the semiparametric framework.
To ensure accuracy and reliability, the EGL models were calibrated and validated using historical options data. This involved estimating model parameters, such as transaction costs and rebalancing intervals, and testing the models' performance against observed market prices and implied volatilities.
The function of extended generalized model-free implied volatility was utilized in this research based on the design developed by Harun and Abdullah [48] as follows:
$E G=\frac{-k}{\sqrt{2 \pi \cdot \Delta \tau}}+\sqrt{\frac{k^2}{\pi \cdot \Delta \tau}-2\left(\mu^2-e^{r \tau} \cdot V\right)}$ (1)
The notations are defined as:
V is the variance contract;
k is the round-trip transaction cost rate per unit dollar of transaction;
∆τ is the time between hedging adjustment, i.e., the rebalancing interval.
To address the limitations of the existing MFBKM model, the semiparametric model was modified by incorporating several additional parameters: transaction cost rate and rebalancing interval. Notably, the transaction cost function from the Leland models was integrated into this framework.
4.2 Portfolio selection strategies
This study investigates the effectiveness of incorporating option-implied information in portfolio optimization, focusing on portfolios that comprise both risk-free and risky assets. Portfolio weights for each asset, denoted by wi, are optimized using various models described in Table 3. The naïve 1/N portfolio serves as the benchmark.
Table 3. Asset allocation model
|
No. |
Model |
Abbreviation |
|
Naïve portfolio |
||
|
1 |
1/N |
1N |
|
Classical portfolios |
||
|
2 |
Mean-variance |
MV |
|
3 |
Minimum-variance |
Min |
|
4 |
Median-variance |
Med |
|
5 |
Mean-variance and minimum-variance |
MV-Min |
|
6 |
Mean-variance and median-variance |
MV-Med |
|
7 |
Minimum-variance and median-variance |
Min-Med |
|
8 |
1/N and mean-variance |
1N-MV |
|
9 |
1/N and minimum-variance |
1N-Min |
|
10 |
1/N and median-variance |
1N-Med |
|
11 |
1/N, mean-variance, and median-variance |
1N-MV-Med |
|
12 |
1/N, minimum-variance, and median-variance |
1N-Min-Med |
|
13 |
1/N, mean-variance, minimum-variance, and median-variance |
1N-MV-Min-Med |
|
|
Short-selling portfolios |
|
|
14 |
Mean-variance with short-selling assumption |
MV-C |
|
15 |
Minimum-variance with short-selling assumption |
Min-C |
|
16 |
Median-variance with short-selling assumption |
Med-C |
|
17 |
Mean-variance and minimum-variance with short-selling assumption |
MV-Min-C |
|
18 |
Mean-variance and median-variance with short-selling assumption |
MV-Med-C |
|
19 |
Minimum-variance and median-variance with short-selling assumption |
Min-Med-C |
|
20 |
1/N and mean-variance with short-selling assumption |
1N-MV-C |
|
21 |
1/N and minimum-variance with short-selling assumption |
1N-Min-C |
|
22 |
1/N and median-variance with short-selling assumption |
1N-Med-C |
|
23 |
1/N, mean-variance, and median-variance with short-selling assumption |
1N-MV-Med-C |
|
24 |
1/N, minimum-variance, and median-variance with short-selling assumption |
1N-Min-Med-C |
|
25 |
1/N, mean-variance, minimum-variance, and median-variance with short-selling assumption |
1N-MV-Min-Med-C |
|
Zero-correlation portfolio |
||
|
26 |
Mean-variance with zero-correlation assumption |
MV-ZC |
|
27 |
Minimum-variance with zero-correlation assumption |
Min-ZC |
|
28 |
Median-variance with zero-correlation assumption |
Med-ZC |
|
29 |
Mean-variance and minimum-variance with zero-correlation assumption |
MV-Min-ZC |
|
30 |
Mean-variance and median-variance with zero-correlation assumption |
MV-Med-ZC |
|
31 |
Minimum-variance and median-variance with zero-correlation assumption |
Min-Med-ZC |
|
32 |
1/N and mean-variance with zero-correlation assumption |
1N-MV-ZC |
|
33 |
1/N and minimum-variance with zero-correlation assumption |
1N-Min-ZC |
|
34 |
1/N and median-variance with zero-correlation assumption |
1N-Med-ZC |
|
35 |
1/N, mean-variance, and median-variance with zero-correlation assumption |
1N-MV-Med-ZC |
|
36 |
1/N, minimum-variance, and median-variance with zero-correlation assumption |
1N-Min-Med-ZC |
|
37 |
1/N, mean-variance, minimum-variance, and median-variance with zero-correlation assumption |
1N-MV-Min-Med-ZC |
Specifically, the mean-variance approach follows Markowitz [1] by formulating a quadratic optimization problem. This model balances two key factors: maximizing expected return (Eq. (2)) while minimizing portfolio risk (Eq. (3)), subject to constraints Eq. (4).
$\operatorname{Min} \sigma_p^2=\sum_{i=1}^n \sum_{j=1}^n w_i \cdot w_j \cdot \operatorname{Cov}_{i, j}$ (2)
$\sum_{i=1}^n w_i=1, w_i \geq 0$ (3)
$R_p=\sum_{i=1}^n w_i r_j$ (4)
in which, Rp is a portfolio return and $\sigma_p^2$ is a portfolio risk. In addition, in each asset i, wi is the investment weight and ri is the average rate of return. In any given asset i and j, Covi,j is the covariance between asset i and asset j. The number of assets in the portfolio was represented by n. The mean-variance portfolio can be reduced into the minimum-variance if the assumption of equal mean returns of portfolio, Rp, on all assets was imposed.
In contrast, the median-variance strategy departs from the mean-variance approach by substituting the mean with the median in Eq. (4). This change aims to better reflect the realities of the stock market where skewed return distributions and outliers are more common [32]. The median-variance model is described in Eqs. (5)-(7).
$\operatorname{Min} \sigma_p^2=\sum_{i=1}^n \sum_{j=1}^n w_i \cdot w_j \cdot \operatorname{Cov}_{i, j}$ (5)
$\tilde{R}_p=\sum_{i=1}^n w_i \cdot \bar{r}_j$ (6)
$\sum_{i=1}^n w_i=1, w_i \geq 0$ (7)
where, $\bar{r}_j$ is the median return rate of asset i. The only difference between mean-variance and median-variance is the portfolio return equation, $\tilde{R}_p$, explained by Eq. (6).
While both mean-variance and median-variance optimization aim to balance expected return and risk, they differ in how they handle potential outliers and deviations from normality. The mean-variance approach uses the mean return in its calculations, making it susceptible to extreme values that might not accurately represent the typical investment experience. On the other hand, the median-variance approach utilizes the median return, which is less sensitive to outliers and offers a more robust measure of central tendency for skewed data, often encountered in real-world markets. While seemingly a subtle change, replacing the mean with the median in the portfolio return Eq. (6) leads to fundamentally different risk-return profiles and portfolio compositions. This seemingly simple modification significantly alters the optimization process, resulting in potentially diverse portfolio constructions across the two methods.
4.3 Historical Volatility Risk Premium (HVRP)
This study utilizes the Historical Volatility Risk Premium (HVRP) to quantify the market's compensation for holding risky assets. HVRP estimation is conducted monthly, aligning with the fixed 30-day option maturity period established at the outset of the research. This choice of maturity follows Demiguel et al. [49] and Harun and Abdullah [48].
For this objective measure, we begin by assuming a proportional relationship between the volatility risk premium magnitude and the overall volatility level. Consequently, the HVRP is estimated as the ratio of average implied volatilities to realized volatilities for each individual stock.
The HVRP was estimated over the T + Δt trading days, in which:
$H V R P_t=\frac{\sum_{t-T-\Delta t+1}^{T-\Delta t} M F I A V_{i, i+\Delta t}}{\sum_{t-T-\Delta t+1}^{T-\Delta t} R V_{i, i+\Delta t}}$ (8)
MFIAV indicated the option-implied volatility adjusted from the EGL models, whereas the realized volatility was denoted by RV.
Having estimated the volatility risk premium (HVRP) as suggested by Demiguel et al. [49] and Harun and Abdullah [50], we applied it to correct the option-implied volatility derived from the EGL models. This correction aims to account for the market's compensation for bearing volatility risk, ensuring our analysis reflects realistic investor expectations. We hypothesize that incorporating this refined volatility measure into the portfolio optimization strategy will lead to superior risk-adjusted returns. The successive realized volatility can be best represented by the risk-premium-corrected implied adjusted volatility as follows:
$\widehat{R V}_{t, t+\Delta t}=\frac{M F I A V_{t, t+\Delta t}}{H V R P_t}$ (9)
4.4 Portfolio performance evaluation measures
In this section, we considered the following three performance metrics in order to measure the performance of each portfolio: (1) portfolio return (Rp), (2) portfolio volatility, denoted as standard deviation (SD), and (3) Sharpe Ratio (SR). Beyond the classical (unconstrained) portfolios, we additionally investigate two types of constrained portfolios:
(1) Short-Selling Portfolios: These portfolios allow for positions below zero, enabling strategic shorting of assets.
(2) Zero-Correlation Portfolios: Enforcing zero correlation between all assets, these portfolios aim for diversification through uncorrelated holdings.
This comprehensive evaluation encompasses a total of 36 distinct portfolio strategies across different configurations. Calculating the portfolio return relies on the weighted average return of each individual asset within the portfolio. For instance, for any portfolio with i number of assets, the portfolio returns were derived as:
$R_P=w_1 r_1+w_2 r_2+w_3 r_3+\cdots+w_i r_i$ (10)
in which wi denoted the weighted average returns of the i-th asset in the portfolio. This metric reflects the average gain or loss experienced by the portfolio over the investment period.
Second, we evaluated portfolio risk through its standard deviation (SD). Intuitively, this measure captures the overall volatility of the portfolio's returns, indicating the potential for fluctuations in value. For n-period returns of a portfolio, the portfolio standard deviation was formulated as:
$S D_P=\sqrt{\sum_{i=1}^n w_1^2 \sigma_1^2+\sum_{i=1}^n \sum_{i=1}^n w_i w_j \operatorname{Cov}_{i j}}$ (11)
For n number of assets, $\sigma_i^2$ is the variance of its returns, r, over a period of time and Covij is the covariance between the rates of return for asset i and j.
Finally, we employed the Sharpe Ratio (SR) to assess the portfolio's risk-adjusted return. This ratio essentially measures the excess return earned by the portfolio over a risk-free rate, per unit of portfolio risk (represented by standard deviation). It thus serves as a valuable indicator of whether the portfolio generates sufficient return relative to the risk it exposes investors to. The measurement of the return and the risk were represented by the sample mean of excess returns, $\hat{\mu}$, and by the sample standard deviation of excess returns, $\hat{\sigma}$, correspondingly. As a result, in a risk-adjusted framework, we can denote the SR of a portfolio as below:
$S R_i=\frac{\hat{\mu}}{\hat{\sigma}}$ (12)
This suggested that the best-performed portfolio was not essentially the one with the maximum return, but those with the highest return-to-risk ratio. We utilized the p-values to investigate the statistical significance of the difference in the SR between particular portfolios against a benchmark portfolio. In this p-test, the null hypothesis was the POAI being evaluated performs no better than the corresponding PNOAI, in terms of the SR value.
The portfolio performance was evaluated by comparing the portfolio constructed without considering the forward-looking option-implied adjusted information and those which used the information. In the first place, it is found that the introduction of implied volatility in the strategy leads to superior risk-adjusted returns and smaller pricing errors. This result is consistent with Barro et al. [51].
Our analysis of the three portfolio variants in Table 4 reveals interesting findings. While Median-Variance strategies offer the highest returns and unsurprisingly the lowest risks, it's the Median-Variance and MV-Med strategies that outperform in terms of risk-adjusted returns, as evidenced by their substantially larger Sharpe ratios (SR) across all variants, even without considering option-implied information's predictive power. However, it's also concerning that almost all compared strategies lack statistical significance against the benchmark portfolio. This highlights the need to improve results by leveraging option-implied adjusted information for portfolio selection.
Table 5 reveals that all considered classical Portfolios with Option-adjusted Information (POAIs) exhibit significantly higher returns compared to the 1/N portfolio, with the 1N-Med strategy achieving the peak performance. Specifically, the 1N-Med, 1N-MV-Med, 1N-Min-Med, and 1N-MV-Min-Med strategies deliver returns ranging from 0.2448 to 0.2496. Notably, the Minimum-Variance strategy produces the lowest portfolio risk, measured by a standard deviation of 0.0467, closely followed by the MV-Min portfolio. In essence, all POAI strategies demonstrate superior risk-reduction capabilities compared to the 1/N benchmark. This suggests that option-implied volatility captures valuable information about future price movements not reflected in historical data, leading to more optimized portfolio construction.
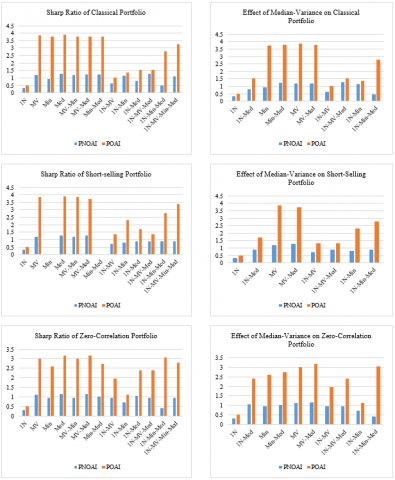
Median-variance portfolios (MV-Med, Med, Med-C, Med-ZC) consistently outperform other strategies, demonstrating their robustness to outliers and extreme market conditions compared to mean-variance approaches. Short-selling portfolios generally do not provide significant advantages in terms of risk-adjusted returns, suggesting limited benefits in this specific context. Zero-correlation portfolios show mixed results, outperforming traditional methods in some cases but not consistently across all strategies and assumptions. Further investigation into their effectiveness under different market conditions is warranted. We examine in detail the outperformance of the POAI against the PNOAI in Figure 2.
The left panel of Figure 2 illustrates the Sharpe Ratio performance of Portfolios with Option-adjusted Information (POAI) and their corresponding Portfolios with No Option-adjusted Information (PNOAI) across three portfolio variants. It clearly demonstrates the significant outperformance of POAI strategies in all variants, confirming that incorporating volatility information from the EGL model enhances portfolio selection, even with short-selling and zero-correlation constraints.
The right panel highlights the positive impact of the median-variance approach on portfolio performance. By consistently delivering higher Sharpe ratios across all variants, it suggests that applying median-variance in conjunction with existing approaches can lead to improved portfolio construction.
Table 5 quantifies the significant outperformance of Portfolios with Option-adjusted Information (POAI) over their corresponding Portfolios with No Option-adjusted Information (PNOAI). The table reports pairwise percentage differences in Sharpe ratios, where positive values indicate the superiority of POAI strategies. While p-values aren't explicitly shown, significant results are marked with asterisks (*) for 5% and double asterisks (**) for 1% significance levels.
Across all strategies, POAI demonstrates impressive gains in Sharpe Ratio, ranging from 18.26% to a remarkable 625.41%. Notably, the Median-variance (Med) approach consistently delivers the highest improvements, highlighting its efficacy in utilizing POAI. While Minimum-variance (Min) strategies achieve lower volatility, they often underperform Med in terms of risk-adjusted return. Interestingly, POAI portfolios maintain their outperformance even under realistic constraints like short-selling and zero-correlation, suggesting the method's robustness across diverse market conditions.
Table 4. Summary of portfolios performance without option-implied information
|
Portfolio |
Classical |
Short-Selling |
Zero-Correlation |
||||||
|
Strategy |
RP |
SD |
SR |
RP |
SD |
SR |
RP |
SD |
SR |
|
1N |
0.0609 |
0.1884 |
0.3231 |
0.0609 |
0.1884 |
0.3231 |
0.0609 |
0.1884 |
0.3231 |
|
PANEL A: Basic Portfolios |
|||||||||
|
MV |
0.0854 |
0.0722 |
1.1829 (0.0837) |
0.0854 |
0.0722 |
1.1829 (0.0555) |
0.0997 |
0.0893 |
1.1162 (0.0978) |
|
Min |
0.0634 |
0.0680 |
0.9327 (0.1579) |
0.0000 |
0.0376 |
0.0000 (0.3403) |
0.0762 |
0.0798 |
0.9542 (0.1665) |
|
Med |
0.0922 |
0.0713 |
1.2934 (0.0901) |
0.0922 |
0.0713 |
1.2934 (0.0600) |
0.1043 |
0.0901 |
1.1580 (0.1170) |
|
PANEL B: Optimal Combinations of Portfolios |
|||||||||
|
MV-Min |
0.0853 |
0.0721 |
1.1829 (0.0835) |
0.0854 |
0.0722 |
1.1829 (0.0555) |
0.0764 |
0.0798 |
0.9566 (0.1734) |
|
MV-Med |
0.0854 |
0.0704 |
1.2127 (0.1312) |
0.0932 |
0.0722 |
1.2915 (0.0609) |
0.0997 |
0.0865 |
1.1526 (0.1707) |
|
Min-Med |
0.0877 |
0.0702 |
1.2497 (0.1110) |
-0.0735 |
0.0109 |
-6.7227 (0.0000) |
0.0845 |
0.0811 |
1.0420 (0.1242) |
|
1N-MV |
0.1201 |
0.1917 |
0.6266 (0.3053) |
0.1183 |
0.1662 |
0.7119 (0.1988) |
0.1170 |
0.1216 |
0.9626 (0.2979) |
|
1N-Min |
0.0931 |
0.0820 |
1.1351 (0.0950) |
0.0435 |
0.0548 |
0.7932 (0.1629) |
0.0609 |
0.0839 |
0.7255 (0.2794) |
|
1N-Med |
0.1573 |
0.1917 |
0.8207 (0.3755) |
0.1479 |
0.1662 |
0.8898 (0.2581) |
0.1283 |
0.1216 |
1.0551 (0.3568) |
|
1N-MV-Med |
0.0931 |
0.0720 |
1.2920 (0.0909) |
0.1479 |
0.1662 |
0.8898 (0.0502) |
0.1167 |
0.1216 |
0.9602 (0.1075) |
|
1N-Min-Med |
0.0547 |
0.1128 |
0.4854 (0.4119) |
0.0495 |
0.0548 |
0.9025 (0.0002) |
0.1258 |
0.2990 |
0.4207 (0.2551) |
|
1N-MV-Min-Med |
0.1234 |
0.1128 |
1.0943 (0.1817) |
0.0495 |
0.0548 |
0.9025 (0.0001) |
0.1167 |
0.1216 |
0.9602 (0.1628) |
Figure 2. Left panel: Significant performance of POAI against PNOAI. Right panel: The improvement of portfolio offered by median-variance approach across different portfolio variants
Furthermore, optimal combinations utilizing POAI, particularly those involving Med, yield even better results. This emphasizes the potential of combining strategies for further performance enhancement.
Table 5 provides compelling evidence that POAI significantly improves portfolio performance, especially in emerging markets with potentially unreliable historical data. While these findings are robust, further research across various market conditions and asset classes could offer valuable insights into the generalizability and practical implications of this approach.
The results of our analysis demonstrate several key implications. Firstly, the superior risk-adjusted returns and smaller pricing errors observed when incorporating option-implied information underscore the predictive power of implied volatility in informing portfolio selection. This finding aligns with previous literature and reinforces the importance of considering forward-looking market indicators in investment decision-making.
Furthermore, our evaluation of different portfolio strategies revealed that median-variance approaches consistently outperformed other strategies in terms of risk-adjusted returns. This highlights the robustness of median-variance methodologies in navigating market uncertainties and extreme conditions, contributing valuable insights to portfolio construction practices.
Moreover, the significant outperformance of portfolios with option-adjusted information over their counterparts without it highlights the potential benefits of integrating EGL-derived implied volatilities into portfolio optimization frameworks. This suggests that incorporating option-implied information can lead to more informed investment decisions and improved risk-adjusted returns for investors.
In summary, our study's findings have important implications for portfolio managers, investors, and researchers. By demonstrating the efficacy of incorporating option-implied information from EGL models, our research provides a valuable tool for enhancing portfolio performance and managing risk in dynamic market environments. These implications emphasize the practical relevance and significance of our study in the field of portfolio optimization. The summary of the analysis of this study is provided in Table 6.
Table 5. Summary of portfolios performance with option-implied information
|
Portfolio |
Classical |
Short-Selling |
Zero-Correlation |
||||||
|
Strategy |
RP |
SD |
SR |
RP |
SD |
SR |
RP |
SD |
SR |
|
1N |
0.0839 |
0.1634 |
0.5133 |
0.0839 |
0.1634 |
0.5133 |
0.0839 |
0.1634 |
0.5133 |
|
PANEL A: Basic Portfolios |
|||||||||
|
MV |
0.1871 |
0.0483 |
3.8760 (0.0001) (0.0004) |
0.1871 |
0.0483 |
3.8760 (0.0000) (0.0004) |
0.2041 |
0.0677 |
3.0161 (0.0009) (0.0056) |
|
Min |
0.1754 |
0.0467 |
3.7531 (0.0001) (0.0003) |
0.0000 |
0.0176 |
0.0000 (0.2395) (0.5000) |
0.1529 |
0.0589 |
2.5943 (0.0037) (0.0009) |
|
Med |
0.2073 |
0.0529 |
3.9171 (0.0001) (0.0007) |
0.2073 |
0.0529 |
3.9171 (0.0001) (0.0007) |
0.2209 |
0.0698 |
3.1638 (0.0013) (0.0076) |
|
PANEL B: Optimal Combinations of Portfolios |
|||||||||
|
MV-Min |
0.1754 |
0.0467 |
3.7530 (0.0001) (0.0006) |
0.1871 |
0.0483 |
3.8760 (0.0000) (0.0004) |
0.2041 |
0.0677 |
3.0161 (0.0009) (0.0056) |
|
MV-Med |
0.1937 |
0.0512 |
3.7796 (0.0002) (0.0006) |
0.1806 |
0.0483 |
3.7413 (0.0001) (0.0012) |
0.2137 |
0.0677 |
3.1584 (0.0069) (0.0436) |
|
Min-Med |
0.1937 |
0.0512 |
3.7796 (0.0002) (0.0008) |
0.0000 |
0.0182 |
0.0000 (0.0821) (0.0000) |
0.1656 |
0.0605 |
2.7388 (0.0008) (0.0000) |
|
1N-MV |
0.1683 |
0.1634 |
1.0299 (0.1960) (0.2504) |
0.1967 |
0.1464 |
1.3432 (0.0585) (0.1499) |
0.2090 |
0.1069 |
1.9546 (0.0131) (0.0242) |
|
1N-Min |
0.0839 |
0.0620 |
1.3537 (0.0882) (0.3567) |
0.0659 |
0.0283 |
2.3257 (0.0028) (0.0120) |
0.0839 |
0.0740 |
1.1336 (0.1918) (0.3138) |
|
1N-Med |
0.2496 |
0.1634 |
1.5279 (0.1266) (0.1169) |
0.2523 |
0.1464 |
1.7228 (0.0467) (0.0862) |
0.2575 |
0.1069 |
2.4080 (0.0141) |
|
1N-MV-Med |
0.2496 |
0.1634 |
1.5279 (0.1266) (0.4703) |
0.1967 |
0.1464 |
1.3437 (0.1114) (0.4519) |
0.2575 |
0.1069 |
2.4080 (0.0759) |
|
1N-Min-Med |
0.2448 |
0.0874 |
2.8019 (0.0013) (0.0005) |
0.2448 |
0.0874 |
2.8019 (0.0007) (0.0310) |
0.2575 |
0.0844 |
3.0518 (0.0271) |
|
1N-MV-Min-Med |
0.2496 |
0.0764 |
3.2681 (0.0007) (0.0016) |
0.2448 |
0.0728 |
3.3630 (0.0003) (0.0679) |
0.2448 |
0.0874 |
2.8019 (0.0366) |
Note: The p-values are reported in parentheses in regard to the 1/N portfolio. Refer to Table 3 for the full definition of portfolios abbreviation.
Table 6. Summary of analysis of option-implied adjusted information using Extended Generalized Leland models
|
Research Objective |
Objective Settings |
Input |
Portfolio Strategy |
Hypothesis |
Outcome |
|
To evaluate the performance of portfolios constructed using option-adjusted information implied from the EGL model under median-variance approach |
To correct the option-implied information with the risk-premium factor |
Option-implied volatility a. EGL b. MFBKM Manipulating factors: a. Portfolio variants b. Portfolio constraints c. Portfolio strategies |
Evaluating Performance: a. RMSE b. MRPE c. MARPE |
The risk-premium-corrected portfolio performs no better than a portfolio that is not corrected |
Smaller pricing error is recorded when the correction of risk-premium is considered |
|
To develop a portfolio strategy based on the option-implied information of different variants |
Benchmark: 1/N naïve portfolio Strategies: a. Mean-variance b. Minimum-variance c. Median-variance Constrained portfolios: a. Short-selling b. Zero-correlation Evaluating performance metrics: a. Portfolio return b. Portfolio volatility c. Sharpe ratio |
The performance of the portfolio being evaluated is no better than the benchmark |
Portfolio variant: Optimal combination (1N-Min-Med) Portfolio constraints: Zero-correlation POAI versus PNOAI: POAI |
This study proposes a novel, data-driven approach to portfolio optimization by incorporating option-implied volatility and employing the median-variance selection strategy. By addressing limitations in existing literature, our approach remains robust even when historical data is scarce or unreliable. The EGL methodology's ability to bridge the gap between parametric and non-parametric frameworks was reflected in the results. The integration of features from both Leland models and the framework by Bakshi et al. [16] allowed for a more comprehensive and flexible approach to portfolio optimization, leading to superior risk-adjusted returns.
By incorporating option-implied volatility and employing the median-variance selection strategy, we observed significant improvements in portfolio performance metrics such as Sharpe ratios and volatility. This demonstrates how our approach mitigates the shortcomings associated with traditional mean-variance and minimum-variance strategies, which often struggle to adapt to real-world market conditions.
Our methodology addresses a key limitation in existing portfolio optimization literature, which often relies exclusively on historical data analysis under a normal distribution setting. While historical data provides valuable insights into past market behavior, it may not fully capture the complexities of future market movements. By integrating option-implied information, our approach complements historical data analysis with forward-looking indicators, offering a more comprehensive and nuanced understanding of market dynamics. This enables investors to make more informed and adaptive portfolio decisions, enhancing their ability to navigate changing market conditions and achieve their investment objectives.
While this study utilized DJIA data for empirical validation, this may limit the generalizability of our findings to other asset classes or market indices. Future research could explore the applicability of our methodology across diverse asset classes and geographical regions to assess its broader effectiveness and robustness.
The use of a more recent dataset could offer additional insights into the performance of our methodology. The use of historical DJIA data spanning from January 2009 to December 2019 may not fully capture the dynamics of current market conditions.
Even so, the chosen period is observed to offer a stable foundation for evaluating the methodology's effectiveness. Option-adjusted volatility derived from EGL models significantly boosted performance, particularly with the median-variance strategy. Although minimum-variance portfolios minimize risk, median-variance strategies yielded superior Sharpe ratios, underlining the approach's advantage in optimizing portfolio selection.
Imposing realistic constraints like short-selling and zero-correlation demonstrated the method's robustness across diverse market conditions. Examining additional constrained portfolios could broaden the understanding of exploiting option-implied volatility within semiparametric pricing models, potentially refining future portfolio selection strategies.
Overall, this study contributes significantly to portfolio optimization research, highlighting the potential benefits for investors, particularly in emerging markets. As data availability and reliability in these markets improve, our methodology has the potential to become an increasingly crucial tool for optimizing portfolios and achieving investment goals.
However, further research is warranted to explore the generalizability of these results across diverse market conditions and asset classes. Additionally, examining the practical challenges and limitations of implementing this approach in real-world settings would be valuable for translating these findings into actionable investment strategies. By building upon this research and addressing these aspects, we can pave the way for more robust and data-driven investment strategies, ultimately empowering investors to make informed decisions and achieve their financial goals.
This research is supported fully by the Universiti Malaysia Terengganu. The authors are immensely grateful to the anonymous reviewers for their useful insights and comments. The author would like to thank Dr Mimi Hafizah Abdullah, Dr Pah Chin Hee and Dr Hafizah Bahaludin for their helpful reviews and comments.
[1] Markowitz, H.M. (1952). Portfolio selection. The Journal of Finance, 7(1): 77-91. http://doi.org/10.2307/2975974
[2] DeMiguel, V., Garlappi, L., Uppal, R. (2009). Optimal versus naive diversification: How inefficient is the 1/N portfolio strategy? The review of Financial Studies, 22(5): 1915-1953. https://doi.org/10.1093/rfs/hhm075
[3] Jacobs, H., Müller, S., Weber, M. (2009). How should private investors diversify? An empirical evaluation of alternative asset allocation policies to construct a " world market portfolio". Working Paper.
[4] DeMiguel, V., Plyakha, Y., Uppal, R., Vilkov, G. (2013). Improving portfolio selection using option-implied volatility and skewness. Journal of Financial and Quantitative Analysis, 48(6): 1813-1845. https://doi.org/10.1017/S0022109013000616
[5] Jacobs, H., Müller, S., Weber, M. (2014). How should individual investors diversify? An empirical evaluation of alternative asset allocation policies. Journal of Financial Markets, 19: 62-85.
[6] Low, R.K.Y., Faff, R., Aas, K. (2016). Enhancing mean–variance portfolio selection by modeling distributional asymmetries. Journal of Economics and Business, 85: 49-72. https://doi.org/10.1016/j.jeconbus.2016.01.003
[7] Ao, M., Yingying, L., Zheng, X. (2019). Approaching mean-variance efficiency for large portfolios. The Review of Financial Studies, 32(7): 2890-2919. https://doi.org/10.1093/rfs/hhy105
[8] Connor, G., Li, S., Linton, O.B. (2021). A dynamic semiparametric characteristics-based model for optimal portfolio selection. Michael J. Brennan Irish Finance Working Paper Series Research Paper, 21-1.
[9] Kostakis, A., Panigirtzoglou, N., Skiadopoulos, G. (2011). Market timing with option-implied distributions: A forward-looking approach. Management Science, 57(7): 1231-1249. https://doi.org/10.1287/mnsc.1110.1346
[10] Kempf, A., Korn, O., Saßning, S. (2015). Portfolio optimization using forward-looking information. Review of Finance, 19(1): 467-490. https://doi.org/10.1093/rof/rfu006
[11] Bahaludin, H., Abdullah, M.H., Tolos, S.M. (2017). Asset allocation using option-implied moments. Journal of Physics: Conference Series, 890(1): 012158. https://doi.org/10.1088/1742-6596/890/1/012158
[12] Valencia-Herrera, H., López-Herrera, F. (2018). Markov switching international capital asset pricing model, an emerging market case: Mexico. Journal of Emerging Market Finance, 17(1): 96-129. https://doi.org/10.1177/0972652717748089
[13] Misra, D., Vishnani, S., Mehrotra, A. (2019). Four-moment CAPM model: Evidence from the Indian stock market. Journal of Emerging Market Finance, 18(1): S137-S166. https://doi.org/10.1177/0972652719831564
[14] Leland, H.E. (1985). Option pricing and replication with transactions costs. The Journal of Finance, 40(5): 1283-1301. https://doi.org/10.1111/j.1540-6261.1985.tb02383.x
[15] Leland, H.E. (2007). Financial synergies and the optimal scope of the firm: Implications for mergers, spinoffs, and structured finance. The Journal of Finance, 62(2): 765-807. https://doi.org/10.1111/j.1540-6261.2007.01223.x
[16] Bakshi, G., Kapadia, N., Madan, D. (2003). Stock return characteristics, skew laws, and the differential pricing of individual equity options. The Review of Financial Studies, 16(1): 101-143. https://doi.org/10.1093/rfs/16.1.0101
[17] Hussain, M., Goswami, B. (2022). Sector specific determinants of foreign portfolio investment inflows in India: A panel ARDL approach. Global Business Review, 09721509221137204. https://doi.org/10.1177/09721509221137204
[18] Kan, R., Smith, D.R. (2008). The distribution of the sample minimum-variance frontier. Management Science, 54(7): 1364-1380. https://doi.org/10.1287/mnsc.1070.0852
[19] Claeson, M. (2016). A critical review of the global minimum variance theory. Bachelor thesis, Lund University.
[20] Ledoit, O., Wolf, M. (2003). Improved estimation of the covariance matrix of stock returns with an application to portfolio selection. Journal of Empirical Finance, 10(5): 603-621. https://doi.org/10.1016/S0927-5398(03)00007-0
[21] Fang, Y., Post, T. (2022). Optimal portfolio choice for higher-order risk averters. Journal of Banking & Finance, 137: 106429. https://doi.org/10.1016/j.jbankfin.2022.106429
[22] Sharpe, W.F. (1963). A simplified model for portfolio analysis. Management Science, 9(2): 277-293. https://doi.org/10.1287/mnsc.9.2.277
[23] Çela, E., Hafner, S., Mestel, R., Pferschy, U. (2021). Mean-variance portfolio optimization based on ordinal information. Journal of Banking & Finance, 122: 105989. https://doi.org/10.1016/j.jbankfin.2020.105989
[24] Golosnoy, V., Gribisch, B. (2022). Modeling and forecasting realized portfolio weights. Journal of Banking & Finance, 138: 106404. https://doi.org/10.1016/j.jbankfin.2022.106404
[25] Li, X. (2023). Selecting investment analytic framework for both top-down and bottom-up investors: Using global equity as the example. The Journal of Portfolio Management, 49(3): 106-128. https://doi.org/10.3905/jpm.2022.1.444
[26] Blitz, D. (2023). Macro risk of low-volatility portfolios. The Journal of Portfolio Management, 49(3): 25-35.
[27] Elkamhi, R., Lee, J.S., Salerno, M. (2023). Portfolio tilts using views on macroeconomic regimes. The Journal of Portfolio Management, 49(3): 7-24.
[28] Guerard, J.B., Gillam, R.A., Beheshti, B. (2022). Stock selection modeling and portfolio selection in emerging markets. The Journal of Portfolio Management, 48(8): 86-94. https://doi.org/10.3905/jpm.2022.1.375
[29] Feng, Y., Zhang, B., Peng, J. (2023). Mean-risk model for uncertain portfolio selection with background risk and realistic constraints. Journal of Industrial & Management Optimization, 19(7): 1-19. https://doi.org/10.3934/jimo.2022181
[30] Chen, J., Feng, L., Peng, J., Zhang, Y. (2023). Optimal portfolio execution with a Markov chain approximation approach. IMA Journal of Management Mathematics, 34(1): 165-186. https://doi.org/10.1093/imaman/dpab025
[31] Barry, C.B. (1974). Portfolio analysis under uncertain means, variances, and covariances. The Journal of Finance, 29(2): 515-522. https://doi.org/10.2307/2978821
[32] Chen, S.N., Brown, S.J. (1983). Estimation risk and simple rules for optimal portfolio selection. The Journal of Finance, 38(4): 1087-1093. https://doi.org/10.2307/2328013
[33] Wan Mohd, W.R., Mohamad, D., Mohamed, Z. (2013). Portfolio optimization using median-variance approach. AIP Conference Proceedings, 1522(1): 1086-1091. https://doi.org/10.1063/1.4801251
[34] Wan Mohd, W.R., Mohamad, D., Mohamed, Z. (2013). Portfolio optimization using median-variance approach. AIP Conference Proceedings, 1522(1): 1086-1091. https://doi.org/10.1063/1.4801251
[35] Benati, S. (2015). Using medians in portfolio optimization. Journal of the Operational Research Society, 66(5): 720-731. https://doi.org/10.1057/jors.2014.57
[36] Jagannathan, R., Ma, T. (2003). Risk reduction in large portfolios: Why imposing the wrong constraints helps. The Journal of Finance, 58(4): 1651-1683. https://doi.org/10.1111/1540-6261.00580
[37] Zhang, M., Song, W., Liu, L., Zhou, D. (2024). Optimal investment portfolio strategy for carbon neutrality of power enterprises. Renewable and Sustainable Energy Reviews, 189: 113943. https://doi.org/10.1016/j.rser.2023.113943
[38] Belabbes, K., El Hachloufi, M., Guennoun, Z.E.A. (2023). Diversified mean-value at risk models with transaction costs for international portfolio optimization using uncertainty theory. Mathematical Modelling of Engineering Problems, 10(4): 1473-1480. https://doi.org/10.18280/mmep.100444
[39] Li, Y.M., Lin, L.F., Hung, M.C. (2024). A collective portfolio selection approach for investment clubs. Information & Management, 61(2): 103909. https://doi.org/10.1016/j.im.2023.103909
[40] Zhang, C., Gong, X., Zhang, J., Chen, Z. (2023). Dynamic portfolio allocation for financial markets: A perspective of competitive-cum-compensatory strategy. Journal of International Financial Markets, Institutions and Money, 84: 101737. https://doi.org/10.1016/j.intfin.2023.101737
[41] Wang, A., Kresta, A., Tichý, T. (2024). Evaluation of strategy portfolios. Computational Management Science, 21(1): 17. https://doi.org/10.1007/s10287-023-00497-5
[42] Engström, M. (2002). A note on rational call option exercise. Journal of Futures Markets: Futures, Options, and Other Derivative Products, 22(5): 471-482. https://doi.org/10.1002/fut.10020
[43] Yang, Q. (2006). An empirical study of implied volatility in Australian index option markets. Doctoral dissertation, Queensland University of Technology.
[44] Sharp, T., Li, S., Allen, D. (2010). Empirical performance of affine option pricing models: Evidence from the Australian index options market. Applied Financial Economics, 20(6): 501-514. https://doi.org/10.1080/09603100903459824
[45] Sarwar, G., Krehbiel, T. (2000). Empirical performance of alternative pricing models of currency options. Journal of Futures Markets: Futures, Options, and Other Derivative Products, 20(3): 265-291. https://doi.org/10.1002/(SICI)1096-9934(200003)20:3%3C265::AID-FUT4%3E3.0.CO;2-4
[46] Bollen, N.P., Whaley, R.E. (2004). Does net buying pressure affect the shape of implied volatility functions? The Journal of Finance, 59(2): 711-753. https://doi.org/10.1111/j.1540-6261.2004.00647.x
[47] Li, S., Abdullah, M.H. (2012). Implied transaction costs by Leland option pricing model: A new approach and empirical evidence. Journal of Derivatives & Hedge Funds, 18: 333-360. https://doi.org/10.1057/jdhf.2012.12
[48] Harun, H.F., Abdullah, M.H. (2020). Option-implied adjusted volatility using modified generalised Leland models: An empirical study on Dow Jones industrial average index options. Malaysian Journal of Mathematical Sciences, 14: 93-105.
[49] DeMiguel, V., Nogales, F.J., Uppal, R. (2014). Stock return serial dependence and out-of-sample portfolio performance. The Review of Financial Studies, 27(4): 1031-1073. https://doi.org/10.1093/rfs/hhu002
[50] Harun, H.F., Abdullah, M.H. (2021). Correcting for risk premium on extended generalised Leland models: An empirical study on Dow Jones industrial average (DJIA) index options. Journal of Physics: Conference Series, 1988(1): 012045. https://doi.org/10.1088/1742-6596/1988/1/012045
[51] Barro, D., Consigli, G., Varun, V. (2022). A stochastic programming model for dynamic portfolio management with financial derivatives. Journal of Banking & Finance, 140: 106445. https://doi.org/10.1016/j.jbankfin.2022.106445