Sabri![]() | Hasdi Aimon*
| Hasdi Aimon*![]() | Syamsul Amar
| Syamsul Amar![]()
© 2024 The authors. This article is published by IIETA and is licensed under the CC BY 4.0 license (http://creativecommons.org/licenses/by/4.0/).
OPEN ACCESS
This research aims to examine the relationship between economic growth and environmental degradation in Indonesia during the 1984-2022 period by using a simultaneous equation approach. Furthermore, this study considers several determinants, which consist of investment, inflation, income inequality, fossil consumption and poverty. This relationship is worth studying, especially in relation to Indonesia because Indonesia is one of the developing countries that is trying to achieve sustainable development as agreed in the sustainable development goals. The findings of this study include economic growth affecting environmental degradation by 1.15 percent and environmental degradation affecting economic growth by 2.41 percent. Furthermore, economic growth was strengthened by investment and weakened by inflation and income inequality. Then, environmental degradation is reinforced by income inequality, consumption of fuel oil and poverty. This study recommends that the government implement a sustainable development policy with the principle of meeting the needs of the present without sacrificing meeting the needs of future generations.
economic growth, environmental degradation, simultaneous equation model
The relationship between economic growth (EG) and environmental degradation (ED) is complex and often subject to debate. While economic growth is traditionally measured by indicators such as GDP growth, job creation, and increased standards of living, environmental degradation refers to the deterioration of ecosystems, depletion of natural resources, and pollution [1, 2]. Acceleration of the national development process in an effort to catch up with developed countries, developing countries such as Indonesia, carry out various maneuvers in achieving high EG without conducting further studies of changes in the large-scale transformation of the economic system that are so fast, in which all sectors are directed for industrial success [3, 4].
This activity ignores various side effects in the form of an increasing level of negative externalities and deteriorating environmental conditions arising from these efforts, especially ED which is increasingly acute [5, 6]. All of this stems from the assumption that nature is the only source of capital that is easily exploited and promises income and prosperity for the community quickly, so that economic actors forget that all of this actually creates new, more complicated and complex problems, both in the short term and in the long term [7, 8].
High EG as an indicator of national development is closely related to industrial development because the population in a country is increasing so that the needs of the community also increase [9, 10]. Furthermore, the high industrial expansion will produce a lot of waste in both liquid and gas form [11, 12].
Liquid waste is often dumped in rivers or freshwater lakes, while flue gases are released into the atmosphere. Liquid waste causes water pollution that damages aquatic ecosystems. Exhaust gases cause pollution in the atmosphere which in the long run will have an impact on the health of living things. This industrial exhaust gas also causes a decrease in the quality of the ozone layer which is one of the causes of accelerated global warming.
Figure 1. Conditions of EG and ED in Indonesia [13]
Based on the information in Figure 1, it is known that during the last ten years, there have been fluctuations in EG and ED. The factual phenomenon that occurred was that from 2016 to 2018, when EG increased, ED actually decreased. Furthermore, contrasting conditions occurred in 2019, where the decline in EG actually increased ED. Then, in 2021 what will happen is an increase in EG resulting in a decrease in ED.
Based on an empirical study of the relationship between EG and ED that has been carried out by several researchers in various developing countries [5, 7, 14-16], they found that high EG would lead to increased ED. This condition occurs because developing countries make the environment a natural capital that will make a major contribution to the development and welfare of its people. Industrialization and economic development can lead to higher levels of pollution, including air pollution from factories and vehicles, water pollution from industrial and agricultural runoff, and soil contamination from chemical use.
Economies that derive most of their income from natural sources cannot sustain growth by substituting accumulated physical capital for deteriorating natural capital, resulting in increased ED. Then, some researchers also found that decreasing degradation in developing countries would result in a contraction of EG because the condition of the environment's carrying capacity was maintained indicating that the level of exploitation of natural resources by economic actors was low. This condition causes output to decrease due to the low use of natural capital inputs [17-20].
Based on the explanation of the facts and empirical phenomena that have been explained, this study will examine more broadly the relationship between EG and ED. The novelty contribution of this research will be analyzed using a simultaneous approach so that this research will consider various determinants that affect EG and ED, which will be explored in relevant research that discusses this topic. Furthermore, this research is expected to be able to provide solutions to the government for the harmonization of the implementation of EG and the stability of the carrying capacity of the environment in achieving sustainable development.
This research focuses on a number of relevant literatures that has studied EG and ED in various countries to support the research results. EG often leads to increased consumption of natural resources, including fossil fuels, minerals, and water. This can result in resource depletion and ED, such as deforestation, habitat destruction, and soil erosion. The study that found a positive and significant relationship included [21], they tested the relationship of oil consumption and EG to ED in developing countries during the period 1980 to 2012 using the Vector Error Correction Model (VECM) approach, they found oil consumption and EG contributes to increasing ED. The same study [22] for Asian economic groups during the period 1991 to 2013, but they used a cointegration approach, they found a two-way causal relationship between energy consumption and EG on ED. Furthermore, Alam et al. [23] expanded this study using the Environmental Kuznets Curve (EKC) hypothesis analysis for Brazil, China, India and Indonesia during the period 1970 to 2012 using the Autoregressive Distributed Lag (ARDL) approach, they found carbon emissions had increased significantly with increase in income and energy consumption in all four countries. A different study [24] conducted an analysis of EG and globalization on environmental quality and sustainability for Sub-Saharan Africa during the period 1990 to 2013 using the General Method of Moments (GMM) approach, they found that there is a positive correlation for EG, environmental quality and sustainability. The most recent study was conducted by Yameogo and Dauda [25] who investigated the relationship between income inequality (INC), carbon emission levels, and EG in Burkina Faso and Nigeria in the period 1980-2016 using the ARDL boundary approach, they found a relationship between INC and ED in both countries it is positive, while government spending and poverty (POV) are found to increase carbon emissions in the long run, only in Nigeria.
Later, this study was expanded by various researchers in countries who analyzed the EKC problem. First, Ozcan et al. [26] for Brazil over the period 1971 to 2011, but they focus on the electrical energy sector, they find a long-run quadratic relationship between carbon emissions and EG, thus confirming the existence of the EKC. Similar results were obtained [27] for Myanmar during the period 1970-2014, they found a positive short-term and long-term relationship between carbon emissions and EG, thus finding evidence for the EKC hypothesis.
Studies that find a negative and significant relationship [28] for the Organization of Economic Co-operation and Development (OECD) country group and developing countries during the period 1980 to 2010, they find that ED cannot be resolved automatically by EG, so it does not support the EKC hypothesis. In addition, Danish and Baloch [29] analyzed for Pakistan during the period 1971 to 2014, and it was found that infrastructure and urbanization reduced environmental quality due to high emissions in the atmosphere. Meanwhile, Sanyé-Mengual et al. [30] conducted a study for European Union countries, they found that consumption-based environmental indicators are very promising for supporting policy-making to address the actual impacts driven by production and consumption systems. Addressing the problem of EG and ED requires a holistic approach that integrates environmental sustainability into economic policies and decision-making processes.
On the other hand, a study that found an insignificant relationship was found by Alvarado and Toledo [31] who conducted a causality study for EG and ED in developing countries during the period 1971 to 2010, they found that there was no reciprocal relationship between variables. Economic activities, particularly those reliant on fossil fuels, are major contributors to climate change through the emission of greenhouse gases such as carbon dioxide and methane. Climate change has far-reaching environmental impacts, including rising global temperatures, extreme weather events, sea-level rise, and disruptions to ecosystems and biodiversity.
Based on the relevant research that has been described, this research will fill the gaps in previous research for the analysis of EG and the environment. Previous research has investigated the relationship between these two studies separately and even if there is an analysis using a causality approach, it has not considered other variables as a determinant. Furthermore, this study applies a simultaneous equation model so that studies on EG and ED are more comprehensive, so that this study considers various exogenous variables (EXV) summarized from relevant research, such as investment (INV), inflation (INF), INC, fossil consumption (FC) and POV, which are expected to create formulation of policy implications to maintain harmonized EG and better environmental carrying capacity.
H1: ED has a significant effect on EG
H2: INF has a significant effect on EG
H3: INV has a significant effect on EG
H4: INC has a significant effect on EG
H5: EG has a significant effect on ED
H6: INC has a significant effect on ED
H7: FC has a significant effect on ED
H8: POV has a significant effect on ED
3.1 Data and variable
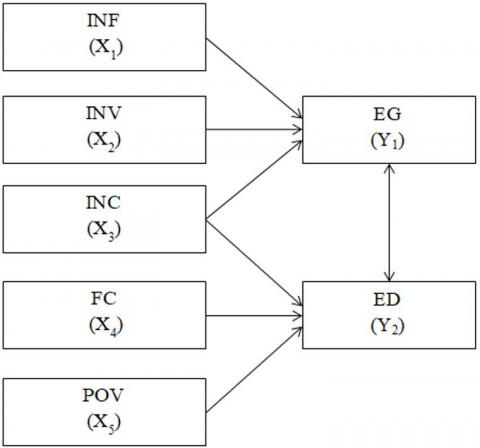
This study uses secondary data consisting of time series covering the period 1984-2022 for Indonesia. Furthermore, the endogenous variables (ENV) are EG and ED. In addition, EXV are INF, INV, INC, FC and POV. Then, the conceptual framework of the research can be determined, which is summarized in Figure 2.
Figure 2. Framework of research
Based on Figure 2, the indicators for each of the variables used are described in Table 1.
Table 1. Variable Indicator
|
Variable |
Indicator |
Source |
|
EG (Y1) |
Growth rate of gross domestic product per capita at 2010 constant prices as measured in percent |
[13] |
|
ED (Y2) |
Natural resource depletion as measured in percent |
[13] |
|
INF (X1) |
Annual INF measured in percent |
[13] |
|
INV (X2) |
Realization of domestic INV, measured in billions of rupiah |
[13] |
|
INC (X3) |
Gini ratio measured in index |
[13] |
|
FC (X4) |
Total fossil fuel oil consumption measured in percent |
[13] |
|
POV (X5) |
Number of poor people measured in thousands of people |
[13] |
3.2 Analysis model
This study applies a simultaneous equation analysis model, which is summarized in Eqs. (1) and (2).
$\mathrm{Y}_{1 \mathrm{t}}=\alpha_{1.0}+\alpha_{1.1} \mathrm{Y}_{2 \mathrm{t}}+\alpha_{1.2} \mathrm{X}_{1 \mathrm{t}}+\alpha_{1.3} \mathrm{X}_{2 \mathrm{t}}+\alpha_{1.4} \mathrm{X}_{3 \mathrm{t}}+\varepsilon_{1 \mathrm{t}}$ (1)
$\mathrm{Y}_{2 \mathrm{t}}=\alpha_{2.0}+\alpha_{2.1} \mathrm{Y}_{1 \mathrm{t}}+\alpha_{2.2} \mathrm{X}_{3 \mathrm{t}}+\alpha_{2.3} \mathrm{X}_{4 \mathrm{t}}+\alpha_{2.4} \mathrm{X}_{5 \mathrm{t}}+\varepsilon_{2 \mathrm{t}}$ (2)
where,
α=Parameter
t=Time series
ε=Error term
Based on Eqs. (1) and (2), the simultaneous equation in the research consists of two analytical models, so an identification test is needed. One type of identification test is order condition, which uses the following conditions:
K–k=m–1 (identified)
K–k>m–1 (over-identified)
K–k<m–1 (un-identified)
where,
K=the number of EXV in the system
k=the number of EXV in each equation
m=the number of ENV in each equation
Based on this explanation, the results of the order conditions for the two analysis models in this study were over-identified.
Eq. (1) $\rightarrow$ EG (Y1)
5–3>2–1
2>1 (over-identified)
Eq. (2) $\rightarrow$ EG (Y2)
5–3>2–1
2>1 (over-identified)
From the results of the identification test above, it was concluded that all existing equations were over-identified, so to estimate the parameters of the existing equations using the Two Stages Least Squared (TSLS) method. Thus, the coefficient estimates will still not be biased, because this is an advantage of the TSLS method.
4.1 Simultaneous equation analysis for EG
$\begin{aligned} \mathrm{Y}_{1 \mathrm{t}}=2.75^*+1.15 \mathrm{Y}_{2 \mathrm{t}}{ }^{* *}-3.26 \mathrm{X}_{1 \mathrm{t}}{ }^{* *}+4.20 \mathrm{X}_{2 \mathrm{t}}{ }^{* * *} -2.41 \mathrm{X}_{3 \mathrm{t}}{ }^{* *}\end{aligned}$ (3)
$* * * \alpha=1 \% ; * * \alpha=5 \% ; * \alpha=10 \%$
The interpretation of the results for Eq. (3) can be explained in four discussions, including:
ED (Y2) will increase EG (Y1) because a degraded environment indicates that there is a decrease in environmental carrying capacity due to the use of inputs sourced from nature. This condition will result in an increase in production activities due to the exploitation of the use of inputs used, so that it will have an impact on increasing output and EG. The results of this study are consistent with the direction of influence between degradation on EG that has been carried out by previous researchers [32, 33] who found that improving environmental quality would decrease EG.
INF (X1) will reduce EG (Y1) because INF reduces the value of the currency's purchasing power, so the same amount of money will buy fewer goods than before. With the decline in purchasing power, the cost of living standards will be higher than before INF. Consequently, people are required to make more money than ever before. Because to be able to get the same goods or services, they have to pay more, which will have an impact on the decline in people's welfare which will result in a decrease in EG. The results of this study are consistent with the direction of influence between INF on EG that has been carried out by previous researchers [34, 35], who found that INF would reduce EG.
INV (X2) will increase EG (Y1) because INV is one of the important factors and has two roles at the same time to have an impact on the economy. First, INV has a positive relationship with state income, so the easier the INV process, the more INV activities are carried out and the higher the income generated by the state. Second, INV can increase the production capacity of the economy by increasing the capital stock. This capital formation is considered an expenditure that will increase the demand for the needs of the whole community. In the long term, INV not only affects aggregate demand but also affects aggregate supply through changes in production capacity. The results of this study are consistent with the direction of influence between INV on EG that has been carried out by previous researchers [36, 37], who find that INV contributes to increasing EG in a country.
INC (X3) will reduce EG (Y1) because inequality in income distribution is a problem of income differences between people or regions that are developed and regions that are lagging behind. The larger the income gap, the greater the variation in income distribution will lead to income disparities. INC explains differences in prosperity, standard of living, and income received or generated by individuals or households in society, resulting in uneven distribution between regions due to differences in production factors and available resources. The results of this study are consistent with the direction of influence between INC on EG that has been carried out by previous researchers [38, 39], who found that inequality resulted in a reduction in EG.
4.2 Simultaneous equation analysis for ED
$\begin{aligned} \mathrm{Y}_{2 \mathrm{t}}=-10.26^{* *}+ & 2.41 \mathrm{Y}_{1 \mathrm{t}}{ }^{* *}+5.62 \mathrm{X}_{3 \mathrm{t}}{ }^{* *} +4.10 \mathrm{X}_{4 \mathrm{t}}{ }^{* *}+8.16 \mathrm{X}_{5 \mathrm{t}}{ }^{* *}\end{aligned}$ (4)
$* * * \alpha=1 \% ; * * \alpha=5 \%$
The interpretation of the results for Eq. (4) can be explained in five discussions, including:
EG (Y1) will increase ED (Y2) because a high economy indicates that increased output in the form of goods and services is produced, which to produce this output requires a number of inputs such as natural resources in the production process. This condition will trigger the exploitation of natural resources which will result in the cost of natural resource depreciation, resulting in ED. The results of this study are consistent with the direction of influence between EG on environmental quality that has been carried out by previous researchers [40, 41], who found that increased EG would increase ED.
Income inequality (X3) will increase ED (Y2) because inequality in income distribution causes the income gap to widen between the rich and the poor, so that it will reduce the quality of the environment. Furthermore, INC will encourage ED because rich and powerful groups of people will try to pursue economic benefits without paying attention to the environment, while poor people will increasingly depend on nature for their lives. The results of this study are consistent with the direction of influence between INC on environmental quality that has been carried out by previous researchers [42, 43], who found that high INC would increase ED.
FC (X4) will increase ED (Y2) because the fuel consumption is one type of non-renewable energy source that has the potential to increase carbon emissions. The use of fuel oil in economic activities has a major impact on environmental quality, such as increasing levels of CO2 in the atmosphere, so that the temperature of the planet Earth will increase because solar thermal energy is retained in the atmosphere. The results of this study are consistent with the direction of influence between non-renewable energy consumption on environmental quality that has been carried out by previous researchers [40, 41], who found that high fuel oil consumption would increase ED.
POV (X5) will increase ED (Y2) because the poor use natural resources excessively beyond the carrying capacity of existing natural resources to support their lives, so this condition will encourage a decrease in environmental quality. The pressure of the activities of the poor is getting more extreme compared to the slow rate of natural resource recovery, it will encourage degradation and even accelerated destruction of natural resources. The movement of their destructive efforts is faster than nature's ability to restore. The results of this study are consistent with the direction of the influence of POV on environmental quality that has been carried out by previous researchers [44, 45], who found that increasing POV would increase ED.
This research found that there is a mutually influencing relationship between EG and ED, so that sustainable development is the main solution that needs to be implemented in Indonesia. Apart from that, these two variables are also influenced by various fluctuations in the macroeconomic indicators used in this research, such as INF, INV, INC, FC and POV. Furthermore, these findings play a role in economic policy or environmental policy in Indonesia. Thus, sustainable development is expected to improve the quality of life from one generation to the next.
The strategic step that can be taken by the government to overcome the problems of EG and ED is to implement a sustainable development program, namely a development process that is based on the principle of meeting the needs of the present without compromising the fulfillment of the needs of future generations. The implementation of sustainable development consists of four indicators that can be used as benchmarks. First, pro-welfare economy, namely EG activities aimed at the welfare of all members of society, which can be achieved through innovative technologies that have a minimum impact on environmental damage. Second, pro-environment, namely upholding non-anthropocentric environmental ethics which are the guidelines for people's lives. Third, pro social justice, namely ensuring justice and equality of access to natural resources and public services, respecting cultural diversity and gender equality. Fourth, pro-environment, namely implementing natural resource management and conservation policies. The implementation of sustainable development programs is carried out with the principles of economic prosperity, social justice and environmental preservation. Ultimately, achieving a balance between EG and environmental sustainability requires careful policy interventions, technological innovation, behavioral changes, and international cooperation. It involves considering the long-term consequences of economic activities on ecosystems, natural resources, and future generations, and adopting strategies that promote both prosperity and environmental stewardship. There is increasing recognition of the need for sustainable development pathways that decouple EG from ED. Concepts like green growth emphasize environmentally sustainable policies and investments that promote resource efficiency, renewable energy, circular economy principles and conservation practices. The goal is to achieve economic prosperity while minimizing negative environmental impacts.
Based on the analysis that we have done, our study only analyzed one unit cross section, so further research should consider using panel data. Then, further research is required to modify this model to consider time period analysis. Then, further research is also suggested to consider other endogenous issues related to social phenomena such as POV because economic and environmental issues are closely related to social welfare issues.
[1] Azam, M. (2020). Energy and economic growth in developing Asian economies. Journal of the Asia Pacific Economy, 25(3): 447-471. https://doi.org/10.1080/13547860.2019.1665328
[2] Aimon, H., Putri, K.A., Ulfa, S.S. (2022). Employment opportunities and income analysis before and during COVID-19: Indirect least square approach. Studies in Business and Economics, 17(2): 5-22. https://doi.org/10.2478/sbe-2022-0022
[3] Tang, K.B., Bundhoo, D. (2017). Foreign aid and economic growth in developing countries: Evidence from Sub-Saharan Africa. Theoretical Economics Letters, 7(05): 1473. https://doi.org/10.4236/tel.2017.75099
[4] Aimon, H., Kurniadi, A.P., Amar, S. (2023). Scenario of reducing carbon emission through shifting consumption of non-renewable energy to renewable energy in Asia Pacific 2023-2030. In IOP Conference Series: Earth and Environmental Science, 1151(1): 012016. https://doi.org/ 10.1088/1755-1315/1151/1/012016
[5] Bhuiyan, M.A., Zhang, Q., Khare, V., Mikhaylov, A., Pinter, G., Huang, X. (2022). Renewable energy consumption and economic growth nexus-a systematic literature review. Frontiers in Environmental Science, 10: 878394. https://doi.org/ 10.3389/fenvs.2022.878394
[6] Blampied, N. (2021). Economic growth, environmental constraints and convergence: The declining growth premium for developing economies. Ecological Economics, 181: 106919. https://doi.org/10.1016/j.ecolecon.2020.106919
[7] Kong, Y., Khan, R. (2019). To examine environmental pollution by economic growth and their impact in an environmental Kuznets curve (EKC) among developed and developing countries. PloS One, 14(3): e0209532. https://doi.org/10.1371/journal.pone.0209532
[8] Yue, S., Lu, R., Chen, H., Yuan, J. (2018). Does financial development promote the win-win balance between environmental protection and economic growth? Environmental Science and Pollution Research, 25: 36438-36448. https://doi.org/10.1007/s11356-018-3549-y
[9] Mao, C.C., Ma, Z.X. (2021). The analysis of the regional economic growth and the regional financial industry development difference in China based on the theil index. International Journal of Economics and Finance Studies, 13(1): 128-154.
[10] Yang, X., Khan, I. (2022). Dynamics among economic growth, urbanization, and environmental sustainability in IEA countries: The role of industry value-added. Environmental Science and Pollution Research, 29(3): 4116-4127. https://doi.org/10.1007/s11356-021-16000-z
[11] Lu, Q., Li, C. (2021). Comprehensive utilization of Chinese medicine residues for industry and environment protection: Turning waste into treasure. Journal of Cleaner Production, 279: 123856. https://doi.org/10.1016/j.jclepro.2020.123856
[12] Shahzad, M., Qu, Y., Javed, S.A., Zafar, A.U., Rehman, S.U. (2020). Relation of environment sustainability to CSR and green innovation: A case of Pakistani manufacturing industry. Journal of Cleaner Production, 253: 119938. https://doi.org/10.1016/j.jclepro.2019.119938
[13] World Bank. https://data.worldbank.org/, accessed on Jul. 15, 2022.
[14] Adejumo, O.O. (2020). Environmental quality vs economic growth in a developing economy: Complements or conflicts. Environmental Science and Pollution Research, 27(6): 6163-6179. https://doi.org/10.1007/s11356-019-07101-x
[15] Paramati, S.R., Alam, M.S., Chen, C.F. (2017). The effects of tourism on economic growth and CO2 emissions: A comparison between developed and developing economies. Journal of Travel Research, 56(6): 712-724. https://doi.org/10.1177/0047287516667848
[16] Aimon, H., Kurniadi, A.P., Triani, M. (2022). Determination of natural gas consumption and carbon emission in natural gas supplying countries in Asia Pacific. International Journal of Energy Economics and Policy, 12(6): 96. https://doi.org/10.32479/ijeep.13536
[17] Azam, M. (2016). Does environmental degradation shackle economic growth? A panel data investigation on 11 Asian countries. Renewable and Sustainable Energy Reviews, 65: 175-182. https://doi.org/10.1016/j.rser.2016.06.087
[18] Apergis, N., Gozgor, G., Lau, C.K.M. (2021). Globalization and environmental problems in developing countries. Environmental Science and Pollution Research, 28(26): 33719-33721. https://doi.org/10.1007/s11356-021-14105-z
[19] Borhan, H., Ridzuan, A.R., Subramaniam, G., Amin, S.M., Saad, R.M. (2021). Modelling the environmental Kuznets curve of water pollution impact on economic growth in developing country. International Journal of Energy Economics and Policy, 11(5): 545-552. https://doi.org/10.32479/ijeep.11571.
[20] Liang, W., Yang, M. (2019). Urbanization, economic growth and environmental pollution: Evidence from China. Sustainable Computing: Informatics and Systems, 21: 1-9. https://doi.org/10.1016/j.suscom.2018.11.007
[21] Alam, M.S., Paramati, S.R. (2015). Do oil consumption and economic growth intensify environmental degradation? Evidence from developing economies. Applied Economics, 47(48): 5186-5203. https://doi.org/10.1080/00036846.2015.1044647
[22] Jamel, L., Derbali, A. (2016). Do energy consumption and economic growth lead to environmental degradation? Evidence from Asian economies. Cogent Economics & Finance, 4(1): 1170653. https://doi.org/10.1080/23322039.2016.1170653
[23] Alam, M.M., Murad, M.W., Noman, A.H.M., Ozturk, I. (2016). Relationships among carbon emissions, economic growth, energy consumption and population growth: Testing environmental Kuznets curve hypothesis for Brazil, China, India and Indonesia. Ecological Indicators, 70: 466-479. https://doi.org/10.1016/j.ecolind.2016.06.043
[24] Twerefou, D.K., Danso-Mensah, K., Bokpin, G.A. (2017). The environmental effects of economic growth and globalization in Sub-Saharan Africa: A panel general method of moments approach. Research in International Business and Finance, 42: 939-949. https://doi.org/10.1016/j.ribaf.2017.07.028
[25] Yameogo, C.E., Dauda, R.O. (2022). The effect of income inequality and economic growth on environmental quality: A comparative analysis between Burkina Faso and Nigeria. Journal of Public Affairs, 22(3): e2566. https://doi.org/10.1002/pa.2566
[26] Ozcan, B., Tzeremes, P.G., Tzeremes, N.G. (2020). Energy consumption, economic growth and environmental degradation in OECD countries. Economic Modelling, 84: 203-213. https://doi.org/10.1016/j.econmod.2019.04.010
[27] Aung, T.S., Saboori, B., Rasoulinezhad, E. (2017). Economic growth and environmental pollution in Myanmar: An analysis of environmental Kuznets curve. Environmental Science and Pollution Research, 24(25): 20487-20501. https://doi.org/10.1007/s11356-017-9567-3
[28] Özokcu, S., Özdemir, Ö. (2017). Economic growth, energy, and environmental Kuznets curve. Renewable and Sustainable Energy Reviews, 72: 639-647. https://doi.org/10.1016/j.rser.2017.01.059
[29] Danish, Baloch, M.A. (2018). Dynamic linkages between road transport energy consumption, economic growth, and environmental quality: Evidence from Pakistan. Environmental Science and Pollution Research, 25: 7541-7552. https://doi.org/10.1007/s11356-017-1072-1
[30] Sanyé-Mengual, E., Secchi, M., Corrado, S., Beylot, A., Sala, S. (2019). Assessing the decoupling of economic growth from environmental impacts in the European Union: A consumption-based approach. Journal of Cleaner Production, 236: 117535. https://doi.org/10.1016/j.jclepro.2019.07.010
[31] Alvarado, R., Toledo, E. (2017). Environmental degradation and economic growth: Evidence for a developing country. Environment, Development and Sustainability, 19(4): 1205-1218. https://doi.org/10.1007/s10668-016-9790-y
[32] Ahmed, Z., Ahmad, M., Rjoub, H., Kalugina, O.A., Hussain, N. (2022). Economic growth, renewable energy consumption, and ecological footprint: Exploring the role of environmental regulations and democracy in sustainable development. Sustainable Development, 30(4): 595-605. https://doi.org/10.1002/sd.2251
[33] Saud, S., Chen, S., Haseeb, A. (2019). Impact of financial development and economic growth on environmental quality: An empirical analysis from Belt and Road Initiative (BRI) countries. Environmental Science and Pollution Research, 26(3): 2253-2269. https://doi.org/10.1007/s11356-018-3688-1
[34] Amar, S., Satrianto, A., Ariusni, Kurniadi, A.P. (2022). Determination of poverty, unemployment, economic growth, and investment in West Sumatra province. International Journal of Sustainable Development and Planning, 17(4): 1237-1246. https://doi.org/10.18280/ijsdp.170422
[35] De Gregorio, J. (2021). The effects of inflation on economic growth: Lessons from Latin America. In the Effects of Inflation on Economic Growth: Lessons from Latin America: De Gregorio, Jose. https://doi.org/doi:10.2139/ssrn.885073
[36] Bermejo Carbonell, J., Werner, R.A. (2018). Does foreign direct investment generate economic growth? A new empirical approach applied to Spain. Economic Geography, 94(4): 425-456. https://doi.org/10.1080/00130095.2017.1393312
[37] Pandey, S., Dogan, E., Taskin, D. (2020). Production-based and consumption-based approaches for the energy-growth-environment nexus: Evidence from Asian countries. Sustainable Production and Consumption, 23: 274-281. https://doi.org/10.1016/j.spc.2020.06.006
[38] Akinci, M. (2018). Inequality and economic growth: Trickle‐down effect revisited. Development Policy Review, 36: O1-O24. https://doi.org/10.1111/dpr.12214
[39] Cammeraat, E. (2020). The relationship between different social expenditure schemes and poverty, inequality and economic growth. International Social Security Review, 73(2): 101-123. https://doi.org/10.1111/issr.12236
[40] Aimon, H., Kurniadi, A.P., Amar, S. (2021), Analysis of fuel oil consumption, green economic growth and environmental degradation in 6 Asia Pacific countries. International Journal of Sustainable Development and Planning, 16(5): 925-933. https://doi.org/10.18280/ijsdp.160513
[41] Kurniadi, A.P., Aimon, H., Amar, S. (2021), Determinants of biofuels production and consumption, green economic growth and environmental degradation in 6 Asia Pacific countries: A simultaneous panel model approach. International Journal of Energy Economics and Policy, 11(5): 460-471. https://doi.org/10.32479/ijeep.11563
[42] Agusdinata, D.B., Aggarwal, R., Ding, X. (2021). Economic growth, inequality, and environment nexus: Using data mining techniques to unravel archetypes of development trajectories. Environment, Development and Sustainability, 23(4): 6234-6258. https://doi.org/10.1007/s10668-020-00870-3
[43] Venmans, F., Groom, B. (2021). Social discounting, inequality aversion, and the environment. Journal of Environmental Economics and Management, 109: 102479. https://doi.org/10.1016/j.jeem.2021.102479
[44] Rizk, R., Slimane, M.B. (2018). Modelling the relationship between poverty, environment, and institutions: A panel data study. Environmental Science and Pollution Research, 25(31): 31459-31473. https://doi.org/10.1007/s11356-018-3051-6
[45] Awad, A., Warsame, M.H. (2022). The poverty-environment nexus in developing countries: Evidence from heterogeneous panel causality methods, robust to cross-sectional dependence. Journal of Cleaner Production, 331: 129839. https://doi.org/10.1016/j.jclepro.2021.129839