Nursery Alfaridi Nasution*![]() | Idris Gautama So
| Idris Gautama So![]() | Asnan Furinto
| Asnan Furinto![]() | Rini Setiowati
| Rini Setiowati![]()
© 2024 The authors. This article is published by IIETA and is licensed under the CC BY 4.0 license (http://creativecommons.org/licenses/by/4.0/).
OPEN ACCESS
Circular economy refers to minimizing inputs and recapturing waste to address environmental, economic, and social issues that arise if the linear economic model continues. However, only a few countries have implemented the concept. Moreover, the logistics sector is not included. This occurs due to the lack of regulations regarding the circular economy. Based on those issues, this study aims to analyze the effect of institutional pressure on circular economy performance mediated by circular economy capabilities in Indonesian courier express parcel companies. The respondents of this study are middle-up managers in courier express parcel companies in DKI Jakarta. This research used quantitative approach. The sampling technique used in this research was purposive sampling technique. The data were collected using an online questionnaire, and then it was distributed to 82 companies. The survey data were analyzed using the partial least squares-structural equation modeling (PLS-SEM) method using SMART PLS 4. The result shows that institutional pressure has negative correlation effect on environmental performance and financial performance. Institutional pressure affects circular economy capability. In addition, circular economy capability significantly affects environmental performance and financial performance. Finally, circular economy capability fully mediates institutional pressure and environmental performance and fully mediates institutional pressure and financial performance.
circular economy performance, sustainable development goals, institutional pressure, circular economy capability, courier express parcel
Along with the rising number of online purchases, the frequency of using express delivery services has increased by 80% [1]. The transportation and logistics sector also experienced an increase in the second quarter of 2021 (Y-on-Y) of IDR 99.2 trillion, this growth is the highest compared to other sectors such as accommodation, food and beverages and the lowest is the agriculture sector [2]. Unfortunately, the increase in deliveries has a negative impact on the environment, especially emissions generated from transportation. In addition, product packaging mostly made of plastic, bubble wrap, and cartons or boxes increased by 96% in 2020 [3].
The continuous use of plastic materials without being managed properly will lead to an increase in plastic waste. As stated by the World Economic Forum, by 2050 the amount of plastic waste will exceed fish (in terms of weight) in the ocean unless efforts are made to reduce it, for example by ending the use of fossil-based plastics [4, 5].
Unmanaged waste and emissions can be handled by efficiently using resources and minimizing the amount of waste. Other ways to do it are by regenerating resources, emissions, and energy leaks by slowing down, closing, and shrinking material and energy cycles. This process is referred to as “cradle-to-cradle”, or “laws of ecology”, or “loop and performance economy”, or “regenerative design”, or “industrial ecology”, or “biomimicry”. or “the blue economy” [6-8]. Furthermore, the process is very closely related to planning, coordinating, executing, and collaborating, as well as finding opportunities for the use of renewable resources, which can be referred as circular economy [9]. It aims at recovery, regeneration, coordination, execution, and collaboration as well as the search for opportunities for the use of renewable resources [10, 11]. The circular economy has potential for achieving numerous Sustainable Development Goals (SDGs), that includes SDGs 6 on energy, 8 on economic growth, 11 on sustainable cities, 12 on sustainable consumption and production, 13 on climate change, 14 on oceans, and 15 on land life.
The transportation and logistics industry are reliable at successful implementation of the circular economy as the movement from one place to another is carried out by the transportation and logistics industry. The frequent transportation use without any effort to reduce the emissions has led to the emergence of adverse impacts on the environment [12, 13].
There is numerous research on transportation and logistics sector. However, only 2.86% discussed the application of circular economy in the transportation and [10, 11, 14-17]. Therefore, the researcher considered that this research is important to conduct, especially in Indonesia due to being one of the countries with the most plastic waste and emissions.
However, there are six challenges and obstacles in implementing the circular economy concept, they are: lack of clear circular economy regulations [9, 15, 18-21], collaboration between stakeholders, commitment and leadership [9, 10, 19, 21-23] consumer perceptions as end-users of products produced from recycling processes [21], and the absence of technologies that aid such implementation [9, 21, 24].
This research discusses the challenges and barriers in circular economy implementation that are most influential according to previous research, they are institutional pressure and companies' capabilities in circular economy implementation and discuss how these two variables relate to circular economy performance. Previous research has not discussed the mediating effect of circular economy capabilities on circular economy performance and analyzed the effect of institutional pressure on circular economy capabilities, so this research should fill the gap.
2.1 Institutional pressure (TI)
As the industry develops, more and more natural resources are used, leading to the depletion of available natural resources and negative impacts on the environment. The continuous use of large amounts of resources will eventually lead to scarcity, which will also impact the environment, severe climate change, and habitat destruction [9, 25]. Companies realize that it is time to run businesses in a different way as there are fewer resources to use, but there are still difficulties in applying the circular economy. In most companies, the implementation of circular economy is under the responsibility of CSR and environmental departments, most companies understand the concept of circular economy but do not apply it into business strategy [21, 26]. Prior studies have determined that institutional pressure, driven by various stakeholders such as the government, competitors, NGOs, media, customers (both local and foreign), investors, and others, is the primary force motivating companies to embrace green economy practices.
Pressure comes from the government which is then called the coercive pressure [18, 27], coercive pressure refers to the pressure that enterprises face from individuals in positions of power, such as regulatory authorities, to implement environmentally friendly practices. These pressures can be expressed as follows: environmental rules exist at the national, regional, and export levels [28]. In addition, there is pressure coming from competitors who compete with each other in reducing waste and encourage other companies to imitate the system, which is referred to as the mimetic pressure [27]. Coercive pressure refers to a pressure coming from other organizations, either formal or informal one. This type of pressure is often considered as compulsory which drives companies to change their strategic plan in order to survive. Previous research found that the correlation between coercive pressure and financial performance is negative [27], but the correlation between coercive pressure and environmental performance was found to be positive in research in China with the context of the manufacturing industry [29]. Similar research results were found in 188 companies in China [30].
In addition, normative pressure Normative pressure arises from the collective acts of communities or stakeholders, who want to professionalize organizational behavior. These actions are influenced by the rules and norms prevalent in the cultural and social context of the environment [28]. Previous study found that there is negative correlation between normative pressure and circular economy performance. However, it is also found that there is positive correlation between normative pressure and environmental performance. The research data was taken from 181 manufacturing companies in Yangtze River, China [29]. Similar result was also found at 188 companies in China [30]. While prior research found a negligible correlation between institutional pressure and environmental performance, top management support is directly correlated with institutional pressure [28].
Previous research discussed the correlation between mimetic pressure and circular economy performance. It is found that mimetic pressure affects circular economy performance in both financial and environmental performance [27]. In many cases, institutional pressure can lead to improved capabilities in various areas. However, it is important for companies to manage and integrate these changes well to gain maximum benefit from the increased capacity needed to respond to institutional pressures. Although there is some research on the impact of institutional pressure on organizational implementation of circular economy, there is less investigation into how institutional pressure specifically affects circular economy performance. Therefore, based on the previous research above, the hypotheses in this study are:
H1a: Institutional pressure (TI) positively affects environmental performance (KL).
H1b: Institutional pressure (TI) positively affects financial performance (KK).
H1c: Institutional pressures (TI) positively affect circular economy capabilities (KAP).
2.2 Circular economy capability (KAP)
Capability is the ability to do something [31] while corporate capability means the company's ability to integrate, build, and configure both internal and external competencies to achieve organizational goals [32]. Circular economy capability means a company's capability to conduct productive activities in ways that limit damage to the environment, this depends on the ability of the human resources in the company [24, 33-36]. It is also affected by several factors, such as sustainable production, and eco-innovation or environmentally friendly innovation [37]. To improve circular economy capabilities, companies should choose suppliers that prioritize environmental aspects and demonstrate green behavior.
Therefore, companies need to have the capability to reduce, reuse, and recycle. In the previous research, it was found that there is a positive correlation between circular economy capacity and circular economy performance [35, 37-40]. However, capabilities do not always improve performance. There was a research that verified the correlation between capabilities in carrying out digital transformation and its effect on company performance, and it is found that the two variables have a negative correlation, and in fact companies that have capabilities in digital transformation experience 60%-85% failure in performance [41]. The difference in the results makes this research necessary to be conducted in order to confirm the results of previous studies. Based on the description above, the hypothesis in this study is as follows:
H2a: Circular economy capabilities affects environmental performance.
H2b: Circular economy capabilities affects financial performance.
Capability refers to the company's competence to empower its resources in order to achieve company’s goals. Capability can lead to a competitive advantage. The capability variable becomes a mediator variable in research on entrepreneurial orientation in SMEs in Kuningan Regency. The study found that the innovation capability variable affects the correlation between entrepreneurial orientation and marketing performance [42]. Another research on the market orientation to marketing performance mediated by innovation capability also confirmed that capability is able to mediate the two variables. Another research that makes capabilities as mediator is in testing the effect of marketing capabilities on operating performance. In this research, it is also found that operating capabilities mediate the two variables [43]. Thus, in this study, the researcher would like to test the mediating role of circular economy capabilities in the correlation between institutional pressure and circular economy performance, in both financial performance and environmental performance, as seen on Figure 1. There has been no research focusing on circular economy capability as a mediating variable, so this research will fill the gap. The hypothesis in this study is as follows:
H3a: Circular economy capability mediates institutional pressure on environmental performance.
H3b: Circular economy capability mediates institutional pressure on financial performance.
Figure 1. Research framework
This research used a quantitative approach, using survey and direct observation. In addition, interview was also used to get a complete picture of the application of the circular economy in deposit service companies in Indonesia. This research uses purposive sampling. Purposive sampling enables researchers to intentionally select individuals or groups who hold the necessary knowledge to properly meet the research objectives. Purposive sampling guarantees that the chosen participants have the ability to offer comprehensive and profound insights into the phenomenon being studied, hence improving the quality and significance of the research findings [44, 45]. The population of this study is a company incorporated in the Indonesian Asosiasi Perusahaan Jasa Pengiriman Ekspres Indonesia (ASPERINDO). Based on 2022 data, there are 187 member companies of ASPERINDO. Nevertheless, out of the tracked companies, only 135 are currently operational. The author distributed an electronic questionnaire to 135 organizations, however, only 82 companies adhered to the survey's completion requirements. Therefore, the sample size in this study comprises 82 companies, which accounts for 61% of the total population. The sample in the study was determined based on the minimum number requirements recommended. The requirement itself depends on the number of variables in the study; in this study it was 10 or more from the variables. This study used 4 variables, so the minimum sample size was 40 respondents. In this study, there were 82 valid respondents. A sample size greater than 30 and less than 500 is an appropriate sample size for most studies [46]. PLS-SEM was used to analyze the study because it seeks to anticipate the underpinning theoretical framework. PLS-SEM was used to analyze the study because this is exploratory research that aims to develop previous theories. As stated earlier, the population in this study is small because it is business-to-business research, so the use of SEM is recommended [47].
The questionnaire was developed based on several previous studies. The author adopted the concept based on the following sources to measure institutional pressure [35, 37, 48-51]. To measure circular economy capability, the author adapted from the following articles [35, 37, 48-51], and to measure circular economy performance the author adapted these following articles [17, 27, 52-57]. All questions employ a 7-point Likert Scale, with 1 representing “totally disagree” and 7 representing “totally agree”.
The expected respondents in this study were middle management to top management. The real respondents were 1% Business Owners, 4% Directors, 2% General Managers, 9% Senior Managers, 52% Managers, and 32% Supervisors. Of the 82 respondents, 23% were around 20 - 40 years old and 77% were over 40 years old. The questionnaire results also found that 59% of companies have implemented circular economy in their company, as seen in Table 1.
Table 1. Demographic profile of the respondents
|
Categories |
Percentages (%) |
|
Gender |
|
|
Male |
71% |
|
Female |
29% |
|
Age |
|
|
20 - 40 years old |
23% |
|
> 40 years old |
77% |
|
Position |
|
|
Business Owner |
1% |
|
Director |
4% |
|
General Manager |
2% |
|
Senior Manager |
9% |
|
Manager |
52% |
|
Supervisor |
32% |
|
Education |
|
|
Higher |
6% |
|
Diploma |
8% |
|
Undergraduate |
76% |
|
Master |
6% |
|
Doctoral |
4% |
|
Working Experience |
|
|
< 1 year |
19% |
|
1 - 2 year(s) |
28% |
|
3 - 5 years |
26% |
|
> 5 years |
27% |
|
Has the company you work for implemented the circular economy concept? |
|
|
Already |
59% |
|
Not yet |
41% |
4.1 Measurement model
Smart PLS 4 was used to analyze the data in this study. After screening the data and evaluating common methods, the measurement models' reliability and validity were evaluated. The structural model was then analyzed with the PLS algorithm, bootstrap, and blindfolding procedure. Convergent validity is a measure to assess if the manifest variable can reflect the latent variable being measured. In this study, there is a latent variable that has a sub-variable, which is institutional pressure, so the measurement of convergent validity uses two levels, a higher-order construct while measuring the validity for circular economy capability variables, financial performance, and environmental performance using lower order construct. Manifest variables are declared capable of measuring latent variables when the loading factor (LF) value of each manifest variable produces a value > 0.700, and an average variance extracted (AVE) value > 0.500. All latent variable measurements are reflective.
Based on Table 2, the loading factor value of the circular economy capability latent variable is ranged between 0.884 - 0.952, and it is greater than 0.700. The loading factor on the latent variable of financial performance is ranged between 0.867 - 0.926, and it is greater than 0.700. Similarly, the loading factor latent variable on environmental performance is in the range of 0.915 - 0.962 and greater than 0.700. Furthermore, the AVE on each latent variable is > 0.500. This means that the manifest variable has reflected the latent variable well. In other words, convergent validity has been well met. Furthermore, the composite reliability (CR) for the circular economy capability latent variable is 0.948 > 0.700. The CR for the financial performance and environmental performance latent variables, respectively, is 0.942 and 0.933 > 0.700. Since the CR value for each latent variable is > 0.700, it can be concluded that all manifest variables consistently measure their latent variables.
Table 2. Convergent validity and reliability - lower order construct (LOC)
|
Construct |
Item |
LF |
AVE |
CR |
|
Circular Economy Capability (KAP) |
KAP1: Energy and raw material efficiency are top priorities for the company I work for. |
0.937 |
0.865 |
0.948 |
|
KAP2: My workplace has implemented efforts aimed at enhancing energy efficiency in our operational processes. |
0.952 |
|||
|
KAP3: Paper and cardboard that are still usable are recycled by the company where I work. |
0.946 |
|||
|
KAP4: Cleaning supplies are frequently used in the business where I work. |
0.884 |
|||
|
Financial Performance (KK) |
KK1: During the previous three years, my workplace has implemented measures to decrease the quantity of resources utilized. |
0.867 |
0.805 |
0.942 |
|
KK2: Over the past three years, the company where I work has reduced its energy usage. |
0.896 |
|||
|
KK3: Over the past three years, my employer has reduced the amount of money spent on waste treatment and pollution mitigation. |
0.919 |
|||
|
KK4: Over the past 3 years, my employer has implemented initiatives to minimize waste by promoting the practice of reusing materials. |
0.926 |
|||
|
KK5: The organization where I work has spent the last three years trying to reduce waste by using resources more efficiently (reduce) (e.g. technology development). |
0.875 |
|||
|
Environmental Performance (KL) |
KL1: During the past three years, there has been a decline in air pollution at my office. |
0.915 |
0.880 |
0.933 |
|
KL2: Over the past three years, there has been a decline in the amount of solid trash, including paper and plastic, at my workplace. |
0.937 |
|||
|
KL3: Overall, the amount of pollution and solid waste, as well as exposure to hazardous goods and materials, has reduced in the last 3 years. |
0.962 |
Table 3 presents the measurement of convergent validity and reliability with a higher order construct approach. The institutional pressure latent variable is measured by the sub-variables of TK, TM, and TN. Furthermore, each sub-variable, TK, TM, and TN, is measured by its manifest variable. The loading factor value at the higher level for the TK sub-variable is 0.910 > 0.700, with an AVE value of 0.648 > 0.500. The loading factor for the TM sub-variable is 0.840 > 0.700 with an AVE value of 0.648 > 0.500 and the loading factor value for the TN sub-variable is 0.919 > 0.700 with an AVE value of 0.648 > 0.500. Furthermore, the loading factor value at the lower level for the manifest variables of TK, TM, and TN also produces a value greater than 0.700. These results indicate that the measurement of convergent validity at the higher and lower order levels has been well fulfilled. This means that the sub-variables TK, TM, and TN with their manifest variables reflect the latent variable of institutional pressure. The CR value for the latent variable institutional pressure is 0.941 > 0.700. Because the CR value at the higher and lower levels for each latent variable > 0.700, it can be concluded that all manifest variables consistently measure the latent variable.
Table 3. Convergent validity and reliability - higher order construct (HOC)
|
Higher Order |
Lower Order |
LF |
AVE |
CR |
|
Institutional Pressure (TI) |
TK |
0.910 |
0.648 |
0.941 |
|
TM |
0.840 |
|||
|
TN |
0.919 |
4.2 Discriminant validity
Discriminant validity is a measure of a construct that differs from other constructs. Therefore, determining discriminant validity provides an indication that a certain construct is unique, and it is also able to explain phenomena that are not represented by other constructs in the model. The author measures discriminant validity testing using the Fornell Larcker Criterion (FLC) approach.
Table 4. Discriminant validity
|
KAP |
KK |
KL |
TK |
TM |
TN |
|
|
KAP |
0.930 |
|
||||
|
KK |
0.880 |
0.897 |
||||
|
KL |
0.909 |
0.879 |
0.938 |
|||
|
TK |
0.422 |
0.418 |
0.405 |
0.920 |
||
|
TM |
0.600 |
0.621 |
0.585 |
0.596 |
0.898 |
|
|
TN |
0.513 |
0.490 |
0.457 |
0.782 |
0.694 |
0.885 |
Based on Table 4, the square root value of AVE for each construct is greater than the correlation between constructs. In other words, the comparison of the AVE square root value and the correlation value of the latent variable with its own latent is greater than the correlation value of the latent with other latents. For example, the KAP latent variable has an AVE square root of 0.930 > and is greater than the correlation value of the KAP latent variable with other latent variables.
4.3 Inner model measurement
In addition to testing the research hypothesis, measurement of the inner model is carried out for the evaluation of the structural model. Structural model evaluation refers to the R-Square (R2) value, F-Square-effect size (F2), and predictive power with PLS-predict.
4.3.1 Hypothesis testing
To test the hypothesis, t-test was conducted using the bootstrapping method. It was based on the formula of t-table two tail test with value of 1.96, and with a significance level of 0.05. Furthermore, the t-table value (1.96) was used as a cut off value for determining whether the hypothesis would be accepted or rejected. Table 5 explains in detail the results of the bootstrapping analysis.
Table 5. Hypothesis result - direct
|
Direct |
STD |
STDEV |
T stats |
P values |
Remarks |
|
KAP -> KK |
0.826 |
0.057 |
14.523 |
0.000 |
Accepted |
|
KAP -> KL |
0.892 |
0.052 |
17.032 |
0.000 |
Accepted |
|
TI -> KAP |
0.566 |
0.104 |
5.447 |
0.000 |
Accepted |
|
TI -> KK |
0.096 |
0.071 |
1.346 |
0.178 |
Rejected |
|
TI -> KL |
0.030 |
0.051 |
0.584 |
0.559 |
Rejected |
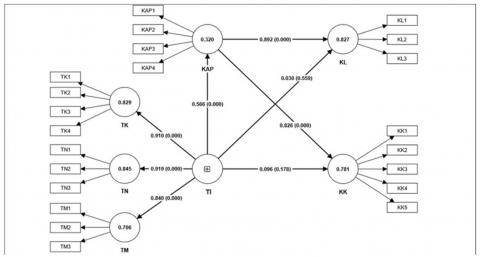
Based on Table 5, it can be seen that of the 5 direct hypotheses tested, 3 hypotheses are accepted, and 2 hypotheses are rejected. KAP has a positive and significant effect on KK with a t-value of 14.523 > 1.96 and a p-value of 0.000 < 0.05. KAP has a positive and significant effect on KL with a t-value of 17.032 > 1.96 and a p-value of 0.000 < 0.05. TI has a positive and significant effect on KAP because the t-value is 1.346 > 1.96 and the p-value is 0.000 < 0.05. Furthermore, TI has no significant effect on KK because the t-value is 1.346 < 1.96 and the p-value is 0.178 > 0.05. Finally, TI has no significant effect on KL because the t-value is 0.584 < 1.96 and the p-value is 0.559 > 0.05. These results prove that the hypothesis that states TI positively affects KL is rejected.
Table 6. Hypothesis result - indirect
|
Indirect |
STD |
STDEV |
T stats |
P values |
Remarks |
|
TI -> KAP -> KK |
0.467 |
0.095 |
4.925 |
0.000 |
Full Mediation |
|
TI -> KAP -> KL |
0.505 |
0.09 |
5.634 |
0.000 |
Full Mediation |
Table 6 presents the results of indirect testing in the structural model. As a result, the circular economy capability (KAP) variable is a fully mediating variable because the effect of the institutional pressure (TI) variable on financial performance (KK), which was initially significant, becomes insignificant because the t-value is 4.925 > 1.96 and the p-value is 0.000 < 0.05. Finally, the circular economy capability (KAP) variable is also a fully mediating variable because after adding this variable, the effect of the institutional pressure (TI) variable on environmental performance (KL) which was initially significant becomes insignificant because the t-value is 5.634 > 1.96 and the p-value is 0.000 < 0.05. Theoretically in the structural model, the circular economy capability (KAP) is fully a mediator. In other words, institutional pressure (TI) affects financial performance (KK) through circular economy capability (KAP), and institutional pressure (TI) affects environmental performance (KL) through circular economy capability (KAP).
4.3.2 R-Square
R-Square is an explanation of exogenous latent variables on endogenous latent variables at the structural model level. The R-Square assessment criteria in the structural model adopts the theory [58]. The R-Square value of ≥ 0.75 means that the exogenous latent variable makes a strong contribution to the endogenous latent variable at the structural model level. The R-Square value of 0.50 - 0.74, means that the exogenous latent variable makes a moderate contribution to the endogenous latent variable at the structural model level. An R-Square value of 0.25 - 0.49, means that the exogenous latent variable makes an insignificant contribution to the endogenous latent variable at the structural model level.
Table 7 provides information that simultaneously KAP and institutional pressure make a strong contribution to shaping KK since the R-Square value is 0.781. In other words, 78.1% of the latent variable KK is explained by KAP and institutional pressure simultaneously in the structural model. Furthermore, KAP and institutional pressure make a strong contribution to shaping KL with an R-Square value of 0.827. In other words, 82.7% of the latent variable KL is explained by KAP and institutional pressure simultaneously in the structural model. Finally, institutional pressure does not make a strong contribution to shaping KAP with an R-Square value of 0.320.
Table 7. R-Square
|
Path |
R-Square |
Criteria |
|
KAP -> KK |
0.781 |
Strong |
|
TI -> KK |
||
|
KAP -> KL |
0.827 |
Strong |
|
TI -> KL |
||
|
TI -> KAP |
0.320 |
Weak |
4.3.3 F-Square
Table 8. F-Square
|
Path |
F-Square |
Criteria |
|
KAP -> KK |
2.12 |
Strong |
|
TI -> KK |
0.028 |
Weak |
|
KAP -> KL |
3.125 |
Strong |
|
TI -> KL |
0.004 |
No Effect |
|
TI -> KAP |
0.471 |
Strong |
F-Square partially explains the effect of exogenous latent variables on endogenous latent variables. Sarstedt et al. [58] explained that there are limits to interpreting the F-Square value. The F-Square value of 0.020 - 0.149 means that the effect between variables is weak. The F-Square value of 0.150 - 0.349 means that the effect between variables is moderate and finally, the F-Square value ≥ 0.35 means that the effect between variables is strong. Table 8 indicates that partially, KAP has a strong effect on KK because the F-Square value is 2.120 ≥ 0.35. Meanwhile, institutional pressure has a weak effect on KK because the F-Square value is 0.028 which is in the range of 0.020 - 0.149. Then, KAP has a strong effect on KL because the F-Square value is 3.125 ≥ 0.35. Furthermore, institutional pressure has no effect on KL because it produces an F-Square value of 0.004, and finally institutional pressure has a strong effect on KAP because the F-Square value is 0.471 ≥ 0.35.
To test the total effect size of the indirect relationship, this study used the Upsilon (v) statistic which is similar to F-Square. The Upsilon (v) value is obtained by the formula:
$v=(\beta 1)^2 \times(\beta 2)^2$ (1)
Eq. (1): Upsilon (v)
Explanation:
β1 = beta coefficient of the direct path X → Z (mediation)
β2 = beta coefficient of the direct path X → Y
Upsilon's assessment criteria adopts Cohen's F-Square rule of thumb modified by Ogbeibu et al. [59], that states v = 0.175 (strong mediating influence); 0.075 (moderate mediating influence) and 0.01 (low mediating influence). Thus, the beta coefficient of the direct path of institutional pressure with KK is 0.096 and the beta coefficient of the direct path of KAP pressure with KK is 0.826. Then the upsilon value = (0.096)2 × (0.826)2 = 0.00628786 and is categorized as having no mediating influence because the Upsilon value < 0.01. Then, the beta coefficient of the direct path of institutional pressure with KL is 0.030 and the beta coefficient of the direct path of KAP pressure with KL is 0.892. Then the upsilon value = (0.030)2 × (0.892)2 = 0.0007161 and is categorized as having no mediating influence because the Upsilon value < 0.01, as mentioned on Table 9 as total effect size of indirect correlations.
Table 9. Total effect size of indirect correlations
|
Indirect |
Upsilon (v) |
Description |
|
TI -> KAP -> KK |
0.00628786 |
No Effect |
|
TI -> KAP -> KL |
0.0007161 |
No Effect |
4.3.4 Predictive relevance
PLS-predict is a measure of the predictive power of the structure model when implemented outside the research sample (holdout sample). The size of the predictive power of the structural model in the sample uses the CVPAT (Cross-Validated Predictive Ability Test) approach. To determine PLS-predict criteria, this study used the rule of thumb of Shmueli et al. [60]. On the other hand, the CVPAT measure refers to Sharma et al. [61], which states if the value of PLS-SEM vs indicator average (IA) and PLS-SEM vs Linear Model (LM) and produces a negative value on average loss and significance < 0.05 then the model has good predictive power.
Based on Table 10, the PLS-SEM value on the RMSE and MAE measures, all indicators of endogenous latent variables, produced negative values. In other words, PLS-SEM < LM on RMSE and MAE measures. Therefore, it can be concluded that the model has good predictive value when interpreted outside the research sample.
Table 10. PLS predict
|
Q² Predict |
RMSE |
MAE |
RMSE |
MAE |
|||
|
PLS-SEM |
LM |
PLS-SEM |
LM |
PLS-LM |
PLS-LM |
||
|
KAP1 |
0.23 |
1.29 |
1.627 |
1.003 |
1.209 |
-0.342 |
-0.206 |
|
KAP2 |
0.268 |
1.28 |
1.522 |
0.956 |
1.086 |
-0.241 |
-0.13 |
|
KAP3 |
0.249 |
1.35 |
1.558 |
1.027 |
1.125 |
-0.213 |
-0.098 |
|
KAP4 |
0.267 |
1.21 |
1.275 |
0.905 |
0.927 |
-0.063 |
-0.022 |
|
KK1 |
0.288 |
1.13 |
1.263 |
0.914 |
0.975 |
-0.131 |
-0.061 |
|
KK2 |
0.156 |
1.29 |
1.187 |
1.005 |
0.938 |
0.099 |
0.067 |
|
KK3 |
0.189 |
1.24 |
1.325 |
0.936 |
1.005 |
-0.088 |
-0.069 |
|
KK4 |
0.226 |
1.2 |
1.261 |
0.88 |
0.992 |
-0.063 |
-0.112 |
|
KK5 |
0.333 |
1.1 |
1.29 |
0.878 |
0.976 |
-0.188 |
-0.098 |
|
KL1 |
0.264 |
1.3 |
1.488 |
0.969 |
1.123 |
-0.193 |
-0.154 |
|
KL2 |
0.188 |
1.3 |
1.44 |
0.98 |
1.094 |
-0.139 |
-0.114 |
|
KL3 |
0.237 |
1.21 |
1.312 |
0.879 |
0.991 |
-0.101 |
-0.112 |
Based on Table 11, it shows the average loss difference value in PLS-SEM vs Indicator Average (IA). All latent variables produce negative values and a significance level of 0.000 < 0.05. The same thing in PLS-SEM vs Linear Model (LM), the latent variables KAP, KK and KL produce negative values and all latent constructs produce a significance value of 0.000 < 0.05. It can be concluded that the model has good predictive value. The hypotheses testing result can be found in Figure 2.
Table 11. Average loss difference in PLS-SEM vs indicator average (IA)
|
PLS-SEM vs IA |
PLS-SEM vs LM |
|||||
|
ALD |
t value |
p value |
ALD |
T value |
P value |
|
|
KAP |
-0.557 |
2.341 |
0.022 |
-0.612 |
2.385 |
0.019 |
|
KK |
-0.442 |
2.514 |
0.014 |
-0.181 |
1.289 |
0.201 |
|
KL |
-0.483 |
2.299 |
0.024 |
-0.391 |
2.572 |
0.012 |
|
Overall |
-0.862 |
4.804 |
0.000 |
0.137 |
1.692 |
0.094 |
Figure 2. PLS-SEM result
This research enriches the literature on the circular economy, especially in the courier express parcel industry. In addition, it is expected to be a reference for implementation in the industry. This study found that institutional pressure does not affect environmental performance (H1a is rejected) this also confirms previous research [27, 61]. Furthermore, institutional pressure does not affect financial performance (H1b is rejected) this also confirms previous research [27]. However, institutional pressure affects circular economy capability (H1c is accepted), meaning that the more institutional pressure is the more it improves circular economy capability (H1b is accepted). This makes this research fulfill the gap in research on the circular economy that has not discussed the correlation between institutional pressure and circular economy capabilities.
Various factors determine the impact of institutional pressure on a company's performance. Although institutional pressure is acknowledged as a factor that might influence a company's performance, research also suggests that internal factors such as leadership, employee satisfaction, and effective corporate governance have a more substantial impact. Increased employee satisfaction and commitment are favorably correlated with enhanced overall company success. This highlights the significance of internal factors within an organization, such as staff morale and organizational culture, in surpassing the influence of external institutional constraints. Companies might potentially reduce the impact of external institutional pressures on their performance by focusing on creating a favorable internal atmosphere and implementing effective management practices.
Further analysis found that circular economy capability affects environmental performance (H2a accepted) and financial performance (H2b accepted), thus confirming the results of previous studies [35, 37-40]. When there is an enhancement in circular economy capabilities, environmental performance will also improve, and when there is an improvement in circular economy capabilities, financial performance will follow.
Furthermore, this study found that institutional pressure affects environmental performance through circular economy capabilities (h3a accepted), and institutional pressure affects financial performance through circular economy capabilities (h3b accepted). This study confirms that circular economy capability exerts a full mediating effect on institutional pressure and environmental performance and exerts a full mediating influence on institutional pressure and financial performance. From those previous studies that discuss capabilities, no one has discussed circular economy capabilities specifically, so this study fills the gap.
Based on a managerial perspective, this study can be used as a reference for logistics industry especially courier express parcel in implementing the circular economy, which has become a Rencana Aksi Nasional (RAN) or National Action Plan (NAP). Moreover, the circular economy is one of the development priorities in 2020-2024. Therefore, that the circular approach can generate meaningful economic, environmental, and social benefits in 2030. However, to participate, companies need to enhance their circular economy capabilities to improve their environmental performance as well as financial performance, as stated in the result of this study. In addition, governments, non-profit organizations and other industries are expected to immediately design and implement circular economy concepts not only in their vision and mission statements but also in their short-, medium- and long-term strategies [26].
This study answered all hypotheses: institutional pressure does not significantly affect environmental performance and financial performance. However, institutional pressure has a significant effect on circular economy capability, and circular economy capability has a significant effect on financial performance and environmental performance. Then, institutional pressure affects environmental performance through circular economy capability, and institutional pressure affects financial performance through circular economy capability. Therefore, the performance of the circular economy is negatively impacted by pressure from the government and similar businesses. Businesses already understand and are aware of the benefits of implementing the circular economy, so they do not need to be coerced into doing so. To improve the performance of the circular economy, the role of top-level management is indispensable. The circular economy needs to be included in the business plan so that everyone in the company is aware of it and putting it into practice.
On the other hand, companies need to strengthen their capability in implementing circular economy as it will affect their performance. The ability to establish a circular economy will benefit not only environment but also social and economy. It will reduce the amount of unmanaged goods and emissions, improving the quality of the air. The quality of life will directly benefit from waste reduction and air pollution reduction.
This study has several limitations, and there are some ways to improve it, for example regarding to the respondents’ data. There could have been more data to analyze, so that this study would have been better. This can be done by generalizing the population to all courier express parcel companies in Indonesia, whether they have joined the association or not. The research framework in this study can be tested in different industries, so that other industries can identify circular economy performance and the factors that affect it. In addition, further research can use firm size as a control variable to get a more comprehensive description.
Thanks to the promoter team from the Doctor of Research in Management, Bina Nusantara University, namely Prof. Idris Gautama So, Dr. Asnan Furinto, and Dr. Rini Setiowati. This research can be completed, because of their support and guidance. This research is part of a dissertation that was submitted as partial fulfillment to meet requirements for the degree of Doctor of Management at BINUS Business School Doctor of Research in Management, Bina Nusantara University.
[1] Bayu, D.J. (2020). Survei MarkPlus: Frekuensi penggunaan jasa kurir meningkat saat pandemi. Diakses Pada Tanggal, 21.
[2] Kusnandar, V.B. (2021). Sektor transportasi dan pergudangan tumbuh 25,10 persen pada kuartal II-2021. https://databoks.katadata.co.id/datapublish/2021/08/05/sektor-transportasi-dan-pergudangan-tumbuh-2510-persen-pada-kuartal-ii-2021.
[3] Indonesia, L.I.P. (2020). Peningkatan sampah plastik dari belanja online dan delivery selama PSBB. http://lipi. go.id/berita/single/Peningkatan-Sampah-Plastik-dari-Belanja-Onlinedan-Delivery-Selama-PSBB/22037.
[4] Moraga, G., Huysveld, S., Mathieux, F., Blengini, G.A., Alaerts, L., Van Acker, K., Dewulf, J. (2019). Circular economy indicators: What do they measure? Resources, Conservation and Recycling, 146: 452-461. https://doi.org/10.1016/j.resconrec.2019.03.045
[5] World Economic Forum. (2016). The new plastics economy: Rethinking the future of plastics. Ellen MacArthur Found, 1-36.
[6] Geissdoerfer, M., Morioka, S.N., de Carvalho, M.M., Evans, S. (2018). Business models and supply chains for the circular economy. Journal of Cleaner Production, 190: 712-721. https://doi.org/10.1016/j.jclepro.2018.04.159
[7] Stahel, W.R. (2016). The circular economy. Nature, 531(7595): 435-438. https://doi.org/10.1038/531435a
[8] Geissdoerfer, M., Savaget, P., Bocken, N.M., Hultink, E.J. (2017). The circular economy-A new sustainability paradigm. Journal of Cleaner Production, 143: 757-768. https://doi.org/10.1016/j.jclepro.2016.12.048
[9] Saroha, M., Garg, D., Luthra, S. (2018). Key issues and challenges in circular supply chain management implementation-A systematic review. International Journal of Applied Engineering Research, 13(9): 91-104.
[10] Farooque, M., Zhang, A., Thürer, M., Qu, T., Huisingh, D. (2019). Circular supply chain management: A definition and structured literature review. Journal of Cleaner Production, 228: 882-900. https://doi.org/10.1016/j.jclepro.2019.04.303
[11] Sassanelli, C., Rosa, P., Rocca, R., Terzi, S. (2019). Circular economy performance assessment methods: A systematic literature review. Journal of Cleaner Production, 229: 440-453. https://doi.org/10.1016/j.jclepro.2019.05.019
[12] Nasution, N.A.S., So, I.G., Furinto, A., Setiowati, R. (2022). Circular economy in courier express parcel in Indonesia. In 2022 7th International Conference on Business and Industrial Research (ICBIR), Bangkok, Thailand, pp. 243-248. https://doi.org/10.1109/ICBIR54589.2022.9786473
[13] Van Buren, N., Demmers, M., Van der Heijden, R., Witlox, F. (2016). Towards a circular economy: The role of Dutch logistics industries and governments. Sustainability, 8(7): 647. https://doi.org/10.3390/su8070647
[14] Calzolari, T., Genovese, A., Brint, A. (2021). The adoption of circular economy practices in supply chains-An assessment of European Multi-National Enterprises. Journal of Cleaner Production, 312: 127616. https://doi.org/10.1016/j.jclepro.2021.127616
[15] Farooque, M., Zhang, A., Liu, Y. (2019). Barriers to circular food supply chains in China. Supply Chain Management: An International Journal, 24(5): 677-696. https://doi.org/10.1108/SCM-10-2018-0345
[16] Heyes, G., Sharmina, M., Mendoza, J.M.F., Gallego-Schmid, A., Azapagic, A. (2018). Developing and implementing circular economy business models in service-oriented technology companies. Journal of Cleaner Production, 177: 621-632. https://doi.org/10.1016/j.jclepro.2017.12.168
[17] Zhu, Q., Geng, Y., Lai, K.H. (2010). Circular economy practices among Chinese manufacturers varying in environmental-oriented supply chain cooperation and the performance implications. Journal of Environmental Management, 91(6): 1324-1331. https://doi.org/10.1016/j.jenvman.2010.02.013
[18] Jänicke, M. (2008). Ecological modernisation: New perspectives. Journal of cleaner production, 16(5): 557-565. https://doi.org/10.1016/j.jclepro.2007.02.011
[19] Fusion. (2014). The fusion observatory: The circular economy embedding low carbon thinking through the life of a business. https://www.kent.gov.uk/__data/assets/pdf_file/0020/49520/Fusion-project-report.pdf.
[20] Fusion. (2014). How to shift towards the circular economy from a small and medium business perspective: A guide for policy makers. 1-23. https://www.kent.gov.uk/__data/assets/pdf_file/0013/19210/How-to-shift-towards-the-circular-economy.pdf.
[21] Kirchherr, J., Piscicelli, L., Bour, R., Kostense-Smit, E., Muller, J., Huibrechtse-Truijens, A., Hekkert, M. (2018). Barriers to the circular economy: Evidence from the European Union (EU). Ecological Economics, 150: 264-272. https://doi.org/10.1016/j.ecolecon.2018.04.028
[22] Sousa-Zomer, T.T., Magalhães, L., Zancul, E., Cauchick-Miguel, P.A. (2018). Exploring the challenges for circular business implementation in manufacturing companies: An empirical investigation of a pay-per-use service provider. Resources, Conservation and Recycling, 135: 3-13. https://doi.org/10.1016/j.resconrec.2017.10.033
[23] Desoe, G., Mathew, P., Peng, Y. (2020). Moving toward a circular economy. Inside Indonesia. https://www.insideindonesia.org/moving-toward-a-circular-economy.
[24] Antikainen, M., Uusitalo, T., Kivikytö-Reponen, P. (2018). Digitalisation as an enabler of circular economy. Procedia Cirp, 73: 45-49. https://doi.org/10.1016/j.procir.2018.04.027
[25] Dagiliene, L., Frendzel, M., Sutiene, K., Wnuk-Pel, T. (2020). Wise managers think about circular economy, wiser report and analyze it. Research of environmental reporting practices in EU manufacturing companies. Journal of Cleaner Production, 274: 121968. https://doi.org/10.1016/j.jclepro.2020.121968
[26] Khan, O., Daddi, T., Iraldo, F. (2020). Microfoundations of dynamic capabilities: Insights from circular economy business cases. Business Strategy and the Environment, 29(3): 1479-1493.
[27] Jain, N.K., Panda, A., Choudhary, P. (2020). Institutional pressures and circular economy performance: The role of environmental management system and organizational flexibility in oil and gas sector. Business Strategy and the Environment, 29(8): 3509-3525. https://doi.org/10.1002/bse.2593
[28] Hebaz, A., Oulfarsi, S., Eddine, A.S. (2024). Prioritizing institutional pressures, green supply chain management practices for corporate sustainable performance using best worst method. Cleaner Logistics and Supply Chain, 10: 100146. https://doi.org/10.1016/j.clscn.2024.100146
[29] Wang, S., Wang, H., Wang, J. (2019). Exploring the effects of institutional pressures on the implementation of environmental management accounting: Do top management support and perceived benefit work? Business Strategy and the Environment, 28(1): 233-243. https://doi.org/10.1002/bse.2252
[30] Wang, S., Li, J., Zhao, D. (2018). Institutional pressures and environmental management practices: The moderating effects of environmental commitment and resource availability. Business Strategy and the Environment, 27(1): 52-69. https://doi.org/10.1002/bse.1983
[31] Eisenhardt, K.M., Martin, J.A. (2000). Dynamic capabilities: What are they? Strategic Management Journal, 21(10-11): 1105-1121. https://doi.org/10.1002/1097-0266(200010/11)21:10/11<1105::AID-SMJ133>3.0.CO;2-E
[32] Teece, D.J. (2007). Explicating dynamic capabilities: The nature and microfoundations of (sustainable) enterprise performance. Strategic Management Journal, 28(13): 1319-1350. https://doi.org/10.1002/smj.640
[33] Dzhengiz, T., Niesten, E. (2020). Competences for environmental sustainability: A systematic review on the impact of absorptive capacity and capabilities. Journal of Business Ethics, 162(4): 881-906. https://doi.org/10.1007/s10551-019-04360-z
[34] Baranova, P., Meadows, M. (2017). Engaging with environmental stakeholders: Routes to building environmental capabilities in the context of the low carbon economy. Business Ethics: A European Review, 26(2): 112-129. https://doi.org/10.1111/beer.12141
[35] Zeng, H., Chen, X., Xiao, X., Zhou, Z. (2017). Institutional pressures, sustainable supply chain management, and circular economy capability: Empirical evidence from Chinese eco-industrial park firms. Journal of Cleaner Production, 155: 54-65. https://doi.org/10.1016/j.jclepro.2016.10.093
[36] Bag, S., Pretorius, J.H.C., Gupta, S., Dwivedi, Y.K. (2021). Role of institutional pressures and resources in the adoption of big data analytics powered artificial intelligence, sustainable manufacturing practices and circular economy capabilities. Technological Forecasting and Social Change, 163: 120420. https://doi.org/10.1016/j.techfore.2020.120420
[37] Bag, S., Dhamija, P., Bryde, D.J., Singh, R.K. (2022). Effect of eco-innovation on green supply chain management, circular economy capability, and performance of small and medium enterprises. Journal of Business Research, 141: 60-72. https://doi.org/10.1016/j.jbusres.2021.12.011
[38] de Arroyabe, J.F., Arranz, N., Schumann, M., Arroyabe, M.F. (2021). The development of CE business models in firms: The role of circular economy capabilities. Technovation, 106: 102292. https://doi.org/10.1016/j.technovation.2021.102292
[39] Zhu, Q., Cordeiro, J., Sarkis, J. (2013). Institutional pressures, dynamic capabilities and environmental management systems: Investigating the ISO 9000-Environmental management system implementation linkage. Journal of Environmental Management, 114: 232-242. https://doi.org/10.1016/j.jenvman.2012.10.006
[40] Del Giudice, M., Chierici, R., Mazzucchelli, A., Fiano, F. (2021). Supply chain management in the era of circular economy: The moderating effect of big data. The International Journal of Logistics Management, 32(2): 337-356. https://doi.org/10.1108/IJLM-03-2020-0119
[41] Saldanha, T. (2019). Why successful digital transformations. https://www.ceoinsightsindia.com/tech-leader-talks/why-successful-digital-transformations-nwid-1250.html.
[42] Rois, T., Suliyanto, S., Suwandari, L. (2023). Peran orientasi wirausaha dalam meningkatkan kinerja pemasaran dengan kapabilitas inovasi sebagai mediasi. Logika: Jurnal Penelitian Universitas Kuningan, 14(1): 64-73. https://doi.org/10.25134/logika.v14i01.6000
[43] Winata, I.G.K.A., Mariantini, N.K.E. (2023). Kapabilitas operasi sebagai mediasi pengaruh kababilitas pemasaran terhadap kinerja operasi restoran di kabupaten buleleng. Jurnal Ekonomi Bisnis, Manajemen dan Akuntansi (JEBMA), 3(1): 71-77. https://doi.org/10.47709/jebma.v3i1.2782
[44] Hynes, L., Murphy, A.W., Hart, N., Kirwan, C., Mulligan, S., Leathem, C., Sinnott, C. (2022). The multimorbidity collaborative medication review and decision making (MyComrade) study: A protocol for a cross-border pilot cluster randomised controlled trial. Pilot and Feasibility Studies, 8(1): 73. https://doi.org/10.1186/s40814-022-01018-y
[45] Nolan, C.M., Patel, S., Barker, R.E., Walsh, J.A., Polgar, O., Maddocks, M., Man, W.D. (2021). Muscle stimulation in advanced idiopathic pulmonary fibrosis: A randomised placebo-controlled feasibility study. BMJ Open, 11(6): e048808. https://doi.org/10.1136/bmjopen-2021-048808
[46] Uman, S., Roger, B. (2016). Research Methods for Business (Seventh). United Kingdom: John Wiley & Sons Ltd. https://doi.org/10.1017/CBO9781107415324.004.
[47] Hair, J.F., Risher, J.J., Sarstedt, M., Ringle, C.M. (2019). When to use and how to report the results of PLS-SEM. European Business Review, 31(1): 2-24. https://doi.org/10.1108/EBR-11-2018-0203
[48] Ramanathan, R., Ramanathan, U., Zhang, Y. (2016). Linking operations, marketing and environmental capabilities and diversification to hotel performance: A data envelopment analysis approach. International Journal of Production Economics, 176: 111-122. https://doi.org/10.1016/j.ijpe.2016.03.010
[49] Xiao, X., Zeng, H. (2017). Sustainable supply chain management and circular economy capability: Based on the perspective of institutional pressure. Systems Engineering-Theory & Practice, 37(7): 1793-1804. https://doi.org/10.12011/1000-6788(2017)07-1793-12
[50] Singh, M.P., Chakraborty, A., Roy, M. (2018). Developing an extended theory of planned behavior model to explore circular economy readiness in manufacturing MSMEs, India. Resources, Conservation and Recycling, 135: 313-322. https://doi.org/10.1016/j.resconrec.2017.07.015
[51] Sun, A. (2018). Analysis of sustainable supply chain management and circular economy capability from the perspective of institutional pressure. In 2018 International Conference on Educational Research, Economics, Management and Social Sciences (EREMS 2018), pp. 109-113. https://doi.org/10.25236/erems.2018.024
[52] Susanty, A., Tjahjono, B., Sulistyani, R.E. (2020). An investigation into circular economy practices in the traditional wooden furniture industry. Production Planning & Control, 31(16): 1336-1348. https://doi.org/10.1080/09537287.2019.1707322
[53] Gimenez, C., Sierra, V. (2013). Sustainable supply chains: Governance mechanisms to greening suppliers. Journal of Business Ethics, 116: 189-203. https://doi.org/10.1007/s10551-012-1458-4
[54] Zhu, Q., Sarkis, J., Lai, K.H. (2013). Institutional-based antecedents and performance outcomes of internal and external green supply chain management practices. Journal of Purchasing and Supply Management, 19(2): 106-117. https://doi.org/10.1016/j.pursup.2012.12.001
[55] Dubey, R., Gunasekaran, A., Ali, S.S. (2015). Exploring the relationship between leadership, operational practices, institutional pressures and environmental performance: A framework for green supply chain. International Journal of Production Economics, 160: 120-132. https://doi.org/10.1016/j.ijpe.2014.10.001
[56] Colwell, S.R., Joshi, A.W. (2013). Corporate ecological responsiveness: Antecedent effects of institutional pressure and top management commitment and their impact on organizational performance. Business Strategy and the Environment, 22(2): 73-91. https://doi.org/10.1002/bse.732
[57] Feng, T., Wang, D. (2016). The influence of environmental management systems on financial performance: A moderated-mediation analysis. Journal of Business Ethics, 135: 265-278. https://doi.org/10.1007/s10551-014-2486-z
[58] Sarstedt, M., Ringle, C.M., Hair, J.F. (2021). Partial least squares structural equation modeling. In Handbook of Market Research, pp. 587-632. https://doi.org/10.1007/978-3-319-57413-4_15
[59] Ogbeibu, S., Jabbour, C.J.C., Gaskin, J., Senadjki, A., Hughes, M. (2021). Leveraging STARA competencies and green creativity to boost green organisational innovative evidence: A praxis for sustainable development. Business Strategy and the Environment, 30(5): 2421-2440. https://doi.org/10.1002/bse.2754
[60] Shmueli, G., Sarstedt, M., Hair, J.F., Cheah, J.H., Ting, H., Vaithilingam, S., Ringle, C.M. (2019). Predictive model assessment in PLS-SEM: Guidelines for using PLSpredict. European Journal of Marketing, 53(11): 2322-2347. https://doi.org/10.1108/EJM-02-2019-0189
[61] Sharma, P.N., Liengaard, B.D., Hair, J.F., Sarstedt, M., Ringle, C.M. (2023). Predictive model assessment and selection in composite-based modeling using PLS-SEM: Extensions and guidelines for using CVPAT. European Journal of Marketing, 57(6): 1662-1677. https://doi.org/10.1108/EJM-08-2020-0636