Jef Rudiantho Saragih*![]() | Agus Purwoko
| Agus Purwoko![]() | Mhd Asaad
| Mhd Asaad![]()
© 2024 The authors. This article is published by IIETA and is licensed under the CC BY 4.0 license (http://creativecommons.org/licenses/by/4.0/).
OPEN ACCESS
The main aims of the study are to classify economic sectors and compare development priorities in an Indonesian district to determine suitable programs. Gross regional domestic product data for 2011-2022 was analyzed using static location quotient, dynamic location quotient, and shift-share analysis. The results of the study showed that the district's economic sectors were classified into mainstay, leading, and potential sectors. The mainstay sector consists of electricity and gas procurement, construction, wholesale and retail trade, car and motorcycle repair, and transportation and warehousing. The leading sectors are education services, manufacturing, information and communication, and financial and insurance services. The other nine sectors are potential sectors: agriculture, forestry, and fisheries; mining and quarrying; water procurement, waste management, waste and recycling; provision of accommodation and food drink; real estate; corporate services; government administration; defense, and compulsory social security; health services and social activities; and other services. The study implies that mainstay sectors are suitable as regional development priorities. Leading sectors can be the second priority. Potential sectors are not suitable as priorities for regional development.
classifying economic sectors, dynamic location quotient, regional development priorities, shift-share analysis
Sustainable economic growth and community welfare can be achieved through appropriate regional development strategies. The determination of regional development strategies is carried out through various means. Sustainable development aims to maximize economic and social benefits. In addition, it also protects the environment for the sustainable use of natural resources in the long term [1]. Some of the concerns are the identification of strategic sectors that have a positive impact on regional economic growth [2, 3], regional socioeconomic development to promote coordinated regional development [3], determination of regional development policies based on regional development potential and vision [4, 5], capacity building and regional innovation as well as the use of new information and knowledge [6], increasing local economic growth based on economic sector integration models [7], and urban and rural development integration policies [8].
In line with research in Finland [5], regional development planning is the responsibility of local governments. Local governments work closely with other regions, universities, and other stakeholders to facilitate the planning of regional development programs. Strategic planning is based on competitive advantage. Scarce, valuable, and unique resources influence the region's competitive advantage [9].
Regional development planning strategies are based on determining development priorities. Development prioritization is determined by sector performance: sustainable comparative advantage, faster growth, and competitiveness. Comparative advantage relates to the region's specialization. Comparative advantage can increase economic resilience and welfare. The strategy that can be done is to focus on the production, distribution, and trade of goods based on the region's comparative advantage [10]. The regional development strategy is based on sustainable comparative advantage [11]. Thus, sustainable comparative advantage is key to achieving high-quality development integration [12].
Comparative advantage is the basis for sector development and trade between regions and countries [13]. Classical trade theory emphasizes that trade relies on comparative advantage based on natural resources' potential and endowment factors [14]. Regional development priorities are linked to central policy goals, political obligations/pressures, and incentives for regions to comply with central policy [15]. In this regard, the ecological conditions of the economic potential related to land resources can determine development priorities [16]. The priority of economic development policy in agropolitan areas is to increase the economic value of strategic commodities, among others, through investment incentives [17]. Regional production systems strengthen sustainable development priorities [18].
A comprehensive and sustainable regional development strategy is built on strengthening the capacity of local communities on science, technology, innovation, coordination between actors, local business networks, and internationalization of the region [19]. The availability of natural resources as local inputs will lower production costs and increase comparative advantage [20, 21].
Nevertheless, countries or regions with large comparative advantages may have low competitiveness [22]. Comparative advantage does not always present competitive advantage. Competitive advantage is achieved through innovation capabilities and superior performance [23]. Initially, local governments build comparative advantages based on existing potential and knowledge. Furthermore, new knowledge and technologies must be developed to achieve a competitive advantage [24]. For example, the product mapping method is carried out to determine the comparative advantage of export products. After that, strategic policies must be established to support downstream products [25]. Strategies to increase productivity and competitiveness are strengthening the capacity of local communities, re-engineering production systems, developing competitive advantages, increasing income and equity, and improving the quality of life of communities [16].
Competitive advantage is also influenced by products, prices, services, distribution, and promotional strategies [26], the economic value of industrial products [27], and public policy orientation [28]. Developing the base sector in rural areas encourages interaction with the city as a marketing center. This process will have an impact on regional competitiveness, add economic value, improve farmer welfare, and increase regional incomes [29].
A sector's comparative advantage, growth, and competitive advantage are used to determine the classification of the sectors. The sector classification consists of mainstay, leading, and potential sectors. In terms of regional development, these sectors are also known as base sectors, strategic sectors, or main sectors. Research on sector classification has been carried out in previous studies [30-32].
The economic base theory can be useful for effectively implementing a regional strategy [33]. Strategic sectors can drive the growth and diversification of the region's economy [34]. Increasing the base sector's productivity impacts community income and the regional economy [29]. Strategies to increase regional productivity and competitiveness can begin with identifying strengths, weaknesses, opportunities, and threats [16].
Sustainable comparative advantage, growth, and sector competitiveness are often analyzed according to location quotient, dynamic location quotient, and shift-share analysis method. Base sector identification among academics widely using location quotient (LQ) [35-38]. However, because LQ is static (SLQ), in its development, base sector analysis is equipped with the dynamic LQ (DLQ) to analyze sector development prospects [39]. In subsequent developments, the comparative advantage (measured by SLQ) and the sustainable comparative advantage (measured by DLQ) base sector are considered insufficient to determine development priorities. Therefore, shift-share analysis (SSA) integrates economic sectors' growth rate and competitiveness.
SSA was developed by Daniel Cramer in 1943 and then used by Edgar S. Dunn in 1960 to calculate labor changes in the U.S. [40]. SSA still plays an important role in regional planning analysis and has been widely used for area analysis in various fields [41]. SSA compares, measures, and evaluates the performance of inter-regional economic sectors [42] and become the most widely applied alternative method for understanding the region's economy [41]. In addition, SSA is also used to measure the relationship between industry and regional characteristics [43], analyze the sectoral contribution of the local labor market to economic resilience [44], elaborate on changes in solar energy-related investments [45], and determine the most favorable spatial clusters in the region's construction [46].
Research on the competitiveness of the economic sector has been widely conducted. Some of the research is regarding the competitiveness of the tourism sector management [47, 48], changes in rural economic development [49], analysis of import changes [42], geothermal exploitation labor structure [50], the economic impact of ports and changes in annual gross value added [51], the gross value added of regions and the performance of macroeconomic components [52], sector growth rates [16], changes in energy investment [45], the relationship of industrial structure with regional characteristics [43], changes in green investment [53], and the effects of production and employment from the region's clean energy [54].
Previous studies have widely used the combination of SLQ, DLQ, and SSA. Some of the research is about the identification of leading sectors and economic competitiveness [55, 56], agricultural leading sectors and development priorities [57], comparative and competitive advantages of processing industry subsectors [58], growth classification and sector competitiveness [59], and base sector and regional economic potential [56].
The development of mainstay and leading sectors determines regional economic growth. These sectors are suitable as priority sectors in the planning and implementation of regional development. Sector classification is carried out through the identification of mainstay and leading sectors in an empirical study. Therefore, the preparation of short and medium-term regional development planning documents must be preceded by an empirical study of the performance of economic sectors. The results of the empirical study become a reference for determining regional development priorities.
However, the problem is that the classification of economic sectors is not used to determine regional development priorities. Therefore, the mainstay and leading economic sectors are not included as regional development priorities in planning documents. The lack of empirical studies partly causes this condition to be a basis for determining regional development priorities. According to Pérez-González and Valiente-Palma [46], the result of the study can provide tools for implementing regional development policies, strategies, and initiatives.
This research is important because classifying economic sectors is a strong basis for determining regional development priorities. In addition, the classification of economic sectors will guide local governments in preparing development planning documents based on the performance of the economic sector. This study uses three analytical tools to determine the economic sector classification of the Toba District. The classification of economic sectors is established based on comparative advantage (measured by SLQ), sustainability of comparative advantage (measured by DLQ), and combined with sector growth and competitiveness (measured by SSA). The classification of economic sectors is recommended to determine the priorities of regional development programs.
The main objectives of this study are to (1) classify the economic sectors of the Toba District, (2) identify mainstay, leading, and potential sectors and comparing to current development priorities, and (3) determine appropriate and inappropriate sectors as regional development priorities in the district. The classification of economic sectors has been widely carried out in various studies. However, for the Toba District, this study is the most complete with a longer data period analysis. In addition, the novelty of this study is the addition of a comparative analysis of sector classification with development priorities in the current planning document. Furthermore, the study recommends improving priorities in subsequent development planning.
Based on the objectives of the study, the paper successively presents the methodology, results and discussion, conclusions, and references. In the results and discussion section, the main findings of this study are outlined based on objectives, namely the classification of economic sectors, identification of mainstay, leading, and potential sectors, comparison with current regional development priorities, and finally, determining appropriate and inappropriate sectors as development priorities. In conclusion, it is strongly recommended that local governments improve regional development priorities based on mainstay sectors and leading sectors.
2.1 Data
This study was carried out in Toba District from February to April 2023. The study used secondary data, namely gross regional domestic product (GRDP) economic sectors for 2011-2022. Sector GRDP secondary data is collected from online publication of the Central Bureau of Statistics (CBS) of Toba District (https://tobakab.bps.go.id) and CBS of North Sumatra Province (https://sumut.bps.go.id). The online publication is a book on GRDP by Sector 2011-2022 for Toba District and North Sumatra Province, each of which consists of four books. The terminology of sectors is based on the Regulation of the Head of the CBS of the Republic of Indonesia Number 57 as follows:
A. Agriculture, forestry, and fisheries
B. Mining and quarrying
C. Manufacturing
D. Electricity and gas procurement
E. Water procurement, waste management, waste and recycling
F. Construction
G. Wholesale and retail trade, car, and motorcycle repair
H. Transportation and warehousing
I. Provision of accommodation and food and drink
J. Information and communication
K. Financial services and insurance
L. Real estate
M, N. Corporate services
O. Government administration, defense, and compulsory social security
P. Education services
Q. Health services and social activities
R, S, T, U. Other services
2.2 Data analysis
The identification of mainstay, leading, and potential sectors is carried out through secondary data analysis of GRDP with a combination of three methods. SLQ determines the sector's comparative advantages. DLQ determines the sustainable comparative advantage. The shift-share analysis determines the growth rate and competitiveness of sectors. Previous research [46, 60] used gross domestic product (GDP) and gross regional domestic product (GRDP) to identify leading sectors. SLQ is a comparison of the contribution of each sector in the GRDP of Toba District to the GRDP of North Sumatra Province. The SLQ > 1.2 means the sector has a significant comparative advantage, 1 < SLQ ≤ 1.2 means the sector has a slightly significant comparative advantage, and (0 ≤ SLQ ≤ 1) means the sectors have no comparative advantage [65]. The SLQ equation refers to Eq. (1) [35, 58, 61]:
$\mathrm{SLQ}=\left(\frac{\frac{\mathrm{GRDP}_{\mathrm{dsi}}}{\mathrm{GRDP}_{\mathrm{dt}}}}{\frac{\mathrm{GRDP}_{\mathrm{psi}}}{\mathrm{GRDP}_{\mathrm{pt}}}}\right)$ (1)
where, SLQ is the SLQ index, GRDPdsi is the first sector GRDP in the district, GRDPdt is the total GRDP in the district, GRDPpsi is the first sector GRDP in the province, and GRDPpt is the total GRDP in the province.
DLQ analysis is used to determine the sustainable comparative advantage with the formula in Eq. (2):
$\mathrm{DLQ}=\left(\frac{\frac{(1+\mathrm{GSD})}{(1+\mathrm{GTD})}}{\frac{\mathrm{(1+GSP})}{(1+\mathrm{GTP})}}\right)^{\mathrm{t}}=\left(\frac{\mathrm{IPPSd}}{\text { IPPSp }}\right)^{\mathrm{t}}$ (2)
where, GSD is the average GRDP growth of a particular sector in a district, GTD is the average GRDP growth of a particular sector in a district, GSP is the average GRDP growth of a particular sector in a province, GTP is the average growth of total GRDP in a province, IPPSd is the index of sector development potential in the district, IPPSp is the index of sector development potential in the province, and t is the number of years. DLQ > 1 means the sector has a sustainable comparative advantage. Conversely, DLQ < 1 means the sector's comparative advantage is unsustainable.
The SSA is divided into components: district growth effect (DGE) shows the growth of sector GRDP in the district that must be achieved according to the level of sector change in the province. A positive DGE indicates that sectors in the district have a growth advantage and vice versa. The sectoral structure effect (SSE) represents the difference in sector growth rates between districts and provinces. A positive SSE means the sector has a structural advantage and good growth, and conversely, a sector has a structural disadvantage and poor growth if the SSE is negative. Sectoral competitive effect (SCE) represents competitive sectors in districts based on differences in sector GRDP changes between districts and provinces. A sector is strongly competitive if SCE is positive, and conversely, a sector is weakly competitive if SCE is negative [49]. A positive (negative) SSE also indicates that the sector in the district is growing faster (slower) than the same sector in the province [53]. The SSA is formulated as in Eq. (3), Eq. (4), Eq. (5), and Eq. (6) [48, 49]:
Changes in i-sector income in the district:
$\left(\Delta\right.$ isreg $\left._{\mathrm{i}}\right)=$ DGE + SSE + SCE (3)
$\mathrm{DGE}=\left(\frac{\text { iprov22 }}{\text { iprov11 }}-1\right)$ (4)
$\mathrm{SSE}=\left(\frac{\text { isprov } 22_{\mathrm{i}}}{\text { isprov } 11_{\mathrm{i}}}-\frac{\text { iprov22 }}{\text { iprov11 }}\right)$ (5)
$\mathrm{SCE}=\left(\frac{\mathrm{isdis} 22_{\mathrm{i}}}{\mathrm{isdis} 11_{\mathrm{i}}}-\frac{\mathrm{isprov} 22_{\mathrm{i}}}{\mathrm{isprov} 11_{\mathrm{i}}}\right)$ (6)
where, DGE is the district growth effect, iprov22 was the province’s income (GRDP) in 2022, iprov11 was the province’s income in 2011; SSE is the sectoral structure effect, isprov22i is the income of the i-sector in the province in 2022, isprov11i is the income of the i-sector in the province in 2011, SCE is the sectoral competitive effect, isdis22i is the income of the i-sector in the district in 2022, isdis11i was income of the i-sector in the district in 2011.
A sector is classified as a mainstay sector if it has a sustainable comparative advantage, grows faster, and is strongly competitive. The leading sector has a sustainable comparative advantage and grows faster but weakly competitive. The rest are potential sectors. The criteria for sector classification are based on comparative advantage (DLQ), growth, and competitiveness (SSA). The criteria in Table 1 are the authors' formulations from previous studies [35, 48, 49, 55-59, 61].
Table 1. Criteria for the economic sectors classification
|
DLQ |
Shift-Share |
Interpretation |
Classification |
|
|
Growth |
Competitive |
|||
|
>1 |
+ |
+ |
Sustainable CA, grows faster, strongly competitive |
Mainstay sector |
|
>1 |
+ |
- |
Sustainable CA, grows faster, weakly competitive |
Leading sector |
|
>1 |
- |
+ |
Sustainable CA, grows slower, strongly competitive |
Leading sector |
|
>1 |
- |
- |
Sustainable CA, grows slower, weakly competitive |
Potential sector |
|
<1 |
+ |
+ |
Unsustainable CA, grows faster, strongly competitive |
Leading sector |
|
<1 |
+ |
- |
Unsustainable CA, grows faster, weakly competitive |
Potential sector |
|
<1 |
- |
+ |
Unsustainable CA, grows slower, strongly competitive |
Potential sector |
|
<1 |
- |
- |
Unsustainable CA, grows slower, weakly competitive |
Lagging sector |
Source: Authors’s formulation (2023)
3.1 Regional overview
Toba District was a new autonomous region in 1998 and was divided into two regencies in 2003, namely Toba Samosir and Samosir. This district became Toba District in 2020. Toba District includes 16 subdistricts, 231 villages, and 13 city villages (Central Bureau of Statistics/CBS of Toba District, 2023). The area of Toba District is 2,021km2. The population in 2021 is 208,754 people (CBS of Toba District, 2022). Balige City, as the capital, is a strategic city in developing Lake Toba tourism as one of Indonesia's Super-priority Destinations. Lake Toba's beach and aquatic areas in Balige City have become a venue for the Formula 1 motorboat world championship (F1H2O) in February 2023.
The performance of regional development in Toba District is as follows (CBS of North Sumatra, 2023): the number of poor people 8.89% (North Sumatra Province/NSP=8.42%), open unemployment rate 1.39% (NSP=6.16%), human development index 75.96 (NSP=72.71), GRDP growth 4.24% (NSP=4.73%), and GRDP per capita based on current prices IDR42.16 million (NSP=IDR63.19 million).
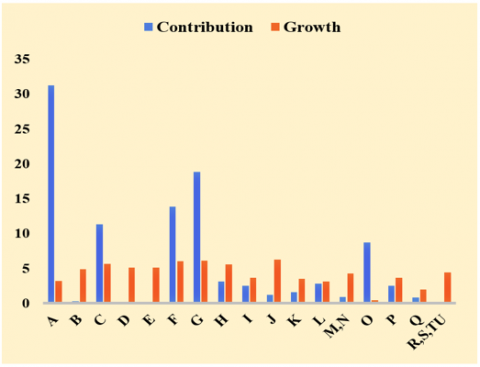
The contribution of the agriculture, forestry, and fisheries sectors to the GRDP of Toba District in 2022 is the largest at 31.24%, although in the same year, it experienced negative growth (Figure 1). The contribution of the large trade and retail sector and the repair of cars and motorcycles is 18.80%, the construction sector (13.87%), the processing industry sector (11.34%), the government administration, defense, and compulsory social security sector (8.70%). Other sectors provide a relatively small contribution of 16.05% (CBS of Toba District, 2023).
Growth of all sectors is positive in 2022 (CBS Toba District, 2023). The highest growth was in the information and communication sector (6.29%), followed by the large trade and retail, car and motorcycle repair (6.09%), construction (6.01%), manufacturing (5.64%), transportation and warehousing (5.60%), electricity and gas procurement (5.15%), water procurement, waste management, waste, and recycling (5.13%), mining and quarrying (4.88%), other services (4.46%), and corporate services (4.24%). In 2020, during the COVID-19 pandemic, the growth of some sectors was negative, including transportation and warehousing (-4.64%), construction (-4.25%), other services (-1.90%), and agriculture, forestry, and fisheries sector (<-1%).
Figure 1. Contribution (%) and growth rate (%) of the economic sectors on GRDP in 2022
Investment has a significant impact on the growth of the agricultural sector [62]. Agricultural investment must be in line with the principles of responsible land management [63]. In addition, for agricultural and tourism development, the previous research recommends rural development policies based on agro-ecotourism and incorporating economic, social, cultural, institutional, ecological, and technological aspects [64].
3.2 Result of data analysis
3.2.1 SLQ analysis
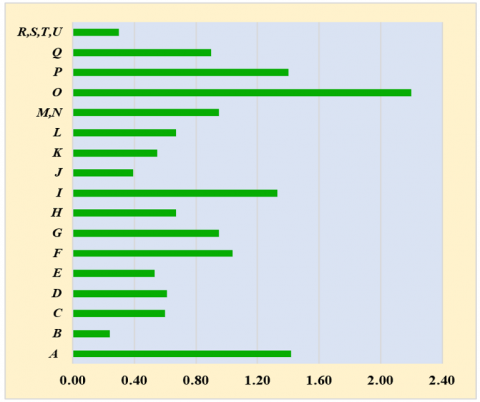
Based on the average SLQ value for 2011-2022 (Figure 2), five sectors are the base sector (SLQ > 1), namely the agriculture, forestry, and fisheries sector (Sector A = 1.42); construction sector (Sector F = 1.04); accommodation and food & drink sector (Sector I = 1.33); government administration, defense, and compulsory social security sectors (Sector O = 2.20); and the education services sector (Sector P = 1.40). Sector A was the base sector for 2011-2022, with the highest SLQ of 1.64 in 2020. Sector F became the base sector for 2015-2022, with the highest SLQ of 1.16 in 2022. Sector I was also the base sector throughout 2011-2022, with the highest SLQ of 1.42 in 2021. The O sector was the base sector of 2011-2019, with a high SLQ of 2.96 in 2014. At the same time, Sector P is the base sector in 2011-2022, where the highest SLQ reached 1.56 in 2022.
Based on the previous study [65], sectors A, I, O, and P have a significant comparative advantage (SLQ > 1.2). Sector F has a slight comparative advantage (1 < SLQ ≤ 1.2). The other 12 sectors have no comparative advantage (0 ≤ SLQ ≤ 1) over the same sector in the province. The analysis continued with the DLQ method to determine the sustainability of the comparative advantage of each sector. Sustainable comparative advantage is one of the criteria for compiling a sector classification. DLQ > 1 interprets that the sector has a sustainable comparative advantage over the next 5-10 years.
3.2.2 DLQ analysis
Sustainable comparative advantage (CA) was measured using DLQ analysis (Table 2). The sectors with a sustainable comparative advantage have good prospects for development in the next 5-10 years. Sectors that have a sustainable CA with DLQ > 1 are manufacturing, electricity and gas procurement, construction, transportation and warehousing, wholesale and retail trade, repair of cars and motorcycles, information and communication, financial and insurance services, and education services. Other sectors with DLQ < 1 are those whose unsustainable CA.
3.2.3 Shift-share analysis
Economic sector growth rate and competitiveness are determined based on SSA. Table 3 shows that all sectors have a positive SSE, which means that all sectors are growing faster than the same sector at the province. According to the SCE, only four sectors are strongly competitive: electricity and gas procurement; construction; wholesale and retail trade, car and motorcycle repair; and transportation and warehousing. Thus, only four sectors grow faster and are strongly competitive than the same sector at the provincial level. The four sectors are electricity and gas procurement, construction, large and retail trade, car and motorcycle repair, and transportation and warehousing.
Figure 2. Average SLQ of economic sectors in 2011-2022
Table 2. DLQ of Toba District economic sectors in 2011-2022
|
No. |
Sector |
GSD |
GSP |
IPPSd |
IPPSp |
(IPPSd/IPPSp) |
DLQ |
CA |
|
1 |
A |
2.85 |
4.33 |
0.76 |
1.05 |
0.72 |
0.02 |
unsustainable |
|
2 |
B |
3.29 |
4.74 |
0.85 |
1.14 |
0.75 |
0.03 |
unsustainable |
|
3 |
C |
2.37 |
2.28 |
0.67 |
0.65 |
1.02 |
1.33 |
sustainable |
|
4 |
D |
5.17 |
3.75 |
1.22 |
0.94 |
1.30 |
22.28 |
sustainable |
|
5 |
E |
3.07 |
4.35 |
0.80 |
1.06 |
0.76 |
0.04 |
unsustainable |
|
6 |
F |
4.94 |
3.51 |
1.17 |
0.89 |
1.31 |
26.59 |
sustainable |
|
7 |
G |
4.72 |
4.42 |
1.13 |
1.07 |
1.05 |
1.86 |
sustainable |
|
8 |
H |
4.00 |
2.65 |
0.99 |
0.72 |
1.37 |
42.33 |
sustainable |
|
9 |
I |
3.03 |
3.16 |
0.79 |
0.82 |
0.97 |
0.67 |
unsustainable |
|
10 |
J |
7.58 |
7.46 |
1.69 |
1.67 |
1.01 |
1.14 |
sustainable |
|
11 |
K |
5.01 |
3.95 |
1.19 |
0.98 |
1.21 |
9.99 |
sustainable |
|
12 |
L |
4.03 |
4.55 |
0.99 |
1.10 |
0.90 |
0.29 |
unsustainable |
|
13 |
M,N |
3.61 |
3.89 |
0.91 |
0.97 |
0.94 |
0.48 |
unsustainable |
|
14 |
O |
2.22 |
2.69 |
0.63 |
0.73 |
0.87 |
0.19 |
unsustainable |
|
15 |
P |
5.07 |
4.47 |
1.20 |
1.08 |
1.11 |
3.36 |
unsustainable |
|
16 |
Q |
4.20 |
4.24 |
1.03 |
1.04 |
0.99 |
0.88 |
unsustainable |
|
17 |
R,S,T,U |
3.65 |
4.51 |
0.92 |
1.09 |
0.84 |
0.13 |
unsustainable |
Notes: 1. GSD=sector growth in districts, 2. GSP=sector growth in provinces, 3. IPPSd=index of sector development potential in districts,
4. IPPSp=index of sector development potential in provinces, 5. DLQ=dynamic location quotient, 6. CA=comparative advantage
Table 3. SSA of the economic sectors (2011-2022)
|
No. |
Sector |
DGE |
SSE |
SCE |
Total |
|
1 |
A |
2170.86 |
2806.91 |
-451.93 |
4525.84 |
|
2 |
B |
19.23 |
35.79 |
-12.10 |
42.92 |
|
3 |
C |
806.01 |
1036.18 |
-186.84 |
1655.35 |
|
4 |
D |
4.40 |
2.86 |
0.94 |
8.21 |
|
5 |
E |
3.24 |
4.92 |
-1.57 |
6.59 |
|
6 |
F |
653.76 |
1199.57 |
31.45 |
1884.78 |
|
7 |
G |
912.86 |
1662.13 |
2.50 |
2577.49 |
|
8 |
H |
162.51 |
261.80 |
1.17 |
425.48 |
|
9 |
I |
171.97 |
253.03 |
-51.31 |
373.69 |
|
10 |
J |
65.86 |
114.75 |
-8.27 |
172.34 |
|
11 |
K |
87.05 |
133.46 |
-3.89 |
216.63 |
|
12 |
L |
163.05 |
334.27 |
-70.70 |
426.62 |
|
13 |
M,N |
48.64 |
105.38 |
-17.86 |
136.16 |
|
14 |
O |
586.00 |
778.27 |
-111.21 |
1253.06 |
|
15 |
P |
149.39 |
195.16 |
-2.59 |
341.95 |
|
16 |
Q |
46.54 |
91.66 |
-13.16 |
125.05 |
|
17 |
R,S,T,U |
8.80 |
17.49 |
-3.99 |
22.31 |
3.3 Classifying and identifying economic sectors
The classification of economic sectors in the Toba District is determined based on a combination of DLQ (sustainable or unsustainable comparative advantage and SSA, namely the growth and competitiveness of the sector (Table 4).
DLQ is a measure of comparative advantage that is sustainable (DLQ>1) or unsustainable (DLQ <1). SSA mainly determines two components. The first component is a faster growth rate (SSE positive) or slower growth (SSE negative). The second component is higher competitiveness (SCE positive) or less competitiveness (SCE negative). Mainstay and leading sectors are the priority in regional development, while potential sectors are the next priority. The combination of DLQ, growth, and competitiveness of economic sectors determines the sector classification in Table 5.
Table 4. Determine the classification of the economic sectors (2011-2022)
|
No. |
Sector |
DLQ |
SSA |
Interpretation |
Classification |
|||
|
Growth |
Competitive |
CA |
Growth |
Competitive |
||||
|
1 |
A |
0.02 |
2,806.91 |
-451.93 |
unsustainable |
faster |
weakly |
potential sector |
|
2 |
B |
0.03 |
35.79 |
-12.10 |
unsustainable |
faster |
weakly |
potential sector |
|
3 |
C |
1.33 |
1,036.18 |
-186.84 |
sustainable |
faster |
weakly |
leading sector |
|
4 |
D |
22.28 |
2.86 |
0.94 |
sustainable |
faster |
strongly |
mainstay sector |
|
5 |
E |
0.04 |
4.92 |
-1.57 |
unsustainable |
faster |
weakly |
potential sector |
|
6 |
F |
26.59 |
1,199.57 |
31.45 |
sustainable |
faster |
strongly |
mainstay sector |
|
7 |
G |
1.86 |
1,662.13 |
2.50 |
sustainable |
faster |
strongly |
mainstay sector |
|
8 |
H |
42.33 |
261.80 |
1.17 |
sustainable |
faster |
strongly |
mainstay sector |
|
9 |
I |
0.67 |
253.03 |
-51.31 |
unsustainable |
faster |
weakly |
potential sector |
|
10 |
J |
1.14 |
114.75 |
-8.27 |
sustainable |
faster |
weakly |
leading sector |
|
11 |
K |
9.99 |
133.46 |
-3.89 |
sustainable |
faster |
weakly |
leading sector |
|
12 |
L |
0.29 |
334.27 |
-70.70 |
unsustainable |
faster |
weakly |
potential sector |
|
13 |
M,N |
0.48 |
105.38 |
-17.86 |
unsustainable |
faster |
weakly |
potential sector |
|
14 |
O |
0.19 |
778.27 |
-111.21 |
unsustainable |
faster |
weakly |
potential sector |
|
15 |
P |
3.36 |
195.16 |
-2.59 |
sustainable |
faster |
weakly |
leading sector |
|
16 |
Q |
0.88 |
91.66 |
-13.16 |
unsustainable |
faster |
weakly |
potential sector |
|
17 |
R,S,T,U |
0.13 |
17.49 |
-3.99 |
unsustainable |
faster |
weakly |
potential sector |
Table 5. Classification and identification of economic sectors
|
Mainstay Sectors (sustainable CA, grows faster, strongly competitive): Electricity and gas procurement Construction Wholesale and retail trade, car, and motorcycle repair Transportation and warehousing |
Potential Sectors (sustainable/unsustainable CA, grows faster/slower, weakly competitive): Agriculture, forestry, and fisheries Mining and quarrying Water procurement, waste management, waste and recycling Provision of accommodation and food & drink Real estate Corporate services Government administration, defense, and compulsory social security Health services and social activities Other services |
|
Leading Sectors (sustainable CA, grows faster, weakly competitive): Education services Manufacturing Information dan communication Financial service and insurance |
The sector classification consists of mainstay, leading, and potential sectors. There are four mainstay sectors: electricity and gas procurement, construction, wholesale and retail trade, car and motorcycle repair, and transportation and warehousing. The leading sectors are manufacturing, information and communication, financial services and insurance, and education services. The potential sector consists of agriculture, forestry, and fisheries; mining and quarrying; water procurement, waste management, waste, and recycling; provision of accommodation, food, and drink; real estate; corporate services; government administration; defense, and compulsory social security; health services and social activities; and other services.
The leading sector has a sustainable comparative advantage and is fast-growing but must be more competitive. The leading sectors are educational services, manufacturing, information and communication, and financial and insurance services. These leading sectors are expected to become mainstay sectors in the future with a strategy to increase competitiveness. Several leading educational institutions support the education sector as a leading sector. Some of them are DEL Institute of Technology, Bibelvrow College, Deaconess College, Nursing Academy (owned by HKBP church), Bintang Timur Junior High School, Tunas Bangsa Soposurung Foundation, SMA Negeri 2 Balige, and SMA Unggul Del.
3.4 Sector classification and current priorities
The sector classification of the results of this study was compared with the current Toba District development planning document (Table 6). Based on the Regional Medium-term Development Plan (RMDP) of Toba District for 2016-2021, development priorities are health, education, agriculture and the environment, infrastructure, electricity power, and tourism.
The study's main findings suggest that mainstay sectors are suitable as development priorities, namely electric and gas procurement, construction, wholesale and retail trade and car and motorcycle repair, and transportation and warehousing. If the district budget is adequate, then the leading sectors can become development priorities in the second order, consisting of education services, manufacturing, information and communication, and financial and insurance services.
Table 6. The comparison of the sector priorities
|
Priorities Sectors Based on the Study |
Priorities in the Current Planning |
|
Electric and gas procurement Construction Wholesale and retail trade and car and motorcycle repair Transportation and warehousing Education services Manufacturing Information and communication Financial and insurance services |
Health Education Agriculture and the environment Infrastructure and electricity power Tourism |
The construction sector is the mainstay sector, and education services are the leading sector in the Toba District. The mainstay and leading sectors are suitable as regional development priorities in the 2016-2021 RMDP of the Toba District. In contrast, determining sectors related to health and agriculture, forestry, and fisheries is less suitable as a priority in the planning documents. The 2016-2021 planning document shows that infrastructure provision receives considerable annual financing. Adequate infrastructure can attract investors and play a positive role in the economy of Toba District.
3.5 Improve regional development priorities
The mainstay sectors are suitable as regional development priorities. Leading sectors can be the second priority. Potential sectors are not suitable as priorities for regional development. The determination of priority sectors in the current regional development planning is different from the results of the study, except for infrastructure and electricity. The agriculture and health sectors, based on the results of this study, are not suitable as priority sectors of the first group. The education sector is a priority sector in the second group. Therefore, the recommended regional development priorities in the next regional planning are electricity and gas procurement, construction, wholesale and retail trade, car and motorcycle repair, transportation and warehousing, education services, manufacturing, information and communication, and financial service and insurance.
The mainstay sector is a sector that has sustainable comparative advantages is fast-growing and is competitive. The construction sector, for example, is a sector that provides basic infrastructure, especially road infrastructure. Infrastructure development will encourage increased activity in other sectors. The development of transportation infrastructure has an impact on economic development. In addition, infrastructure investment policy must be linked to regional development strategies [66]. With this in mind, economic infrastructure investment and social infrastructure spending significantly reduce poverty rates. Increased infrastructure investment can be key to enhancing the effects of poverty reduction [67]. The availability of transportation and infrastructure is the most sensitive attribute of the sustainability of the agro-ecotourism community [64]. Transportation infrastructure improvements can support sustainable rural tourism [68], promote an effect on economic development in the long run [69], and reduce poverty [67].
The leading sectors are expected to become a mainstay with increased competitiveness in the next five or ten years. Transportation infrastructure investment impacts competitiveness and economic growth, as reflected in labor productivity, employment, and gross regional product [70]. Intensive R&D clusters are key to regional competitiveness and impact productivity growth. Cluster-based regional development strategies are policies that can encourage regional growth [71]. The improvement of regional competitiveness is determined by citizens' satisfaction with government products and services, the effectiveness of strategic planning focused on socioeconomic development, legal compliance, and ethics of organizational actors [72]. Competitiveness is determined by the conditions of factors of production, local demand, the availability of supporting industries, and the strategy and type of competition [73].
Increasing competitiveness can be achieved through strategies for the specialization of target markets and new market segmentation [48], strengthening the capacity of local communities and re-engineering production systems [16], increasing innovation capabilities [23], development of new knowledge and technology [24], product downstream [25], promotion strategies [26], public policy orientation [28], quality of life, environmental control, and the interaction of villages and cities as marketing centers [29].
Nevertheless, the logical question that arises is why local governments include agriculture, health, and tourism sectors as priorities in the RMDP 2016-2021. Here, it is important to discuss alternative explanations for research findings. The logical argument that can be given is that such sectors should be developed, although not as development priorities. These sectors are agriculture, forestry, and fisheries; water supply, waste management, waste, and recycling; accommodation and food and drink; and health services and social activities. The agriculture, forestry, and fisheries sectors are responsible for the highest contribution to the GRDP of the Toba District (31.24% in 2022).
Investment in the agricultural sector has a positive and significant impact on the growth of the agriculture sector [62]. The government, through investments, facilitates a conducive environment for the growth of the agricultural sector. The facilitation includes strengthening infrastructure, such as road transportation, agro-industrial, and warehousing facilities. This strategy can increase employment opportunities and reduce poverty [74]. Agricultural investments need to be analyzed based on crop type, job creation, implementation status, and investor type. This analysis is important as a basis for decision-makers to increase employment [75].
Water supply, waste management, waste and recycling sector, and providing accommodation and food and drink are strategic sectors supporting Lake Toba’s super-priority tourism destinations. Tourism is a multidimensional sector with rational use of human resources. The tourism sector contributes to the improvement of the population's standard of living in economic sectors-both directly and indirectly-as well as increasing employment opportunities [76]. Meanwhile, the health service and social sector are a priority because they are priority sectors at the national level.
An alternative explanation is that the analysis of comparative advantage, growth, and competitiveness of sectors is one of many determinants of regional development priorities. Some other determinants are the policies and priorities of the central government, the development of the Lake Toba tourism area, and perhaps even local political forces intervening in development planning. The limitation of the study is that these other determinants should have been included in the analysis. Consequently, recommendations for regional development priorities based on mainstay and flagship sectors can be biased. The mainstay and superior sectors are not all used as regional development priorities.
The economic sector of Toba District is classified into mainstay, leading, and potential sectors. The mainstay sector consists of electricity and gas procurement, construction, large trade and retail, car and motorcycle repair, and transportation and warehousing). The leading sectors are the manufacturing industry, information and communication, financial and insurance services, and education services. The potential sectors include nine sectors, namely agriculture, forestry, and fisheries; mining and quarrying; water procurement, waste management, waste, and recycling; provision of accommodation and food drink; real estate; corporate services; government administration; defense, and compulsory social security; health services and social activities; and other services. Based on the study, the mainstay sectors are suitable as regional development priorities. Leading sectors can be the second priority. Potential sectors are not suitable as priorities for regional development.
The determination of priority sectors in the current regional development planning is different from the results of the study, except for infrastructure and electricity. The agriculture and health sectors, based on the results of this study, are not suitable as priority sectors of the first group. The education sector is a priority sector in the second group. Therefore, the recommended regional development priorities in the next regional planning are electricity and gas procurement, construction, wholesale and retail trade, car and motorcycle repair, transportation and warehousing, education services, manufacturing, information and communication, and financial service and insurance.
The study has limitations because it only uses secondary data as a basis for analysis and conclusions. In addition, the analysis method used only compares districts with provinces, not between districts. Therefore, future research is directed to a more comprehensive analysis to determine the development priorities of the region, including the potential of the region, the needs of the community, and sustainable tourism development. More advanced analytical methods are also suggested to be able to compare the comparative and competitive advantages of sectors between districts in the province.
We appreciate the meaningful information and discussion from Mr. Edy Frans Silalahi regarding the economic field conditions of Toba District, and we thank Mr. Jhonson A. Marbun for corrections and suggestions on the results of shift-share analysis data processing.
[1] Manuilova, K., Motornyy, V., Koval, O., Mykytyn, O., Norchuk, Y. (2023). Economic security management for sustainable planning. International Journal of Sustainable Development and Planning, 18(7): 2055-2060. https://doi.org/10.18280/ijsdp.180707
[2] Scotti, F., Flori, A., Pammolli, F. (2022). The economic impact of structural and cohesion funds across sectors: Immediate, medium-to-long term effects and spillovers. Economic Modelling, 111: 105833. https://doi.org/10.1016/j.econmod.2022.105833
[3] Deng, X., Wang, Y., Song, M. (2023). Development geography for exploring solutions to promote regional development. Geography and Sustainability, 4(1): 49-57. https://doi.org/10.1016/j.geosus.2022.12.003
[4] Zuo, Q., Zhou, Y., Wang, L., Li, Q., Liu, J. (2022). Impacts of future land use changes on land use conflicts based on multiple scenarios in the central mountain region, China. Ecological Indicators, 137: 108743. https://doi.org/10.1016/j.ecolind.2022.108743
[5] Roman, M., Fellnhofer, K. (2022). Facilitating the participation of civil society in regional planning: Implementing quadruple helix model in Finnish regions. Land Use Policy, 112: 105864. https://doi.org/10.1016/j.landusepol.2021.105864
[6] Brodny, J., Tutak, M. (2022). Assessing the level of innovation in Poland from the perspective of regions between 2010 and 2020. Journal of Open Innovation: Technology, Market, and Complexity, 8(4): 190. https://doi.org/10.3390/joitmc8040190
[7] Ma, S. (2022). Growth effects of economic integration: New evidence from the Belt and Road Initiative. Economic Analysis and Policy, 73: 753-767. https://doi.org/10.1016/j.eap.2022.01.004
[8] Zhong, S., Wang, M., Zhu, Y., Chen, Z., Huang, X. (2022). Urban expansion and the urban–rural income gap: Empirical evidence from China. Cities, 129: 103831. https://doi.org/10.1016/j.cities.2022.103831
[9] Ejigu, M.E., Desalegn, T.A. (2023). How does strategic planning influence the performance of financial institutions? An empirical study of Ethiopia. Management Review, 35(1): 26-39. https://doi.org/10.1016/j.iimb.2023.03.003
[10] Acharya, R.N., Perez-Pena, R. (2020). Role of comparative advantage in biofuel policy adoption in Latin America. Sustainability (Switzerland), 12(4): 1411. https://doi.org/10.3390/su12041411
[11] Lin, J.Y., Yang, Z., Li, Y., Zhang, Y. (2022). Development strategy and the MSMEs finance gap. Journal of Government and Economics, 5: 100034. https://doi.org/10.1016/j.jge.2022.100034
[12] Liu, Z., Xie, A. (2022). Poverty reduction effects of integrating high-quality development and cultural tourism in China. Chinese Journal of Population Resources and Environment, 20(4): 383-391. https://doi.org/10.1016/j.cjpre.2022.11.008
[13] Simola, A., Boysen, O., Ferrari, E., Nechifor, V., Boulanger, P. (2022). Economic integration and food security-The case of the AfCFTA. Global Food Security, 35: 100651. https://doi.org/10.1016/j.gfs.2022.100651
[14] Chen, Y., Gao, Y. (2022). Comparative analysis of digital trade development strategies and governance approaches. Journal of Digital Economy, 1(3): 227-238. https://doi.org/10.1016/j.jdec.2023.02.001
[15] Yu, L., Xu, W. (2022). Institutional conformity, entrepreneurial governance and local contingency: Problematizing central-local dynamics in localizing China’s low-income housing policy. Environment and Planning A, 54(3): 508-532. https://doi.org/10.1177/0308518X211061400
[16] Zhou, Z., Chen, T., Li, L., Wang, X., Feng, X., Lu, J. (2022). Projected losses of ecosystem services incurred by reserve resources of cultivated land development and development priority: A case study of Linzhou City in Henan Province, China. International Journal of Environmental Research and Public Health, 19(11): 6627. https://doi.org/10.3390/ijerph19116627
[17] Oryzanti, P., Rustiadi, E., Eriyatno, Rochman, N.T. (2018). Policy priorities for the economic development in agropolitan area of Karacak based-on mangosteen agroindustry. American Journal of Applied Sciences, 15(11): 489-496. https://doi.org/10.3844/ajassp.2018.489.496
[18] Sridhara, S., Gopakkali, P., Manoj, K.N., Patil, K.K.R., Paramesh, V., Jha, P.K., Vara Prasad, P.V. (2022). Identification of sustainable development priorities for agriculture through sustainable livelihood security indicators for Karnataka, India. Sustainability (Switzerland), 14(3): 1831. https://doi.org/10.3390/su14031831
[19] Flores-Tapia, C.E., Pérez-González, M. del C., Maza-Ávila, F.J., Flores-Cevallos, K.L. (2023). Public policy guidelines for a comprehensive, territorial and sustainable development to improve productivity and competitiveness. Case Tungurahua Province-Ecuador. Heliyon, 9(5). https://doi.org/10.1016/j.heliyon.2023.e15426
[20] Bergin, P.R. (2022). Currency undervaluation and comparative advantage. European Economic Review, 150: 104316. https://doi.org/10.1016/j.euroecorev.2022.104316
[21] Tossou, B.W., Chogou, S.K., Sossou, C.H. (2023). Analysis of the competitiveness of soybean production in Benin. Scientific African, 19: e01491. https://doi.org/10.1016/j.sciaf.2022.e01491
[22] González-Rodríguez, M.R., Díaz-Fernández, M.C., Pulido-Pavón, N. (2023). Tourist destination competitiveness: An international approach through the travel and tourism competitiveness index. Tourism Management Perspectives, 47: 101127. https://doi.org/10.1016/j.tmp.2023.101127
[23] Tang, Q., Xie, E., Reddy, K.S. (2022). Global production aspirations and internationalization by state-owned enterprises: A Co-evolutionary view of state-driven industrialized economy. International Journal of Innovation Studies, 6(4): 276-285. https://doi.org/10.1016/j.ijis.2022.08.003
[24] Lee, C., Shin, H., Kim, K., Kogler, D.F. (2022). The effects of regional capacity in knowledge recombination on production efficiency. Technological Forecasting and Social Change, 180: 121669. https://doi.org/10.1016/j.techfore.2022.121669
[25] Othman, N., Tahir, M.S., Joremi, L. (2022). On the duration of trade competitiveness: The case of the Malaysian palm-based oleochemical industry. Heliyon, 8(11): e11903. https://doi.org/10.1016/j.heliyon.2022.e11903
[26] Heriqbaldi, U., Esquivias, M.A., Samudro, B.R., Widodo, W. (2023). Do national export promotion programs in Indonesia support export competitiveness? Heliyon, 9(6): e16918. https://doi.org/10.1016/j.heliyon.2023.e16918
[27] Mastika, I.K., Harsono, S.S., Khristianto, W., Oktawirani, P., Hutama, P.S. (2023). Creative strategies of local resources in managing geotourism in the Ijen Geopark Bondowoso, East Java, Indonesia. International Journal of Geoheritage and Parks, 11(1): 149-168. https://doi.org/10.1016/j.ijgeop.2023.01.002
[28] Fundeanu, D.D. (2015). Innovative regional cluster model of tourism development. Procedia Economics and Finance, 23: 744-749. https://doi.org/10.1016/s2212-5671(15)00501-8
[29] Surya, B., Saleh, H., Hamsina, H., Idris, M., Ahmad, D.N.A. (2021). Rural agribusiness-based agropolitan area development and environmental management sustainability: Regional economic growth perspectives. International Journal of Energy Economics and Policy, 11(1): 142-157. https://doi.org/10.32479/ijeep.10184
[30] Biukšāne, I. (2016). Model of the factors influencing competitiveness of the Latvian fisheries sector cluster. Economics and Business, 28(1): 76-82. https://doi.org/10.1515/eb-2016-0011
[31] Juda, M., Kudo, T. (2020). The spillover effects of FDI on labor productivity of firms: Evidence from the five priority manufacturing industries in Indonesia. Jurnal Ekonomi dan Pembangunan, 28(1): 1-16. https://doi.org/10.14203/jep.28.1.2020.1-16
[32] Suryaningrum, I.D., Mulyanto, Soesilo, A.M. (2022). Analysis of regional economic potential of Barlingmascakeb regional institution member districts. (Case study Banjarnegara, Purbalingga, Banyumas, Cilacap and Kebumen Regencies). International Journal of Economics, Business and Management Research, 6(7): 125-141. https://doi.org/10.51505/ijebmr.2022.6709
[33] Miszczak, K. (2021). The importance of the economic base theory in urban and regional research. Biblioteka Regionalisty, 21: 92-110. https://doi.org/10.15611/br.2021.1.08
[34] Lufin, M., Soto-Díaz, J. (2022). Technology, geography, and diversification in a small mineral economy. Extractive Industries and Society, 11: 101080. https://doi.org/10.1016/j.exis.2022.101080
[35] Ghosh, D.D., Sarkar, A., Chouhan, D.P. (2021). COVID-19 second wave: District level study of concentration of confirmed cases and fatality in India. Environmental Challenges, 5: 100221. https://doi.org/10.1016/j.envc.2021.100221
[36] Hizbaron, D.R., Muthohar, I., Malkhamah, S. (2022). Risk-based interurban Makassar-Parepare railway development, Indonesia. Transportation Research Interdisciplinary Perspectives, 13: 100541. https://doi.org/10.1016/j.trip.2022.100541
[37] Kim, M.K., Seo, J., Kim, N.Y., Chung, J.B. (2023). Emerging industrial clusters of disaster safety industry in Korea. Heliyon, 9(7): e17939. https://doi.org/10.1016/j.heliyon.2023.e17939
[38] Pominova, M., Gabe, T., Crawley, A. (2022). The stability of location quotients. Review of Regional Studies, 52(3): 296-320. https://doi.org/10.52324/001c.66197
[39] Anshar, M., Siradjuddin, I., Rezki, M., Kusmiran, A. (2022). Land suitability and potential agriculture analysis to regional development based on agro-tourism. Jurnal Pembangunan Wilayah dan Kota, 18(2): 112-127. https://doi.org/10.14710/pwk.v18i2.37531
[40] Selting, A., Loveridge, S. (1992). A summary of the literature on shift-share analysis. University of Minnesota: Staff Papers, 14086. http://dx.doi.org/10.22004/ag.econ.14086
[41] Lahr, M.L., Ferreira, J.P. (2020). Handbook of regional science. Springer Berlin, Heidelberg https://doi.org/10.1007/978-3-642-36203-3
[42] Mo, S.W., Lee, K.B., Lee, Y.J., Park, H.G. (2020). Analysis of import changes through shift-share, location quotient and BCG techniques: Gwangyang Port in Asia. Asian Journal of Shipping and Logistics, 36(3): 145-156. https://doi.org/10.1016/j.ajsl.2020.01.001
[43] Kang, H., Zoh, H.D. (2022). Classifying regional and industrial characteristics of GHG emissions in South Korea. Energies, 15(20): 7777. https://doi.org/10.3390/en15207777
[44] Rota, F.S., Bagliani, M., Feletig, P. (2020). Breaking the black-box of regional resilience: A taxonomy using a dynamic cumulative shift-share occupational approach. Sustainability (Switzerland), 12(21): 9070. https://doi.org/10.3390/su12219070
[45] Sheng, R., Du, J., Liu, S., Wang, C., Wang, Z., Liu, X. (2021). Solar photovoltaic investment changes across China regions using a spatial shift-share analysis. Energies, 14(19): 6418. https://doi.org/10.3390/en14196418
[46] Pérez-González, M.D.C., Valiente-Palma, L. (2021). Cooperative societies and sustainability: A spatial analysis of Andalusia as a tool for implementing territorial development policies, strategies and initiatives. Sustainability (Switzerland), 13(2): 609. https://doi.org/10.3390/su13020609
[47] Nuryasman, M.N., Nuringsih, K., Cokki. (2020). Shift-share analysis of tourism industry growth in Kulon Progo Yogyakarta. Industrial Engineering and Management Systems, 19(3): 610-621. https://doi.org/10.7232/iems.2020.19.3.610
[48] Fernando, I.N. (2020). Tourism competitiveness by shift-share analysis to way-forward destination management: A case study for Sri Lanka. Journal of Tourism and Services, 11(21): 88-102. https://doi.org/10.29036/jots.v11i21.139
[49] Lv, D., Gao, H., Zhang, Y. (2021). Rural economic development based on shift-share analysis in a developing country: A case study in Heilongjiang Province, China. Sustainability (Switzerland), 13(4): 1969. https://doi.org/10.3390/su13041969
[50] Kurek, K.A., Heijman, W., van Ophem, J., Gędek, S., Strojny, J. (2021). The contribution of the geothermal resources to local employment: Case study from Poland. Energy Reports, 7: 1190-1202. https://doi.org/10.1016/j.egyr.2021.01.092
[51] Song, J., Preston, J. (2020). A generic understanding of the economic changes of major port regions with shift-share analysis applied, South Korea. Maritime Supply Chains, pp. 95-114. https://doi.org/10.1016/B978-0-12-818421-9.00006-9
[52] Xanthos, G., Zopounidis, C., Garefalakis, A., Lemonakis, C., Passas, I. (2022). Distinguish regional performance with the use of shift-share analysis and MCDA methods: A gross value added perspective. Operational Research, 22(2): 1363-1376. https://doi.org/10.1007/s12351-020-00582-6
[53] Sheng, R., Zhou, R., Zhang, Y., Wang, Z. (2021). Green investment changes in China: A shift-share analysis. International Journal of Environmental Research and Public Health, 18(12): 6658. https://doi.org/10.3390/ijerph18126658
[54] Blanco, M., Ferasso, M., Bares, L. (2021). Evaluation of the effects on regional production and employment in Spain of the renewable energy plan 2011-2020. Sustainability (Switzerland), 13(6): 3587. https://doi.org/10.3390/su13063587
[55] Gusrizal, G. (2022). Analisis sektor ekonomi unggulan di kabupaten kepulauan seribu. Bappenas Working Papers, 5(3): 373-393. https://doi.org/10.47266/bwp.v5i3.183
[56] Marwoto, P.B., Arkum, D., Ilahi, R. (2022). Structural change: Applying location quotient and shift-share analysis in determining leading sectors in bangka regency over the 2000-2021 period. In International Conference on Sustainable Environment, Agriculture and Tourism (ICOSEAT 2022). Atlantis Press, pp. 990-995. https://doi.org/10.2991/978-94-6463-086-2_130
[57] Situmorang, T., Sukiyono, K., Sriyoto, S. (2020). Economic leading sectors and competitiveness in South Tapanuli Regency. Journal of Agri Socio-Economics and Business, 2(1): 45-58. https://doi.org/10.31186/jaseb.2.1.45-58
[58] Wibisono, E., Amir, A., Zulfanetti, Z. (2019). Keunggulan komparatif dan kompetitif sektor industri pengolahan di provinsi jambi. Journal of Regional and Rural Development Planning (Jurnal Perencanaan Pembangunan Wilayah dan Perdesaan), 3(2): 105-116. https://doi.org/10.29244/jp2wd.2019.3.2.105-116
[59] Putra, A.H.P.K., Elpisah, E. (2021). Analysis of comparative advantages and shifts in economic sectors in Wajo Regency. Golden Ratio of Data in Summary, 1(2): 56-69. https://doi.org/10.52970/grdis.v1i2.270
[60] Tanjung, G.S., Suryantini, A., Utami, A.W. (2021). The priorities of leading sub-sector in the sector of agriculture, forestry, and fisheries in economic development in bangka belitung province. AGRARISris: Journal of Agribusiness and Rural Development Research, 7(2): 160-175. https://doi.org/10.18196/AGRARIS.V7I2.11615
[61] Saragih, J.R., Siburian, A., Harmain, U., Purba, T. (2021). Komoditas unggulan dan potensial sektor pertanian kabupaten simalungun, provinsi sumatera utara. Agro Bali: Agricultural Journal, 4(1): 51-62. https://doi.org/10.37637/ab.v0i0.633
[62] Harahap, A.H., Rahmanta, R., Lindawati, L. (2022). Analisis kemiskinan dan pertumbuhan sektor pertanian di Provinsi Sumatera Utara, Indonesia. Agro Bali: Agricultural Journal, 5(1): 76-83. https://doi.org/10.37637/ab.v5i1.870
[63] Adam, A.G., Agegnehu, A.W., Dessie, B.T., Minale, A.S. (2023). Responsible governance of land tenure in the context of agricultural investment from theory to Practice: Lessons from Ethiopia. Research in Globalization, 6: 100131. https://doi.org/10.1016/j.resglo.2023.100131
[64] Djuwendah, E., Karyani, T., Wulandari, E., Pradono, P. (2023). Community-based agro-ecotourism sustainability in West Java, Indonesia. Sustainability, 15(13): 10432. https://doi.org/10.3390/su151310432
[65] Nie, T., Li, N., Yan, F. (2022). Distortion and improvement method of location quotient in water consumption evaluation. Mathematical Problems in Engineering, 2022. https://doi.org/10.1155/2022/9600265
[66] Komornicki, T., Goliszek, S. (2023). New transport infrastructure and regional development of Central and Eastern Europe. Sustainability, 15(6): 5263. https://doi.org/10.3390/su15065263
[67] Fagbemi, F., Osinubi, T.T., Adeosun, O.A. (2022). Enhancing sustainable infrastructure development: A boon to poverty reduction in Nigeria. World Development Sustainability, 1: 100006. https://doi.org/10.1016/j.wds.2022.100006
[68] Ariyani, N., Fauzi, A. (2023). Pathways toward the transformation of sustainable rural tourism management in Central Java, Indonesia. Sustainability (Switzerland), 15(3): 2592. https://doi.org/10.3390/su15032592
[69] Zhang, Y., Cheng, L. (2023). The role of transport infrastructure in economic growth: Empirical evidence in the UK. Transport Policy, 133: 223-233. https://doi.org/10.1016/j.tranpol.2023.01.017
[70] Purwanto, A.J., Heyndrickx, C., Kiel, J., Betancor, O., Socorro, M.P., Hernandez, A., Eugenio-Martin, J.L., Pawlowska, B., Borkowski, P., Fiedler, R. (2017). Impact of transport infrastructure on international competitiveness of Europe. Transportation Research Procedia, 25: 2877-2888. https://doi.org/10.1016/j.trpro.2017.05.273
[71] Kosfeld, R., Mitze, T. (2023). Research and development intensive clusters and regional competitiveness. Growth and Change, 54(4): 885-911. https://doi.org/10.1111/grow.12676
[72] Rochmatullah, M.R., Probohudono, A.N., Rahmawati, R., Paramita, R.W.D., Badriyah, N. (2023). Local government competitiveness analysis using the perspective of organizational excellence: Evidence from Indonesia. Problems and Perspectives in Management, 21(2): 356-370. https://doi.org/10.21511/ppm.21(2).2023.35
[73] Gabrieli, A., Bitsch, V. (2023). Everywhere the same? Competitiveness of two regional vegetable production clusters in Southern Germany. International Food and Agribusiness Management Review, 26(1): 139-157. https://doi.org/10.22434/IFAMR2021.0119
[74] Huang, Z., Tan, M. (2023). Spatial differences of specialty agriculture development in the mountainous areas of China-“one village, one product” as an example. Heliyon, 9(8): e18391. https://doi.org/10.1016/j.heliyon.2023.e18391
[75] Yimam, H.M., Cochrane, L., Lemma, M.D. (2022). Not all crops are equal: The impacts of agricultural investment on job creation by crop type and investor type. Heliyon, 8(7): e09851. https://doi.org/10.1016/j.heliyon.2022.e09851
[76] Sylkin, O., Krupa, O., Borutska, Y., Todoshchuk, A., Zhurba, I. (2023). Exploring the impact of international tourism on regional sustainable development: A methodological approach for enhancing effectiveness. International Journal of Sustainable Development and Planning, 18(7): 2089-2096. https://doi.org/10.18280/ijsdp.180711