Evawani Elysa Lubis![]() | Yusni Ikhwan Siregar
| Yusni Ikhwan Siregar![]() | Nofrizal
| Nofrizal![]() | Noor Efni
| Noor Efni![]() | Fajriani Ananda*
| Fajriani Ananda*![]()
© 2024 The authors. This article is published by IIETA and is licensed under the CC BY 4.0 license (http://creativecommons.org/licenses/by/4.0/).
OPEN ACCESS
This research aims to analyze the perception of environmental awareness of the people of Kampung Baru, Kampung Bandar, Kampung Dalam, and Pesisir sub-districts, which is influenced by individual characteristics such as education and income. Then the perception of environmental awareness will influence the pro-environmental behavior of the people in these four sub-districts towards where they live. The area of these four sub-districts is the riverside city area of Pekanbaru City, which is starting to be organized into a tourist attraction known as Tepian Sungai Siak. The method used in this research was quantitative, distributing questionnaires to 120 respondents. The data was processed using SEM-PLS. From the results of research data processing, it is known that the respondents' characteristics, namely education and income, do not influence the respondents' environmental awareness perceptions. However, the respondents' perception of environmental awareness is classified as moderate or agrees with various management issues related to environmental concerns where they live, such as waste management, sanitation, clean water, energy, and concern for the surrounding environment. Furthermore, this environmentally conscious perception significantly influences the pro-environmental behavior of settlers on the banks of the Siak River. The results of this research can be used in designing government programs to create pro-environmental residential based on the pro-environmental behavior of settlers.
perception, environmental awareness, riverfront city, neighborhood planning, pro-environmental behaviour
Pekanbaru is one of the provincial capitals in Indonesia and is strategically located in the middle of the island of Sumatera. Pekanbaru City is heading towards becoming a metropolitan city with very rapid economic development and is accompanied by high population growth. In the 2020 population census, Pekanbaru's total population was 983,356 people. In the last ten years, from the 2010 population census until the previous census in 2020, the population increase in Pekanbaru reached 85,589 people, with an average annual increase of 8,558 people. The consequence of the higher population growth certainly requires a place to live or housing that is also increasing. One of the areas where city dwellers live is the riverside area. Pekanbaru City is a city divided by a river, the Siak River [1, 2].
In Pekanbaru City, the areas on the banks of the Siak River have become quite dense settlements filled with residents who inhabit the area. The Siak River, which used to have a strategic role in aquaculture, trade, economy, and transportation, has become a dumping ground for garbage, industrial, and household waste. This, of course, has resulted in pollution for the Siak River, disrupted the balance of the ecosystem and river habitat, and reduced its physical beauty, even though this river has great potential and has begun to be developed to become an attractive tourist destination [3] such as in Kampung Dalam and Kampung Bandar which is the riverfront city area of Pekanbaru City. Due to the primacy of economic factors above environmental considerations in residential activities, riverbank settlements have a variety of environmental issues as they develop, because environmental considerations are neglected and economic considerations are given priority during settlement.
A healthy settlement is certainly highly desired by every settler. Physical settlement arrangements have always been a concern for developers or the government to create healthy and comfortable housing [4]. However, it is also very important to be able to manage the behavior of settlers who live in a settlement in order to create an environmentally friendly settlement. It is important to know how settlers' perceptions are related to environmental awareness and environmentally friendly behavior [5].
Perception in a narrow sense is vision, how someone sees something, while in a broad sense, it is a view or understanding, namely how someone views or interprets something. Perception as a cognitive process experienced by everyone in understanding information about their environment, either through sight, hearing, appreciation, feeling or smell. Perceptions of environmental awareness include indicators of sanitation, water utilization, waste management and energy saving, behavior towards the surrounding environment. Perceptions are expressed in an index with three categories: high, medium and low [5].
Pro-environmentally behavior is an environmentally friendly action of generous individuals who show activities or behave to protect the environment, nature, and society by considering the costs and rewards of these actions. Usually, this environmentally friendly action arises because of motivation from within the individual rather than motivation from outside [6].
This study aims to analyze the perception of environmentally awareness settlers on the banks of the Siak River which is influenced by the characteristics of respondents with indicators of education and income [5]. Then analyze the influence of environmentally conscious perceptions on the environmentally friendly behavior of settlers living on the banks of the Siak River.
This study adopted the Pro-Environmental Behavior Index implemented by BPS [7], with coverage of environmentally conscious behavior indicators including sanitation behavior, water utilization behavior, waste management behavior, and energy, behavior towards the surrounding environment. Behavior is expressed in an index with three categories: high, medium, and low. To find the relationship between variables, namely socioeconomic characteristics, environmental perceptions, and environmentally conscious behavior of settlers, a Structural Equation Modeling-Partial Least Square (SEM-PLS) approach was used. This analytical tool can perform structural equation modeling with a relatively small sample size and does not require multivariate normal assumptions [5].
2.1 Research approach
This research approach is quantitative research. Quantitative research is a method in which a quantitative component is a large part of the program or research conducted or data processing performed by the researcher [8].
This research uses quantitative methods, namely explanatory surveys, to investigate the values of two or more correlated variables and test or determine the relationship that exists between them in a particular environment. To determine the perception environmental awareness index and pro-environmental behavior using frequency analysis, part least squares structural equation modeling (PLS-SEM) analysis is used to determine the relationship between variables. Data collection techniques were carried out by distributing questionnaires, interviews, and observations to obtain primary data. Secondary data was obtained from other parties by examining documents from various government agencies and relevant previous studies.
The measurement of the perception index and environmental awareness behavior used a population of households in four villages on the banks of the Siak River. The sampling method uses accidental sampling technique, where all elements in the defined population have an equal, free, and balanced opportunity to be selected as a sample.
2.2 Research time and location
This research was conducted from January to August 2023 in the riverfront city area of Pekanbaru City. Some 4 urban Sub-districts were nominated, namely Kampung Baru, Kampung Bandar, Kampung Dalam, which are in the Senapelan District area, then Pesisir Sub-District which is in the Lima Puluh District area, Pekanbaru City. These four urban Sub-Districts are directly adjacent to the Siak River and have dense settlements along the riverbanks (Figure 1).
Figure 1. Research location
In the research area on the map (shaded in purple), researchers set a distance of 100 m from the riverbank towards the mainland. This is with the consideration that it is either directly or indirectly connected to the existence of the Siak River. In this study, the area that became the riverfront city area in four urban Sub-Districts consisted of several RW or Rukun Warga. Pesisir urban Sub-District has the largest number of neighborhoods located on the banks of the Siak River, consisting of 5 RW. Meanwhile, Kampung Dalam Sub-District has the least number of neighborhoods, consisting of 2 neighborhoods in the riverfront city area. This is directly proportional to the size of each Sub-District, with Sub-District Pesisir having the most significant area.
2.3 Data collection method
This study used questionnaires to respondents (120 respondents) who live on the banks of the Siak River in this research area. Masing-masing kelurahan diambil responden sebanyak 30 orang sesuai dengan kebutuahn dalam penelitian ini [9]. The questionnaire is a quantitative research instrument consisting of closed-ended questions that contain predetermined answer choices, scales, and categories. In this study, the questionnaire was used to obtain information about the characteristics of respondents who were settlers on the banks of the Siak River. Then, information about respondents' perceptions of environmental awareness/friendliness and their pro-environmentals behavior.
2.4 Data analysis method
The data analysis technique is a way of mapping, parsing, calculating, and reviewing the data collected from the research results so that the problem formulation can be answered and conclusions from the research results. Quantitative data analysis is an analysis used to test the relationship between variables in research using calculations or statistical tests of data derived from questionnaire answers and primary data. To do the test, it is assisted by using the SEM PLS application.
This research has been conducted with due regard to ethical considerations approved by the Dean of the Faculty of Social and Political Sciences, Riau University.
3.1 Geographical conditions
This research was conducted in the riverfront city area in Pekanbaru City, precisely in four urban Sub-Districts that are directly adjacent to the Siak River. The four urban Sub-Districts are Sub-District Pesisir, which is part of District Lima Puluh; Sub-District Kampung Dalam, Kampung Bandar, and Kampung Baru, which is part of District Senapelan, Pekanbaru City. The researcher decided to conduct the research in these four urban Sub-Districts because the population is quite large and the settlements are dense.
The geographical location of the four Sub-District that make up this research area. Kampung Baru is located at 101°25" - 101°26" East Longitude and 0°32" North Latitude with a total area of + 87.1 Ha. Kampung Bandar is located at 101°26" East Longitude and 0°32" North Latitude, and its total area is + 43.3 Ha. Kampung Dalam is located at 101°26" East longitude and 0°32" North latitude, and its area is + 23.8 Ha. Pesisir is located at 101°26" - 101°27" East longitude and 0°32" North latitude, and its area is + 80.5 Ha [10].
The elevation of these four neighborhoods from sea level. Based on the height of the area above sea level, it is known that the Kampung Bandar area is the highest area among the four kampongs, with an altitude of 16m. Meanwhile, Sub-District Pesisir is the lowest area, with an altitude of 4 m above sea level. The location of the area that is the focus of this research can be seen in Figure 1, the position of Sub-District Pesisir, Kampung Dalam, Kampung Bandar, and Kampung Baru, which are directly adjacent to the Siak River.
3.2 Demographic data
The demographic data presented in this section is based on secondary data obtained from study [10] namely the number of residents based on gender, religion, education, occupation, and ethnicity. The largest population is in Sub-District Pesisir, with 6,862 people, followed by Sub-District Kampung Baru, with 6,460 people. The population is dominated by women in the three Sub-District: Pesisir, Kampung Dalam, and Kampung Baru. Islam is the dominant religion in the four Sub-Districts in the study area with 15,573 people, followed by Catholicism and Protestantism, Budha, Hinduism, and Confucianism.
Furthermore, the number of residents based on occupation is known that working as a trader is dominated by settlers in this research area with a total of 44.5%. Then the number of students and college students is ranked second with a total of 2,457 (12.8%). Meanwhile, people who work in the health sector, such as doctors, midwives, nurses, or pharmacists, make up the smallest proportion of the total population in the four Sub-Districts, at 0.3%. Then next, the number of residents based on ethnicity in the four Sub-Districts the Minang ethnic group is the most dominant ethnic group (55%), followed by the Malay ethnic group (37%), the original ethnic group living along the Siak River. The other 8% consists of Batak, Javanese, and Chinese ethnic groups.
3.3 Perception of residents on environmental awareness
Based on interviews with people living around the river and included in the riverfront city program, perceptions of them on environmental awareness (waste treatments, sanitation concept, water use, energy use, and the surrounding environment) were obtained. More details can be seen in Table 1.
Based on Table 1, community perceptions of waste management range from 2.29 to 2.34, which is classified as moderate. Community perception of sanitation of 2.34 is classified as medium. Public perception of clean water is 2.09-2.93, classified as medium and high. Community perceptions of energy ranged from 2.05-3.13, classified as medium and high. Perceptions of the surrounding environment of 2.47-2.81 are classified as medium. In general, community perceptions for all parameters of 2.78 are in the medium category, where people agree and positively perceive waste management, sanitation, water, energy, and the surrounding environment.
Pro-environmentally behavior of Residents in the Riverfront City Area. Based on the results of distributing questionnaires to 120 respondents who live around the riverfront city area of Pekanbaru City, the following results were obtained (Table 2).
Based on Table 2, it can be seen that the behavior towards waste management is relatively low where the community has not sorted out organic waste and non-organic waste. However, the community has started to use used goods that are still suitable for use. Behavior towards sanitation, especially the provision of septic tanks, is relatively high compared to waste management. Behavior towards water management is relatively high in collecting rainwater for bathing purposes, but few people still use used water for watering plants. Behavior towards energy management is relatively high when using sunlight and relatively low when using energy-saving lamps. Behavior towards managing the surrounding environment is rather moderate for prohibiting people from throwing garbage into the river and cooperation activities.
Table 1. Community perceptions of environmental awareness components
|
No. |
Variable |
Answer Criteria |
Amount |
Value |
||||
|
4 |
3 |
2 |
1 |
|||||
|
A |
Perception of waste |
|||||||
|
1 |
Sorting out organic and non-organic waste is an excellent first step to managing further waste. |
F |
0 |
42 |
77 |
1 |
120 |
2.34 |
|
S |
0 |
126 |
154 |
1 |
281 |
|||
|
2 |
Used goods that result from consumption and are still suitable for use should be reused. |
F |
0 |
35 |
85 |
0 |
120 |
2.29 |
|
S |
0 |
105 |
170 |
0 |
275 |
|||
|
B |
Perception of sanitation |
|||||||
|
1 |
Using a septic tank is an environmentally friendly way of disposing of household waste. |
F |
8 |
76 |
36 |
0 |
120 |
2.34 |
|
S |
0 |
126 |
154 |
1 |
281 |
|||
|
C |
Perception of water |
|||||||
|
1 |
Not leaving the water running without use. |
F |
8 |
80 |
32 |
0 |
120 |
2.8 |
|
S |
32 |
240 |
64 |
0 |
336 |
|||
|
2 |
When washing household appliances, water must be collected. |
F |
9 |
99 |
12 |
0 |
120 |
2.98 |
|
S |
36 |
297 |
24 |
0 |
357 |
|||
|
3 |
Used water must be reused. |
F |
0 |
11 |
109 |
0 |
120 |
2.09 |
|
S |
0 |
33 |
218 |
0 |
251 |
|||
|
4 |
One way to save water is using appliances such as showers for bathing and flush toilets. |
F |
0 |
12 |
107 |
1 |
120 |
2.09 |
|
S |
0 |
36 |
214 |
1 |
251 |
|||
|
5 |
The water is first collected in a container when washing clothes, eating/drinking utensils, and vegetables and fruits. |
F |
7 |
98 |
15 |
0 |
120 |
2.93 |
|
S |
28 |
294 |
30 |
0 |
352 |
|||
|
6 |
Using water for washing by running water through a hose or pipe will be more wasteful. |
F |
8 |
81 |
31 |
0 |
120 |
2.81 |
|
S |
32 |
243 |
62 |
0 |
337 |
|||
|
D |
Perception of energy |
|||||||
|
1 |
Daylight can be utilized for indoor lighting during the day. |
F |
21 |
94 |
5 |
0 |
120 |
3.13 |
|
S |
84 |
282 |
10 |
0 |
376 |
|||
|
2 |
The heat of sunlight can dry clothes, fabrics, etc. |
F |
54 |
64 |
2 |
0 |
120 |
3.43 |
|
S |
216 |
192 |
4 |
0 |
412 |
|||
|
3 |
Biogas from livestock manure is a later native energy source that can be utilized. |
F |
0 |
8 |
110 |
2 |
120 |
2.05 |
|
S |
0 |
24 |
220 |
2 |
246 |
|||
|
4 |
Solar heat and wind power can be utilized untuk cooking, water heating, and lighting. |
F |
3 |
59 |
58 |
0 |
120 |
2.54 |
|
S |
12 |
177 |
116 |
0 |
305 |
|||
|
5 |
Using Energy Saving Lamps (LHE) is one way to save energy. |
F |
6 |
99 |
15 |
0 |
120 |
2.93 |
|
S |
24 |
297 |
30 |
0 |
351 |
|||
|
6 |
Using electrical appliances such as leaving the television on without watching and using air conditioning at temperatures below 24℃ are examples of environmentally unfriendly behaviour in using electronic devices. |
F |
4 |
86 |
30 |
30 |
120 |
3.03 |
|
S |
16 |
258 |
60 |
30 |
364 |
|||
|
E |
Perception of the neighbourhood |
|||||||
|
1 |
Environmental pollution that occurs is air, water, and soil pollution. |
F |
2 |
93 |
25 |
0 |
120 |
2.81 |
|
S |
8 |
279 |
50 |
0 |
337 |
|||
|
2 |
It is important to report or complain about environmental pollution to the authorities. |
F |
4 |
48 |
68 |
0 |
120 |
2.47 |
|
S |
16 |
144 |
136 |
0 |
296 |
|||
|
3 |
It is important to warn those who cause pollution. |
F |
7 |
71 |
42 |
0 |
120 |
2.71 |
|
S |
28 |
213 |
84 |
0 |
3.25 |
|||
|
4 |
Taking part in tackling environmental pollution is important. |
F |
8 |
61 |
51 |
0 |
120 |
2.64 |
|
S |
32 |
183 |
102 |
0 |
317 |
|||
|
Total |
149 |
1217 |
910 |
34 |
2176 |
2.78 |
||
|
Score |
564 |
3549 |
1902 |
35 |
6050 |
|||
F= Frequency S= Score
Table 2. Pro-environmentally behaviour of the community
|
No. |
Variable |
Answer Criteria |
Total |
Value |
||||
|
4 |
3 |
2 |
1 |
|||||
|
A |
Behaviour towards waste management |
|||||||
|
1 |
I always segregate organic and non-organic waste at home. |
F |
0 |
6 |
113 |
1 |
120 |
2.04 |
|
S |
0 |
18 |
226 |
1 |
245 |
|||
|
2 |
I always utilize used items that are still usable. |
F |
0 |
21 |
99 |
0 |
120 |
2.18 |
|
S |
0 |
63 |
198 |
0 |
261 |
|||
|
B |
Behaviour towards sanitation |
|||||||
|
1 |
My house has a septic tank for disposal limbah rumah tangga. |
F |
10 |
74 |
36 |
0 |
120 |
2.78 |
|
S |
40 |
222 |
72 |
0 |
334 |
|||
|
C |
Behaviour towards water |
|||||||
|
1 |
I always use water collected in a container when washing clothes, eating/drinking utensils, vegetables and fruits. |
F |
4 |
96 |
20 |
0 |
120 |
2.87 |
|
S |
16 |
288 |
40 |
0 |
344 |
|||
|
2 |
I always reuse used water to water my plants. |
F |
0 |
3 |
58 |
59 |
120 |
1.53 |
|
S |
0 |
9 |
116 |
58 |
184 |
|||
|
D |
Energy-saving behaviour |
|||||||
|
1 |
I always make use of sunlight for lighting at home during the day. |
F |
23 |
92 |
4 |
1 |
120 |
3.14 |
|
S |
92 |
276 |
8 |
1 |
377 |
|||
|
2 |
I have always used the sun's heat to dry my clothes, fabrics, etc. |
F |
71 |
49 |
0 |
0 |
120 |
3.59 |
|
S |
284 |
147 |
0 |
0 |
431 |
|||
|
3 |
I always use Energy Saving Lamps (LHE) to save energy. |
F |
5 |
98 |
17 |
0 |
120 |
2.0 |
|
S |
20 |
294 |
34 |
0 |
348 |
|||
|
4 |
I always switch off electrical appliances when not needed such as television that is not being watched, use air conditioning at a minimum temperature of 24℃. |
F |
6 |
89 |
25 |
0 |
120 |
2.84 |
|
S |
24 |
267 |
50 |
0 |
341 |
|||
|
E |
Behaviour towards the surrounding environment |
|||||||
|
1 |
I have forbidden/warned people who throw rubbish into the river/in the street. |
F |
7 |
61 |
51 |
1 |
120 |
2.62 |
|
S |
28 |
183 |
102 |
0 |
314 |
|||
|
2 |
I always participate in gotong royong to clean up the neighbourhood. |
F |
0 |
70 |
50 |
0 |
120 |
2.58 |
|
S |
0 |
210 |
100 |
0 |
310 |
|||
3.4 Model of pro-environmental settlement arrangement based on community perception
In this study, data analysis used the Partial Least Square (PLS) approach using SmartPLS 4.0 software. Partial Least Square (PLS) is a Structural Equation Model (SEM) structural equation model based on variance components. The PLS approach is distribution-free (does not use certain distributed data and can be nominal, categorical, ordinal, interval, or ratio). In addition, PLS can also be used to measure small samples. The following are the stages of using the Least Square (PLS) approach using SmartPLS software.
3.5 Assessing the outer model or measurement model
There are three criteria for using data analysis techniques with SmartPLS to assess the outer model: Convergent Validity, Discriminant Validity, and Composite Reliability. The following is a picture of the PLS Algorithm in this study (Figure 2).
Figure 2. Outer model analysis
Description:
X = respondent characteristics
X1 = education
X2 = income
Y = perception of environmental awareness
Y1 = towards waste
Y2 = towards sanitation
Y3 = towards water
Y4 = towards energy
Y5 = towards the surrounding environment
Z = environmentally friendly behavior
Z1 = waste management behaviour
Z2 = sanitation behaviour
Z3 = clean water management behaviour
Z4 = energy management behaviour
Z5 = behaviour that cares about the surrounding environment
The criteria for the PLS Algorithm can be explained in the description below:
3.6 Convergent validity
The convergent validity of the measurement model with reflexive indicators is assessed based on the correlation between item score/component score estimated with PLS software. An individual intuitive measure is considered high if it correlates more than 0.70 with the measured construct. However, according to Chin, 1998 [11], a loading value of 0.5 to 0.6 is considered sufficient for early-stage research of measurement scale development. In this study, a loading factor limit of 0.50 will be used (Table 3).
Table 3 shows that each variable's outer loading test indicator has a value greater than 0.5 and smaller than 0.5. This indicates that not all indicators meet the requirements to represent these variables.
Table 3. Outer loading (measurement model)
|
Indicator |
Outer Loading |
|
X1 <- X |
0.706 |
|
X2 <- X |
0.878 |
|
Y1 <- Y |
0.174 |
|
Y2 <- Y |
0.695 |
|
Y3 <- Y |
0.309 |
|
Y4 <- Y |
0.694 |
|
Y5 <- Y |
0.594 |
|
Z1 <- Z |
0.066 |
|
Z2 <- Z |
0.722 |
|
Z3 <- Z |
-0.386 |
|
Z4 <- Z |
0.704 |
|
Z5 <- Z |
0.490 |
Source: SmartPLS Data Processing, 2023
Table 3 shows that each variable's outer loading test indicator has a value greater than 0.5 and smaller than 0.5. This indicates that not all indicators meet the requirements to represent these variables.
3.7 Discriminant validity
Discriminant validity is carried out to ensure that each concept of each latent variable is different from other variables. The model has good discriminant validity if each loading value of each indicator of a latent variable has the most considerable loading value with other loading values on other latent variables. The results of discriminant validity testing are obtained as follows (Table 4):
Table 4. Discriminant validity value (cross loading)
|
Indicator |
Characteristics of Respondents |
Perception of Environmental Awareness |
Environmentally Friendly Behaviour |
|
Education |
0.706 |
0.156 |
0.156 |
|
Revenue |
0.878 |
0.196 |
0.259 |
|
Perception of waste |
0.139 |
0.174 |
0.068 |
|
Perception of water |
0.221 |
0.695 |
0.652 |
|
Perception of sanitation |
-0.206 |
0.309 |
0.157 |
|
Perception of energy |
0.175 |
0.694 |
0.573 |
|
Perception towards the surrounding environment |
0.058 |
0.594 |
0.543 |
|
Behaviour towards waste |
-0.150 |
0.082 |
0.066 |
|
Behaviour towards water |
0.290 |
0.685 |
0.722 |
|
Behaviour towards sanitation |
-0.257 |
-0.235 |
-0.386 |
|
Behaviour towards energy |
0.125 |
0.618 |
0.704 |
|
Behaviour towards the surrounding environment |
-0.008 |
0.400 |
0.490 |
Source: SmartPLS Data Processing, 2023
Table 4 shows that some loading factor values for each indicator of each latent variable do not have a loading factor value that is not greater than the loading value when connected to other latent variables. This means that each latent variable has good discriminant validity, whereas some latent variables do not have a highly correlated measure with other constructs.
3.8 Composite reliability and average variance extracted (AVE)
The validity and reliability criteria can also be seen from the reliability value of a construct and the average variance extracted (AVE) value of each construct. The construct is highly reliable if the value is 0.70 and the AVE is above 0.50. The table below will present all variables' Composite Reliability and AVE values (Table 5).
Table 5. Cronbach's alpha composite reliability and average variance extracted (AVE)
|
Variable |
Cronbach's Alpha |
Composite Reliability (rho_a) |
Composite Reliability (rho_c) |
Average Variance Extracted (AVE) |
|
Respondents' characteristics |
0.438 |
0.479 |
0.774 |
0.634 |
|
Perception of environmental awareness |
0.395 |
0.425 |
0.631 |
0.289 |
|
Pro-environmentally behaviour |
0.253 |
0.431 |
0.415 |
0.282 |
Source: SmartPLS Data Processing, 2023
Based on the table above, it can be concluded that all constructs meet the reliable criteria, and some do not meet the requirements. This is indicated by Cronbach's Alpha composite reliability value above 0.70 and AVE above 0.50 as recommended criteria.
3.9 Significance testing and hypothesis testing
In PLS, statistical testing of each hypothesized relationship is conducted using simulation. In this case, the bootstrap method is carried out on the sample. Bootstrap testing is also intended to minimize the problem of abnormalities in research data. The estimated significance parameters provide beneficial information about the relationship between the research variables. The results of testing with bootstrapping from PLS analysis can be seen in the result for inner weight output presented in the structural model figure.
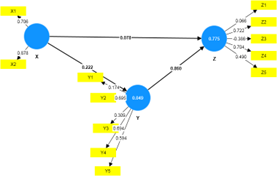
Figure 3. Inner weight analysis
Based on Figure 3 above, the following will explain the testing of each hypothesis.
3.10 Hypothesis testing of direct effect
The structural model (inner model) is a structural model to predict the causal relationship between latent variables. To predict the existence of a causal relationship in SEM-PLS using SmartPLS 3.0 M3 as follows (Table 6).
Table 6. Result for inner weights
|
Variable |
Sample Mean (M) |
Median |
Standard Deviation (STDEV) |
T Statistics (|O/STDEV|) |
P Values |
|
Education |
2.233 |
2.000 |
0.964 |
1.207 |
0.000 |
|
Revenue |
2.433 |
2.000 |
1.014 |
0.853 |
0.000 |
|
Perception of waste |
2.317 |
2.000 |
0.370 |
2.123 |
0.000 |
|
Perception of water |
2.767 |
3.000 |
0.559 |
3.124 |
0.000 |
|
Perception of sanitation |
2.617 |
2.670 |
0.257 |
0.684 |
0.000 |
|
Perception of energy |
2.811 |
2.830 |
0.237 |
0.565 |
0.000 |
|
Perception towards the surrounding environment |
2.656 |
2.750 |
0.435 |
0.810 |
0.000 |
|
Behaviour towards waste |
2.108 |
2.000 |
0.252 |
5.754 |
0.000 |
|
Behaviour towards water |
2.783 |
3.000 |
0.580 |
2.866 |
0.000 |
|
Behaviour towards sanitation |
2.200 |
2.000 |
0.344 |
2.079 |
0.000 |
|
Behaviour towards energy |
3.119 |
3.250 |
0.297 |
0.645 |
0.000 |
|
Behaviour towards the surrounding environment |
2.600 |
2.500 |
0.486 |
1.349 |
0.000 |
Source: SmartPLS Data Processing, 2023
The analysis results in the table above show the value of the path coefficient of influence between variables to significantly impact the model of respondent characteristics' effect on environmentally conscious perceptions and environmentally friendly behavior.
3.11 Characteristics of respondents on perceived environmental awareness
Based on the analysis results, which can be seen in the table above, the path coefficient value of the effect of respondent characteristics > conscious perception of the surrounding environment is 0.222 with a calculated t value of 0.052. This value is smaller than the t table for n = 120 and k = 3 is 1.66. Because t count < t table 1.66, it is concluded that respondents' characteristics do not significantly affect environmentally conscious perceptions, so H0 is accepted.
3.12 Characteristics of respondents on pro-environmentally behavior
The analysis of other direct effects also shows the path coefficient value of the impact of respondent characteristics > behavior of 0.078 with a calculated t value of 0.026. This value is smaller than the t table for n = 120 and k = 3, which is 1.66. Because t count 0.026 < t table 1.66, it is concluded that respondents' characteristics do not significantly affect environmentally friendly behavior, so H0 is accepted.
3.13 Perceptions of environmental awareness on pro-environmentally behavior
The analysis of other direct effects also shows the path coefficient value of the impact of perception > behavior of 0.860 with a calculated t value of 3.116. This value is greater than the t table for n = 120 and k = 3, which is 1.66. Because t count 3.116 > t table 1.66, it is concluded that environmentally conscious perceptions significantly affect pro-environmentally behavior, so H3 is accepted.
The knowledge of the Community influences positive perceptions of environmental management parameters. Various socialization and media affect the increasing understanding of the Community towards ecological management. A good knowledge of waste segregation is needed to get more financial benefits. If people know waste segregation, they will know which waste they will sell or save and get a higher selling value than the waste they have not sorted before. So it is necessary to socialize the mechanism of the Waste Bank system, one of which is sorting household waste. This positive perception is formed mainly due to the living environment conducive to implementing household waste management [12, 13].
As for the results of other studies, people's perceptions of the implementation of local government policies on waste management can be seen through 3 indicators, namely (1) stimulus or stimulation, (2) registration, and (3) interpretation. Aspects of sanitation hygiene assessment include kiosk conditions, trade space arrangement, roof/ceiling conditions, building walls, floors, lighting, clean water sources, toilets, garbage disposal, water disposal, security, places of worship, and parking areas [14, 15].
The results of this research show that the use and management of water by communities living on the banks of the Siak River is not based on a pro-environment and river conservation mindset. All the remaining water they use for their daily needs (washing, bathing, toileting and cooking) is immediately thrown into the river. Similar things have been reported by several researchers, both in Pekanbaru City and other cities in Indonesia [16-18]. One of the Sustainable Development Goals (SDGs) is to ensure people have universal access to clean water and adequate sanitation. Universal water supply and sanitation sector access will be achieved by 2030. As human growth accelerates, so does the need for clean water. The increase in population needs to be balanced with an increase in the amount of quality water. Good water quality must also be considered in fulfilling daily needs because clean water quality will affect health [19, 20].
The perception of people living along the Siak River towards environmental management is moderate. People already understand that actions not following the environment, such as throwing garbage into the river, can cause pollution but do not do otherwise. The community does not want to reprimand the perpetrators of throwing trash into the river. This happens because the Community still feels uncomfortable reprimanding the perpetrators for throwing garbage in the river, besides the people charged at other times for throwing trash into the river. These results align with the principle that the neighborhood is the third important context that shapes the quality of life, besides family and school. The Children's Worlds survey also showed that neighborhood factors can explain variations in children's life satisfaction, even after considering demographic factors and family and school-related factors [12, 13, 21].
Empowerment in environmental management is one of the principles of ecological development. According to Akanmu et al. [22], it is always associated with independence, participation, networking, justice, and sustainability. Community Empowerment has carried out the scope and stages of community empowerment activities, namely human development. business development, environmental development, and institutional development [23, 24].
Various facilities benefit the Community, especially protecting rivers in Sub-Districts. Protection of open areas is also found in other countries [25]. The river and mangrove areas in the Sub-Districts are also helpful as tourist areas. Promotion of this area has used technology as researches [25, 26]. However, this area was closed due to the COVID-19 pandemic, like other places, one of which is Pelabuhan Ratu [27].
The planning of pro-environmentally behavior Sub-Districts has implemented excellent and sustainable management with its principles [28]. In addition, it has also used sustainable energy [29]. All decisions in this management have been taken democratically and involve all stakeholders. People who live by the river usually belong to a community; the Community or organization influences all decision-making and behavior. All decisions in this management have been taken democratically and involve all stakeholders [30].
The results of this research also show that the characteristics of respondents consisting of education and income do not directly influence environmental awareness perception and pro-environmentally behavior. The highest respondent income was 3,000,000 to 3,999,990 as much as 30.8% followed by income below 1,000,000 to 1,999,990 as much as 28.3%. Meanwhile, at the education level, respondents with a high school education level were the highest with an % age of 35.8, followed by junior high school level at 32.5%. The level of education always correlates with lifestyle and concern for environmental sustainability and conservation. The more educated a community is, the higher the awareness of environmental conservation will usually be, and vice versa [31]. Respondents' education, which is dominant at the secondary level, has not been enough to influence the perception of environmental awareness and environmentally friendly behavior. Similarly, respondents' income, which is still very low, also does not affect the perception of respondents' environmental awareness.
In general, the community's perception regarding environmental awareness for all parameters is 2.78, which is included in the medium category, where the community agrees and has a positive perception of waste management, sanitation, water, energy, and the surrounding environment. Then from the results of data processing, it is known that the community has a response to pro-environmentally behavior of 2.65 which is included in the medium category. Data processing through SEM PLS shows that perception related to environmental awareness has a significant influence on pro-environmentally behavior among the community on the banks of the Siak River, Pekanbaru City. This means that it is very important for all stakeholders, in this case, the local government, to form a positive perception regarding environmental awareness so that they can encourage people to behave in a pro-environmentally manner or conservation mainstream of the river [32, 33].
This study also has several limitations such as the number of samples that should be added so that the conclusions are more accurate. Then in this study, the parties who are around and have businesses such as traders and restaurant owners have not been included as respondents in this study. They also have behaviors related to the existence of the Siak River, such as throwing garbage and wastewater into the river.
The perception of the community on the banks of the Siak River is moderate or agrees with various management related to environmental awareness, such as waste management, sanitation, clean water, energy utilization, and protecting the surrounding environment. Respondent characteristics, namely education and income, were not proven to influence community perceptions regarding environmental awareness, and pro-environmental behavior. Meanwhile, the perception of environmental awareness significantly influences the pro-environmentally behavior of the community on the banks of the Siak River. The settlement planning model on the banks of the Siak River that can implemented must pay attention to community perception regarding environmental awareness which will influence the community's pro-environmentally behavior. This can be a consideration for the Pekanbaru City government, especially the Public Works and Public Housing Office in designing and realizing better settlements in the Siak Riverbank area, Pekanbaru City.
Future research should focus more on the policies set by the government related to the riverfront area on the Siak River. As well as researching other factors that can form positive perceptions related to environmental awareness and factors that can change the environmentally friendly behavior of settlers.
This research would not have been possible without the support and attention of the Faculty of Social and Political Science, Riau University, the Environmental Science Study Program, as well as the promoters and examiners who provided much useful criticism and input in completing this research. Thank you also to Mr. Irwan Efendi who guided the writing and publication process of this article.
[1] Bakhri, B.S., Yusuf, M. (2019). An analysis of citizens’ understanding on sharia tourism in Pekanbaru City, Indonesia. WSEAS Transactions on Business and Economics, 16: 205-214.
[2] Kausarian, H., Suryadi, A., Susilo, Sumantyo, J.T.S., Batara. (2021). Analysis GIS for flood problem in the big city: A case study in Pekanbaru City, Riau Province, Indonesia. International Journal on Advanced Science, Engineering and Information Technology, 11(1): 342-349. https://doi.org/10.18517/ijaseit.11.1.11974
[3] Damanik F.K., Pratiwi, W.D. (2017). Consideration of tourism riverfront development elements for Pekanbaru City transformation. Journal of Regional and City Planning, 28(2): 140-150. https://doi.org/10.5614/jrcp.2017.28.2.5
[4] Ervianto, Wulfram, I., Felasari, S. (2019). Pengelolaan permukiman kumuh berkelanjutan di perkotaan. Jurnal Spektran, 7(2): 178-186.
[5] Purwanto, N. (2018). Environmental conscious behavior of settler jelai river banks, Sukamara District. Jurnal Pembangunan Wilayah dan Kota, 14(1): 41-50. https://doi.org/10.14710/pwk.v14i1.17348
[6] Gumelar, G. (2016). Nilai lingkungan dan sikap ramah lingkungan pada warga jakarta di pemukiman kumuh. Jurnal Psikologi, 12(1): 39-46. https://doi.org/10.24014/jp.v12i1.3007
[7] KLH (Kementerian Negara Lingkungan Hidup). (2013). Perilaku Masyarakat Peduli Lingkungan; Executive Summary. Jakarta.
[8] Sugiyono. (2018). Metode Penelitian Kuantitatif, Kualitatif dan R&D. Bandung, Alfabeta.
[9] Lakens, D. (2022). Sample Size Justification. Collabra: Psychology. University of California Press. https://doi.org/10.1525/collabra.33267
[10] PIF (Pekanbaru in Figure). (2022). Badan Pusat Statistik Kota Pekanbaru. Pekanbaru.
[11] Ledda, A., di Cesare, E.A., Satta, G., Cocco, G., de Montis, A. (2021). Integrating adaptation to climate change in regional plans and programs: The role of strategic environmental assessment. Environmental Impact Assessment Review, 91: 106655. https://doi.org/10.1016/j.eiar.2021.106655
[12] Grabowska I. (2021). Quality of life in poor neighborhoods through the lenses of the capability approach—A case study of a deprived area of Łódź city centre. Sustainability (Switzerland), 13(13): 7185. https://doi.org/10.3390/su13137185
[13] Borualogo, I.S., Mubarak, A., Khasanah, A.N. (2022). Children's worlds national report: Indonesia. https://isciweb.org/wp-content/uploads/2020/03/ Indonesia-National-Report-Wave-3.pdf.
[14] Knill, C., Steinbacher, C., Steinebach, Y. (2021). Balancing trade-offs between policy responsiveness and effectiveness: The impact of vertical policy-process integration on policy accumulation. Public Administration Review, 81(1): 157-160. https://doi.org/10.1111/puar.13274.
[15] Casaló, L.V., Escario, J.J. (2017). Heterogeneity in the association between environmental attitudes and pro-environmental behavior: A multilevel regression approach. Journal of Cleaner Production, 175: 155-163. https://doi.org/10.1016/j.jclepro.2017.11.237
[16] Kadir, E.A., Listia, Rosa, S., Othman, M. (2021). Water pollution source identification based on real-time monitoring system in Siak River. In 2021 8th International Conference on Information Technology, Computer and Electrical Engineering, ICITACEE 2021, Semarang, Indonesia, pp. 149-154. https://doi.org/10.1109/ICITACEE53184.2021.9617491
[17] Jiang, Y., Rohendi, A. (2018). Domestic water supply, residential water use behaviour, and household willingness to pay: The case of Banda Aceh, Indonesia after ten years since the 2004 Indian Ocean Tsunami. Environmental Science and Policy, 89: 10-22. https://doi.org/10.1016/j.envsci.2018.07.006
[18] Niedfeldt, H.J., Beckstead, E., Chahalis, E., Jensen, M., Reher, B., Torres, S., Rachmi, C.N., Jusril, H., Hall, C., West, J.H., Crookston, B.T. (2021). Use of technology to access health information/services and subsequent association with wash (water access, sanitation, and hygiene) knowledge and behaviors among women with children under 2 years of age in Indonesia: Cross-sectional study. JMIR Public Health and Surveillance, 7(1): e19349. https://doi.org/10.2196/19349
[19] Obaideen, K., Shehata, N., Sayed, E.T., Abdelkareem, M.A., Mahmoud, M.S., Olabi, A.G. (2022). The role of wastewater treatment in achieving sustainable development goals (SDGs) and sustainability guideline. Energy Nexus, 7: 100112. https://doi.org/10.1016/j.nexus.2022.100112
[20] Indana, F., Pahlevi, R.W. (2023). A bibliometric approach to sustainable development goals (SDGs) systematic analysis. Cogent Business and Management, 10(2): 2224174. https://doi.org/10.1080/23311975.2023.2224174
[21] Zhang, F., Li, D., Ahrentzen, S., Feng, H. (2020). Exploring the inner relationship among neighborhood environmental factors affecting quality of life of older adults based on SLR-ISM method. Journal of Housing and the Built Environment, 35(1): 215-242. https://doi.org/10.1007/s10901-019-09674-y
[22] Akanmu, A.A., Salisu, U.O., Fasina, S.O., Okunubi, S.A. (2019). An assessment of the local empowerment and environmental management program (LEEMP) for poverty alleviation in Oyo State, Nigeria. Environmental and Socio-Economic Studies, 7(3): 38-53. https://doi.org/10.2478/environ-2019-0016
[23] Liman, A., Ngah, I. (2015). Community forest management in Nigeria: A case of local empowerment and environmental management project (Leemp) in Adamawa State. Journal of Tropical Resources and Sustainable Science (JTRSS), 3(1): 48-54. https://doi.org/10.47253/jtrss.v3i1.688
[24] Syntia, R., Mulya, M.N. (2020). The effects of internal and external environment on SMEs empowerment-based environmental management. In Proceedings of the 7th International Conference on Multidisciplinary Research ICMR, Sumatera Utara, Indonesia. https://doi.org/10.5220/ 0008891106030608
[25] Saputra, F.E., Praningrum, Anggarawati, S. (2022). Will self-service technologies be widely adopted in travel, tourism, and hospitality industries during and after COVID-19? International Journal of Sustainable Development and Planning, 17(6): 1937-1942. http://doi.org/10.18280/ijsdp.170629
[26] Widiati, W., Mulyadi, A., Syahza, A., Mubarak. (2020). Analysis of plantation management achievement based on sustainable development. International Journal of Sustainable Development and Planning, 15(4): 575-584. http://doi.org/10.18280/ijsdp.150418
[27] Pamungkas, K., Sujatna, E.T.S., Heriyanto, H., Haron, R., Rosana, M.F. (2021). Brand association of ciletuh - palabuhanratu geopark towards COVID-19 pandemic and sustainable tourism. International Journal of Sustainable Development and Planning, 16(8): 1563-1574. http://doi.org/10.18280/ijsdp.160817
[28] Minuto, F.D., Lanzini, A., Giannuzzo, L., Borchiellini, R. (2022). Digital platforms for renewable energy communities projects: An overview international. Journal of Sustainable Development and Planning, 17(7): 2007-2013. https://doi.org/10.18280/ijsdp.170701
[29] Adam, C., Hurka, S., Knill, C., Steinebach, Y. (2019). Policy Accumulation and the Democratic Responsiveness Trap. Cambridge University Press. http://doi.org/10.1017/9781108646888.
[30] Serra, V., Ledda, A., Ruiu, M.G.G., Calia, G., De Montis, A. (2022). Integrating adaptation to climate change into sustainable development policy and planning. Sustainability (Switzerland), 14(13): 7634. https://doi.org/10.3390/su14137634
[31] Chigamba, G., Limuwa, M., Kaunda, E. (2021). Does paying for aquatic resources matter? A case of an african riverine ecosystem. Sustainability (Switzerland), 13(8): 4177. https://doi.org/10.3390/su13084177
[32] Akhmaddhian, S. (2019). Citarum authority agency as the commitment of the government in the conservation of water resources to realize the system of environmental-based water management. Jurnal Dinamika Hukum, 19(1): 204. https://doi.org/10.20884/1.jdh.2019.19.1.2272
[33] Hawa, N.I., Antriyandarti, E., Martono, D.N., Maulana, R.A. (2023). Improvement of environmental, social, and cultural attributes in the slum settlements on the riverbanks of Yogyakarta city under the Sultan’s rule. Sustainability (Switzerland), 15(11): 8974. https://doi.org/10.3390/su15118974