Rana Ibrahim Khaleel*![]() | Ibtihal H. Salim
| Ibtihal H. Salim![]() | Muataz I. Ali
| Muataz I. Ali![]()
© 2024 The authors. This article is published by IIETA and is licensed under the CC BY 4.0 license (http://creativecommons.org/licenses/by/4.0/).
OPEN ACCESS
The study carried out in Samarra City in central of Iraq to study some properties ground soil for selected sites. Survey was conducted and six soil samples were selected from two bore hole at depths (5 m, 10 m, 15 m) in terminal sites, coordinates were determined by using GPS. Soil-testing program was carried out at the Soil Mechanics Laboratory at University of Samarra to tested physical and chemical soil tests. Also evaluation of selected heavy metals Pb2+, Cu2+, Zn2+, Fe2+, were analyzed using Atomic Absorption Spectrophotometer (AAS). Test results of physical properties showed that the soil in upper layer to 10 m was sandy soil with gravel or silt, clay and the soil in under layer was gravelly with sand or silt, clay. According to Atterberg limits, the soil specimens were partially cohesive and had low plasticity (ML). The specific gravity values of the examined soils were ranged between 2.51-2.63 and permeability coefficient values were ranged between 1.441*10-3 to 1.694 *10-2 cm/sec, which refers to that the soil was medium to high permeability in the upper layer and decrease with depth. Regarding chemical properties, percentage of pH registered value (6.81-8.1), while the Sulphats, and chlorides recorded value were (13-25)% and ratios with means reached (16.5-31.5) for carbonates. From other hand heavy metals values indicated a homogenous distribution decrease with depth follows as Pb2+ < Fe2+ < Zn2+ < Cu2+ with means (61.9-125.15), (4.25-12.45), (2.65-11.6) and (1.8-4.65) respectively.
ground soil, soil properties, heavy metal, Samarra City
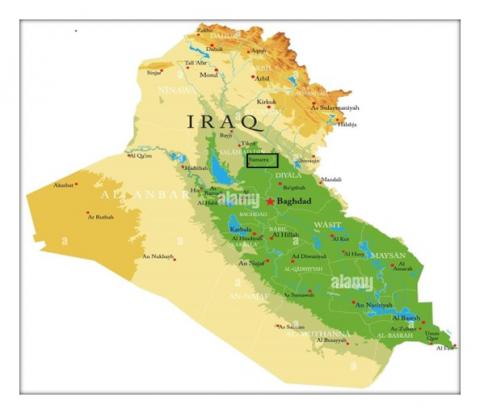
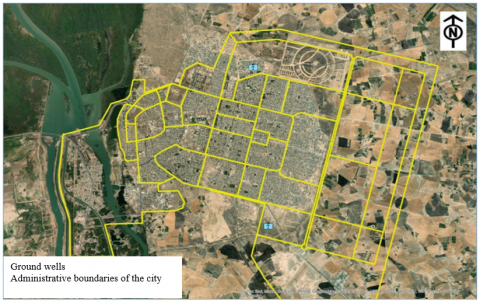
Samarra City, located at 125 kilometers north of Baghdad on the east bank of the Tigris, with an inhabited area of 42 km. Its geographic coordinates are N 34 20 27.562 E 43 49 24.75 (Figures 1 and 2). Many difficulties have arisen as a result of the city of Samarra's urban expansions in its residential neighborhoods and roadways, such as building fractures and road collapse.
The urban city of Samarra is characterized by its high population density, great variation in land use, and various human activities, which have led to many environmental problems, making there a need for research studies to evaluate the environmental reality of the region, soil properties, and the quality of surface and groundwater. The understanding of the soil type and its physical and chemical properties has a big and vital impact on the success of the next engineering project [1]. The soil in Iraq varies from place to place, whether in morphological, physical, or chemical features, and this is due to the manner of composition between the components of the original soil and fundamental rocks, as well as the climatic elements that impact the region [2]. Monitoring and evaluating heavy metal concentrations in soils, groundwater, and the atmosphere is critical in order to identify threats to human health and avoid bioaccumulation in the food chain and additional ecosystem deterioration [3]. Study [4] established that activity responsible for most of increasing levels of pollution in Samarra City caused by agriculture activity and in all suburb area of the city, besides industrial activity represented in industrial area which include car repairmen and painting and amendment of furniture beside the most important on location of pharmacological factory in central of city. Study [5] found the soil samples have been negatively affected with rise of groundwater recorded increase in value pH, moisture, EC and HCO3. The rise of underground water may be become big problem threatens future of in the city if not found solutions in nearby future. Until now a few data and understanding available around soil properties in Samarra City. This study came to aim assessment to study some physicochemical properties of soil at different depth.
2.1 Field stage
Six samples were taken from two sites of well in different sites at outskirts at 15 meters. Specimens were chosen and the locations were determined of each one was recorded by using GPS.
Figure 1. Map of Iraq showing location of Samarra City
Source: network
Figure 2. Location of the study area
Source: network
2.2 Soil sampling
First, a survey was conducted in the study area by exploratory tours to inspect its geology and select the location of the sample. Six soil samples were selected from two bore hole at depths (5 m, 10 m, 15 m) in terminal site form Samarra City depending on Guidelines for standardized soil sampling and analyses.
2.3 Preparation soil samples
A method [6] with some modification was followed in preparing soil samples. Soil samples are sieved using a stainless steel sieve to remove dirt. All samples were then taken to porcelain dishes separately. Each dish containing the selected sample was placed in an oven at a temperature of approximately 70℃ until a constant weight was obtained. The dried mass of each sample was then crushed into a fine powder using a mortar and pestle, and kept in a plastic vial with an identification tag inside the desiccator. The soil samples were preserved and digested with 5 ml of HNO3 (concentrated acid), then the samples were heated on hotplate and filtered by using filter paper (Whatman). Distilled water was added to dilute the mixture.
2.4 Physicochemical properties of soil samples
To determine the required physical and chemical soil properties by follow method [7], a soil-testing program was carried out at the Soil Mechanics Laboratory at University of Samarra. Routine soil physical tests were carried out to characterize the soil properties, namely the grain size analysis [8], specific gravity (Gs) [9], unified classification system [10], atterberge limit (L.L,P.L.) [11], permeability coefficient (k) [12, 13]. The chemical tests included the humidity, pH, electrical conductivity (EC) and content of (SO4-2, CO3-2) conducted for soil specimens.
2.5 Heavy metals measurement
The evaluation of selected heavy metals (Pb2+, Cu2+, Zn2+, Fe2+) was conducted after extrapolation from the standard curve, all the processed samples were examined in duplicates with metal concentration average. Preparing 1000 mg/L solution of the samples with serial dilution, the results was calibrated with relevant Shimadzu AAS Spectroscopic grade standards. Heavy metals (Pb2+, Cu2+, Zn2+, Fe2+) analyzed using Atomic Absorption Spectrophotometer (AAS) with air acetylene flame.
3.1 Particle size analysis
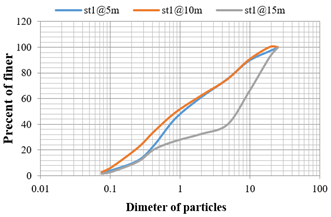
The separation of soil into classes or groups each having similar characteristics and potentially similar behavior called classification of soil. It’s aimed to classify the soil and inference of its properties. The soil is classified into different groups depending on the percentage of the passing of its components of gravel, sand, silt, and clay. The results of the particle size study of the specimens are in Figure 3 for the first borehole. The percentage of gravel ranged 24.6%, 25% at 5 m, 10 m but about 60 in 15 m and 73%, 72 for sand at 5 m, 10 m and 38% at 15 m as well as for silt between (2-3)% for 5 m, 10 m and 15 m.
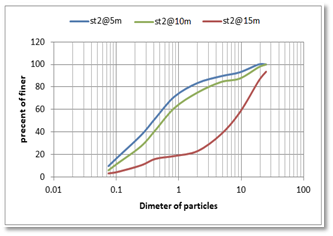
Figure 4 for the second borehole, for gravel its percentage 10.5% and 15.7% at 5 m,10 m respectively and 61.9% at 15 m and 80%, 79% for sand at 5 m,10 m also 35% at 15 m. Finally silt percentage in 10 m, 15 m between (3-6)% and for clay at 5 m as percentage 9.5%. In Figure 5, the flow chart of unified soil classification system (USCS) the soils were classified by unified soil classification system, the flow chart of this method illustrates as shows results of the classification shown in Tables 1 and 2.
Figure 3. Results of sieve analysis for first borehole
Figure 4. Results of sieve analysis for second borehole
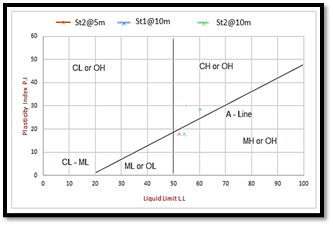
Figure 5. Soil classification according to plasticity scheme
3.2 Liquid Limit and Plastic Limit (Atterberg Limits)
Atterberg Limits Experiments were performed on 6 samples of soil fractions going through sieve No. 40 [14] Variation of Liquid Limit (L.L), Plastic Limit (P.L) and Plasticity Index (P.I) values of varying depths. The test results showed that the average of a Liquid Limit of the study area were in Table 3.
These limits were determined by the Penetration Cone scheme [15]. The plasticity index is the difference between the Liquid Limit and Plastic Limit of soil. It is an indicator of soil quality knowledge. The plasticity coefficient of the tested specimens was in Table 3. Based on the unified classification (USCS), In first borehole, the soil of the study area at 5 m, 10 m was classified as sandy soil with gravel, sandy soil with gravel and silt respectively, and the soil at 15 m was classified as gravelly soil with sand. In second borehole the soil of the study area at 5 m, 10 m was classified as sandy soil with clay, sandy soil with silt and gravel respectively, and the soil at 15 m was classified as gravelly soil with sand.
3.3 Permeability coefficient
Soil permeability was ranged between (1.69×10⁻²–5.41×10⁻³) cm/sec in first borehole and soil permeability was ranged between (1.33×10⁻²-1.44×10⁻³) cm/sec in second borehole as shown in Table 4. The results were refer to that the soil was medium to high permeability in the upper layer and decrease with depth, the reason due to the variety of fine granular found in soil pores.
3.4 Specific gravity (Gs)
Table 5 shows the specific gravity values, which varied from 2.51-2.63 at a rate of 2.49. The amount of fine materials in the soil and the presence of minerals with high specific gravity, such as calcite and dolomite, influenced specific gravity readings.
Table 1. Unified soil classification system (USCS)
|
Criteria for Assigning Group Symbols |
Group Symbol |
|||
|
Coarse-grained soils More than 50% of retained on No. 200 sieve |
Gravels |
Clean Gravels Less than 5% fines a |
|
|
|
More than 50% of coarse fraction retained on No. 4 sieve |
${{C}_{\alpha }}\ge 4\text{ }\!\!~\!\!\text{ and }\!\!~\!\!\text{ }1\le {{C}_{c}}\le {{3}^{c}}$ |
GW |
||
|
$C_\alpha<4$ and/or $1>C_e>3^c$ |
GP |
|||
|
Gravels with Fines More than 12% fines ad |
$P I<4$ or plots below " $A$ " line (Figure 5) |
GM |
||
|
$P I>7$ and plots on or above " $A$ " line (Figure 5) |
GC |
|||
|
Sands |
||||
|
50% or more of coarse fraction passes No. 4 sieve |
Clean Sands Less than 5% fines b |
${{C}_{\text{a}}}\ge 6\text{ }\!\!~\!\!\text{ and }\!\!~\!\!\text{ }1\le {{C}_{c}}\le {{3}^{c}}$ |
SW |
|
|
$C_u<6$ and/ or $1>C_c>3^c$ |
SP |
|||
|
Sands with Fines More than 12% fines b,s |
$P I<4$ or plots below " $A$ " line (Figure 5) |
SM |
||
|
$P I>7$ and plots on or above " $A$ " line (Figure 5) |
SC |
|||
|
Fine-grained soils 50% or more passes No. 200 sieve |
Silts and clays |
Inorganic |
$P I>7$ and plots on or above " $A$ " line (Figure 5) |
CL |
|
$P I<4$ or plots below " $A$ " line (Figure 5$)^e$ |
ML |
|||
|
Liquid limit less then 50 |
Organic |
$\frac{\text{ }\!\!~\!\!\text{ Liquid }\!\!~\!\!\text{ limit }\!\!~\!\!\text{ - }\!\!~\!\!\text{ oven }\!\!~\!\!\text{ dried }\!\!~\!\!\text{ }}{\text{ }\!\!~\!\!\text{ Liquid }\!\!~\!\!\text{ limit }\!\!~\!\!\text{ - }\!\!~\!\!\text{ not }\!\!~\!\!\text{ dried }\!\!~\!\!\text{ }}<0.75\text{; }\!\!~\!\!\text{ see }\!\!~\!\!\text{ Figure }\!\!~\!\!\text{ 5; }\!\!~\!\!\text{ OL }\!\!~\!\!\text{ zone }\!\!~\!\!\text{ }$ |
OL |
|
|
Silts and clays |
Inorganic |
$P I$ plots on or above " $A$ " line (Figure 5$)$ |
CH |
|
|
Liquid limit 50 or more |
$P I$ plots below " $A$ " line (Figure 5$)$ |
MH |
||
|
|
Organic |
$\frac{\text{ }\!\!~\!\!\text{ Liquid }\!\!~\!\!\text{ limit }\!\!~\!\!\text{ --- }\!\!~\!\!\text{ oven }\!\!~\!\!\text{ dried }\!\!~\!\!\text{ }}{\text{ }\!\!~\!\!\text{ Liquid }\!\!~\!\!\text{ limit }\!\!~\!\!\text{ - }\!\!~\!\!\text{ not }\!\!~\!\!\text{ dried }\!\!~\!\!\text{ }}<0.75\text{; }\!\!~\!\!\text{ see }\!\!~\!\!\text{ Figure }\!\!~\!\!\text{ 5; }\!\!~\!\!\text{ OH }\!\!~\!\!\text{ zone }\!\!~\!\!\text{ }$ |
OH |
|
|
Highly Organic Soils |
Primarily organic matter, dark in color, and organic odor |
Pt |
||
|
a Gravels with 5 to 12% fine require dual symbols: GW-GM, GW-GC, GP-GM, GP-GC. b Sands with 5 to 12% fines require dual symbols: SW-SM, SW-SC, SP-SM, SP-SC. C ${{C}_{\alpha }}=\frac{{{D}_{60}}}{{{D}_{10}}};{{C}_{c}}=\frac{{{\left( {{D}_{30}} \right)}^{2}}}{{{D}_{60}}\times {{D}_{10}}}$ d If $\text{ }\!\!~\!\!\text{ }4\le PI\le 7$ and plots in the hatched area in Figure 5, use dual symbol GC-GM or SC-SM. e If $\text{ }\!\!~\!\!\text{ }4\le PI\le 7$ and plots in the hatched area in Figure 5, use dual symbol CL-ML. |
||||
Das [13].
Table 2. Particle size analysis of studied soils
|
|
Depth |
Gravel % |
Sand % |
Silt % |
Clay % |
The Classification |
|
Sit.1 |
5 m |
24.6 |
73 |
2.4 |
|
Poorly graded sand with gravel |
|
10 m |
25 |
72 |
3 |
|
Well-graded sand with silt and gravel |
|
|
15 m |
60 |
38 |
2 |
|
Poorly graded gravel with sand |
|
|
Sit. 2 |
5 m |
10.5 |
80 |
|
9.5 |
Poorly graded sand with clay |
|
10 m |
15.7 |
79 |
5.3 |
|
Poorly graded sand with silt and gravel |
|
|
15 m |
61.9 |
35 |
3.1 |
|
Poorly graded gravel with sand |
Table 3. The result of Liquid Limit and Plastic Limit
|
|
The Depth |
L.L |
P.L |
P. I |
|
Site 1 |
5 m |
----- |
----- |
N. P |
|
10 m |
52 |
34.3 |
17.7 |
|
|
15 m |
------ |
------ |
N. P |
|
|
Site 2 |
5 m |
54 |
36.36 |
17.64 |
|
10 m |
60 |
30.8 |
29.2 |
|
|
15 m |
------ |
------ |
N. P |
Table 4. Permeability coefficient
|
|
Depth |
Permeability Coefficient (k) cm/sec |
|
Site 1 |
5 m |
5.41*10-3 |
|
10 m |
6.45*10-3 |
|
|
15 m |
1.694*10-2 |
|
|
Site 2 |
5 m |
1.441*10-3 |
|
10 m |
6.785*10-3 |
|
|
15 m |
1.34*10-2 |
Table 5. Specific gravity for soil
|
|
The Depth |
Specific Gravity |
|
Site 1 |
5 m |
2.60 |
|
10 m |
2.58 |
|
|
15 m |
2.63 |
|
|
Site 2 |
5 m |
2.51 |
|
10 m |
2.54 |
|
|
15 m |
2.52 |
3.5 Chemical tests
From the chemical tests of the soil samples were analyzed for Sulphats content, the humidity, carbonate content, electrical conductivity (EC) and pH. The results are summarized in Table 6.
Table 6. Chemical results for soil specimens
|
|
Depth |
pH |
Hum % |
EC Ds/m |
SO4-2 % |
CO3-2 % |
|
Site 1 |
5 m |
6.8 |
18 |
3.1 |
17 |
16.5 |
|
10 m |
7.2 |
32.5 |
4 |
18 |
21.5 |
|
|
15 m |
7.9 |
76 |
4.6 |
13 |
27.5 |
|
|
Site 2 |
5 m |
7.3 |
21 |
3.4 |
22 |
21.5 |
|
10 m |
7.6 |
36.5 |
4.2 |
25 |
26.5 |
|
|
15 m |
8.1 |
74.5 |
5.1 |
24 |
31.5 |
The pH is equal to the negative logarithm of the molarity of hydrogen ion concentration and is used to determine the acidity or basicity of solutions. The soil pH average in the research region were in Site.1 (7.3) and in Site.2 (7.63) as shown Table 5. The results suggest that the soil is a basicity soil that rise with the depth Table 6.
3.7 Humidity of soil
Measurements of soil humidity in the laboratory (ASTM) consistent dependence of surface soil moisture on near-surface air humidity is observed; the sensitivity of surface water content on relative humidity was found to become stronger as the clay content increased and deep increase in the borehole. These results indicate that the variability in soil moisture may be significantly affected by groundwater from transported from the Tigris River and its tributaries. The humidity of soil in the research region were in Site.1 (18%, 32.5%, 76%) and in Site.2 (21%, 36.5%, 74.5%) as shown Table 6.
3.8 Electrical conductivity (EC) of soil
The electrical conductivity in the soil were (3.1, 4, 4.6) ds/m in site 1 and (3.4, 4.2, 5.1) ds/m as in Table 6. These results indicate that the electrical conductivity potential rise with depth. The electrical conductivity (EC) measured in a soil is primarily attributed to sodium and salt (or specifically the dissolved ions in solution) is the principal component of the soil matrix that conducts electricity, and the EC measured in a soil is mostly attributable to sodium. While EC is mainly reliant on soil salinity, it will also rise and fall in response to soil humidity.
3.9 Sulphats content
The most frequent in soil are Sulphats. The major source of sulfates is either gypsum sediment or ions transported from the Tigris River and its tributaries which causes groundwater to rise. As indicated in Table 6 the average sulphate content in the research region were in Site.1 (17%) and Site.2 (23.6%).
3.10 Carbonate content
The carbonate content in the soil specimens were (16.5, 21.5, 27.5)% in site 1 and (21.5, 26.5, 31.5)% as in Table 6. These results indicate that the Carbonate content rise with depth.
3.11 Heavy metals
Descriptive statistics related to the concentration of heavy metals in the two cites at Samarra City are presented in Table 7. The Coefficient Variation (CV) values in the soil were found to exhibit high variability. These metals values indicate a homogenous distribution; it might increase the effect of the point sources. The concentration mean of heavy metals in the samples follows the chemical order as: Fe2+ < Zn2+ < Pb2+< Cu2+.[16].
In the absence of government oversight, the processes of burying the waste of building materials of damaged houses or the old ones, are carried out randomly. Especially in the outskirts of the city where no one can see that; which mean increasing the burial of mineral materials. These elements are present in the water due to the leaching processes that take place in the soil, which washes the heavy elements to the soil bottom. Thus, extracting water might be harmful for human health because of heavy metals high concentration in the ground water [17].
Table 7. Concentration of heavy metals in two sites
|
|
Depth |
Pb2+ |
Cu2+ |
Zn2+ |
Fe2+ |
|
Site 1 |
5 m |
125.15 |
3.40 |
11.60 |
12.45 |
|
10 m |
104.35 |
2.15 |
8.55 |
9.65 |
|
|
15 m |
79.40 |
2.90 |
3.65 |
7.30 |
|
|
Site 2 |
5 m |
86.00 |
4.65 |
7.30 |
9.40 |
|
10 m |
75.55 |
2.50 |
4.35 |
6.85 |
|
|
15 m |
61.90 |
1.80 |
2.65 |
4.25 |
The contamination source was supposedly catchment in differing functional purposes and elevations. The heavy metals concentration that might reaches the ground water in the sites depends on the transferring mass moved through the soil particles. The formed contamination, spreads mainly in the upper part of the aquifer. The contamination comes across surface water bodies or draining the flow of the ground water. In these two sites, the contamination slows down considerably and gradually penetrates the soil and eventually reaches the ground water [18]. Iron as Fe2+ might be released into water from natural deposits or industrial wastes and corrosion of metals. The concentration levels of Fe2+ in both sites are exceeding the WHO standards levels which was considered to be 0.3 mg/L [19]. Zinc in the Zn2+ form can be found naturally in water. Frequently in areas near industrial waste, or metal plating places and houses materials waste (specially metals). WHO has determined the approved zinc concentration as 3.0 mg/L. The measured concentration in both sites were exceed the limited value of WHO [20]. Lead enters the environment in the shape of Pb2+ from industry, mining, gasoline, coal, plumbing and as water additive. The allowable limit for Pb2+ are 0.003mg/L. By compares, the results obtained from the two sites were exceed the WHO limitation which considered high polluted groundwater found in both places [21]. Copper may enter the systems of water in the shape Cu2+ through mineral dissolution, industrial effluents, due to the use as agricultural pesticide sprays, algaecide and insecticide. The standard of Cu2+ allowable limit by WHO is 2.0 mg/L. The measured samples were near the WHO limitation and around [22].
Physical and chemical properties of the soil and heavy metal were studied from selected sites of the city of Samarra and to various depths and soil classification was carried out according to international standards. As showed sedimentation of flood fans and slopes. The research region has a basic, non-ripple topography, yet there are some simple, spaced-out ripple. The heavy metals had toxicity, persistence, bioaccumulation, and non-biodegradability, there for it pose a risk to people and other ecological receivers.
Thanks to the College of Engineering, University of Samarra, Samarra, Iraq for providing the supplies and facilities to conduct and complete testes of the research.
[1] Lew, B. (2010). Structure damage due to expansive soils: A case study. Electronic Journal of Geotechnical Engineering, 15: 1317-1324.
[2] Yigini, Y., Panagos, P., Montanarella, L. (2013). Soil resources of mediterranean and Caucasus countries. Office for Official Publications of the Euroean Communities, Luxembourg, 237.
[3] Li, C., Zhou, K., Qin, W., Tian, C., Qi, M., Yan, X., Han, W. (2019). A review on heavy metals contamination in soil: Effects, sources, and remediation techniques. Soil and Sediment Contamination: An International Journal, 28(4): 380-394. https://doi.org/10.1080/15320383.2019.1592108
[4] Ibrahim, S.A., Al-Tawash, B.S., Abed, M.F. (2018). Environmental assessment of heavy metals in surface and groundwater at Samarra City, Central Iraq. Iraqi Journal of Science, 59(3): 1277-1284. http://doi.org/10.24996/ijs.2018.59.3A.16
[5] Al-Samarrai, G.F., Khaleel, R.I. (2020). Groundwater impact of Samarra city agriculture areas. In IOP Conference Series: Materials Science and Engineering, 928(2): 022076. https://doi.org/10.1088/1757-899X/928/2/022076
[6] Shirin, A., Kabir, M.J., Mamun, K.M. (2023). Analysis of heavy metals and other elements in soil samples for its physicochemical parameters using energy Dispersive X-Ray Fluorescence (EDXRF) techniques. Austin Journal of Environmental Toxicology, 9(1): 1-6.
[7] Ferretti, M., Fischer, R., Mues, V., Granke, O., Lorenz, M. (2010). Basic design principles for the ICP forests monitoring networks. Manual part II. Manual on methods and criteria for harmonized sampling, assessment, monitoring and analysis of the effects of air pollution on forests. Thünen Institute of Forest Ecosystems, Eberswalde, Germany. http://www.icp-forests.net/page/icp-forests-manual.
[8] ASTM-D422-90. (2014). Standard test method for particle-size analysis of soils. Washington, DC: American Society for Testing and Materials. https://www.astm.org/d0422-63r98.html.
[9] ASTM D854. (2023). Standard test methods for specific gravity of soil solids by water pycnometer. Withdrawn2023. https://www.astm.org/d085414.html.
[10] ASTM International. (2007). Standard test method for particle-size analysis of soils (Standard D422-63[2007]). In Annual Book of ASTM Standards Soil and Rock (I): West Conshohocken, PA (Am. So. Testing Mater.). https://doi.org/10.1520/D0422-63R07
[11] ASTM. (2017). Standard test methods for liq-uid limit, plastic limit, and plasticity index of soils. ASTM International, West Conshohocken, PA. https://doi.org/10.1520/D4318-17E01
[12] ASTM. (2019). Standard Test Method for Permeability of Granular Soils (Constant Head). ASTM International, West Conshohocken, PA.
[13] Das, B.M. (2006). Adavanced Soil Mechanic, 3rd edition. Taylor and Fancies. https://doi.org/10.1201/9781351215183
[14] BSI, B.S. (1990). Methods of Test for Soils for Civil Engineering Purposes-part2. BSI-British Standards Institution, London.
[15] Anticó, E., Cot, S., Ribó, A., Rodríguez-Roda, I., Fontàs, C. (2017). Survey of heavy metal contamination in water sources in the municipality of Torola, El Salvador, through in situ sorbent extraction. Water, 9(11): 877. https://doi.org/10.3390/w9110877
[16] Galitskaya, I.V., Mohan, K.R., Krishna, A.K., Batrak, G.I., Eremina, O.N., Putilina, V.S., Yuganova, T.I. (2017). Assessment of soil and groundwater contamination by heavy metals and metalloids in Russian and Indian megacities. Procedia Earth and Planetary Science, 17: 674-677. https://doi.org/10.1016/j.proeps.2016.12.180
[17] Al-Paruany, K.B., Ali, A.J.A., Hussain, K.I., Khalaf, H.S., Alias, M.F. (2018). Assessment of heavy metals in some ground water wells at Baghdad city/Iraq. Journal of Global Pharma Technology, 10(3): 62-71.
[18] Hussein, M.A., Theyab, M.A., Mahmood, Y.H., Al-Hilali, B.M.I. (2020). Heavy metals (Fe, Cu, Ni, Pb, Cd, Zn, Cr) effects on soil and plants in street crossroads at Samarra city-Iraq. In AIP Conference Proceedings, 2213(1): 020209. https://doi.org/10.1063/5.0000443
[19] Al-Dabbas, M., Schanz, T., Yassen, M. (2012). Proposed engineering of gypsiferous soil classification. Arabian Journal of Geosciences, 5(1): 111-119. https://doi.org/10.1007/s12517-010-0183-5
[20] Tadiboyina, R., Ptsrk, P.R. (2016). Trace analysis of heavy metals in ground waters of vijayawada industrial area. International Journal of Environmental and Science Education, 11(10): 3215-3229.
[21] Wuana, R.A., Okieimen, F.E. (2011). Heavy metals in contaminated soils: A review of sources, chemistry, risks and best available strategies for remediation. International Scholarly Research Notices, 2011: 402647. https://doi.org/10.5402/2011/4026471-20
[22] Boateng, T.K., Opoku, F., Acquaah, S.O., Akoto, O. (2015). Pollution evaluation, sources and risk assessment of heavy metals in hand-dug wells from Ejisu-Juaben Municipality, Ghana. Environmental Systems Research, 4: 1-12. https://doi.org/10.1186/s40068-015-0045-y