Zainab Mohammed*![]() | Tuqa R. Alrobaee
| Tuqa R. Alrobaee![]()
© 2024 The authors. This article is published by IIETA and is licensed under the CC BY 4.0 license (http://creativecommons.org/licenses/by/4.0/).
OPEN ACCESS
Sustainable urban housing is one of the most important and pressing issues facing cities in the developing world, which has been studied in recent decades in order to achieve sustainability. This research addressed the main factors of sustainable urban housing (diversity, density, sustainable transportation, and social interaction), which contribute to achieving sustainable urban housing. Field surveys, charts and maps, based on geographic information systems, were used to analyze and measure indicators derived from these factors. The practical study was conducted in the Hindiya neighborhood in Najaf, Iraq. This research paper raised the problem of the weak application of sustainable urban housing indicators in residential neighborhoods, this study used an approach that aimed to establish a sustainable urban environment by understanding the fundamental function of determinants and indicators of sustainable urban housing. The study can assist urban planners and engineers to use the research findings as a tool to build sustainable residential areas. The study assumes the existence of a set of factors, indicators and standards through which sustainable urban housing can be achieved. The study's findings revealed that the study area (Al-Hindiya neighborhood) attained an index of service accessibility and an indicator of social contact. Communication and social engagement indicators are also high. This reflects positively on the study area's potential for sustainability. While the study discovered that the mixed use index is low in the study area due to the prevalence of residential use. The research helps to define the physical, social, and economic components of sustainable urban housing, as well as the various purposes it serves.
sustainability, sustainable urban housing, diversity, horizontal mixed use, sustainable transportation, high density, social interaction, Al-Hindiya neighborhoods
Technological advancements, the complexity of human life, and the high expense of living have resulted in a poor implementation of sustainable housing indicators in neighborhoods in general. As a result, the planning strategy used in residential areas, together with the movement toward sustainability, could provide a dramatic answer to this problem. Many theories and approaches to sustainable housing planning have been developed to ensure a better social life, including the theory of new urbanization and its sub-models, such as new traditional neighborhoods, which received significant attention from researchers and urban planning specialists at the end of the twentieth century and were regarded as one of the new urban approaches to planning human-oriented neighborhoods [1].
Mixed use and sustainable transportation are critical aspects in improving quality of life and establishing sustainable urban housing [2].
Nevertheless, prior investigations and analyses have not comprehensively examined sustainable urban housing indicators, let alone their significance in constructing a sustainable residential neighbourhood. Therefore, it is imperative to look into the efficacy and implications of this strategy for creating sustainable residential environments.
Winston Sustainable Communities conducted a 2014 study that provided a comparative perspective on urban dwelling across the European Union. The study defined several key criteria for measuring the sustainability of urban housing, including mixed land use, high residential density, and high-quality housing and neighborhoods, The research paper focuses on many problems related to housing and communities in some urban areas that lead to poor quality of life. According to the report, there are substantial discrepancies between cities in terms of establishing sustainable housing, with plenty space for development. relative success requires additional research to continue investigating the aspects that contribute to obtaining high levels of sustainability [3].
In a 2019 study, Shama and Motlak [4] investigated the indicators of sustainable housing, as well as a variety of other topics related to sustainable housing, with a focus on the relationship between the notion of sustainable development and housing. To build a mechanism for recognizing indicators. The study's goal is to create indicators of sustainable housing that reflect social and cultural justice, economic effect, and contribution to a more sustainable lifestyle. The principle of local distinctiveness contributes to the integration of housing and environmental themes. Experts in the field of sustainable housing planning were consulted to develop an efficient and effective system of indicators deriving from local specificity and measurability [4].
Adamec et al. [5] conducted in 2021 addressed how to measure sustainable housing (proposed as an indicator-based assessment tool). According to the report, housing is the fundamental driver of urban development, and it makes a considerable contribution to sustainability. The research focuses on the United Nations Geneva Charter on Sustainable Housing as a conceptual foundation for carrying out the proposed evaluation. The researchers employed qualitative and descriptive data to create a paradigm for sustainable housing. The study indicated that a comprehensive strategy is required to strike a balance between the social, environmental, and economic elements of the suggested housing sustainability evaluation instrument [5].
Previous literature produced positive results, which helped to shape the direction of this research paper. A study conducted by WINSTON in 2014 addressed (mixed use, density, and quality of housing), and the Shama and Motlak [4] study in 2019 revealed indicators of urban housing in general, such as social and cultural justice. In a 2021 study conducted by Adamec et al. [5], he noted that housing is the key driver of urban development, which contributes greatly to sustainability. Previous research and studies did not focus on the fundamental features and indicators that are regarded characteristics of sustainable urban housing, as well as their significance in creating a sustainable urban environment on a wide scale. As a result, this study seeks to fill this gap by focusing on the factors of diversity, sustainable transportation, high density, and social interactions, extracting relevant indicators, discussing methods for measuring them, and establishing standards for achieving an urban and sustainable residential environment, The research will focus in particular on measuring the extracted indicators in the Hindiyah neighborhood in the city of Najaf in Iraq.
Sustainability is one of the most important philosophical concepts that has progressed from people' exclusive responsibility for their environment to international and local environmental groups demanding increased attention to the urban environment. It is described as development that meets current generations' needs while preserving future generations' ability to meet their own. That is, it balances the present with the future [6, 7].
It is also referred to as a process that aims to increase the population's quality of life while simultaneously achieving economic growth that is sustainable [5], Alternatively, it is a method of organizing human activity and civilization so that society, its economy, and its citizens can meet their needs over an extended period of time [8]. The term "sustainability" was first used in the early 1990s to refer to sustainable urban housing and transportation in order to fulfill the goals of sustainable social, economic, and environmental development [9].
It is also recognized as a technique that strives to improve the Housing in general refers to the usage of housing, transportation, roads, and public utilities, as well as what is related to the material aspects of existence, as it is a key component in the social, economic, and environmental dimensions. It is defined as a building, structure, or house that serves as a permanent residence for humans. It contains a wide range of housing options and spaces for people of all socioeconomic backgrounds [3, 10].
There are other definitions of sustainable urban housing, as it is defined as an approach based on ensuring the existence of housing units at prices appropriate to the various strata of society, and that the provision of mixed-use land and the proximity of public services and sustainable transport enhances accessibility and seeks to achieve economic, social, and environmental sustainability from the planning stage to the implementation stage [11, 12].
Or it is the organized field in which human societies produce their material and cultural products. It is constructed inside the confines of housing and is of high value. It is distinguished by three jobs: work, life, and productive jobs. Consider that housing is more than just dwelling; it also involves the community and its service institutions and public facilities that serve all residents of the residential neighborhood, meeting their fundamental requirements and working to stabilize them [13]. The following considerations help to clarify the objectives of sustainable urban housing.
The numerous housing development projects involve a set of objectives that compete and complement each other to produce sustainable urban housing, which are as follows:
(1) Quality of life: It refers to the quality of human life, as the primary goal of sustainable urban housing is to improve the quality of life for current residents and future generations, to ensure their health and well-being, and to provide all of the services required for life and the ability to meet their needs. Taking into account the social, economic, and environmental factors [14].
(2) Proximity to public services: The availability and accessibility of local services such as stores, entertainment, health care, education, and other amenities, which provide a variety of social, economic, and health benefits [15].
(3) The use of sustainable modes of transportation results in fewer car trips, which increases pedestrian traffic, reduces air pollution and congestion, and increases the number of interactions that encourage the formation and strengthening of social networks and a sense of community, as well as the presence of local job sources that benefit the local economy [16].
The worldwide organizations represented by UN-Habitat have defined numerous principles for sustainable neighborhood development and promoting sustainability in residential areas, which include:
1. High densities imply that people and their activities are concentrated in a single location, and that high-density development plays an important role in achieving the dimensions of social, economic, and environmental sustainability, such as effective land use, sustainable transportation, and pedestrian movement and accessibility [17].
2. Mixed uses: Its goal is to generate a variety of activities such as industrial and commercial housing, jobs, and services in close proximity to one another [18].
3. Social Mix: This principle seeks to foster interaction and social cohesion among the various social classes in the residential community [19].
4. Access to basic commercial services, transportation, housing, health, and education [20].
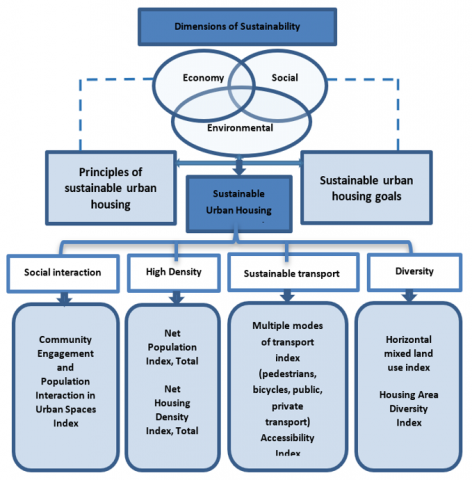
The following criteria and sub-indicators can be derived from the aforementioned objectives and principles in order to achieve sustainable urban housing: See Figure 1:
(1) Diversity factor;
(2) Sustainable transportation factor;
(3) High density factor;
(4) Social interaction factor.
Figure 1. Link between the concept of sustainability and sustainable urban housing
Source: Researchers
6.1 Diversity factor
Diversity in sustainable urban housing is a crucial component in developing a sustainable urban environment. It is a multidimensional phenomenon that necessitates the provision of desirable urban qualities such as a diverse range of housing types in terms of category and size, as well as mixed land use, which attracts inhabitants by serving all of their daily needs for generations. way that fits their lifestyle. Study comprises of two sub-indicators that quantify diversity in the residential neighborhood [21]:
6.1.1 Horizontal mixed land use index
The combination of land uses is critical to attracting the population by combining activities and services in one location, as inhabitants may walk a short distance to get their daily needs of services, jobs, and social networking sites [22], Mixed use is also an important component in attaining Sustainable urban housing since it optimizes land usage, reduces walking distances, and reduces environmental pollution caused by car use. As a result, it is regarded as one of the most crucial aspects of developing a sustainable urban environment [3]. According to study [18], the entropy equation can be used to calculate the area of each land use relative to the overall area.
6.1.2 Diversity of housing space
The notion of multiple housing alternatives promotes affordability, provides diverse options, distributes inexpensive housing among high-cost housing, allows for diverse tenure, shortens travel distances, and broadens services [23].
Thus, it achieves the economic and social objectives of sustainable housing while also establishing a self-sufficient residential area with integrated services. It addresses all of the residents' wants and desires while also helping to create a sustainable urban environment. In addition, it meets the housing needs of all parts of society [24, 25].
The variety of the housing area is measured using the ratio of single-type housing to total housing in the region. The multiplicity of housing possibilities is calculated using Simpson's index, which has the following statistical formula [26]:
Simpson index $=1-\sum(\mathrm{Ai} / \mathrm{An})^2$
6.2 Sustainable transportation factor
Transportation is regarded as one of the most influential components of the urban environment in its form, as the shape of our cities today is primarily a reflection of the transportation technology that has been adopted over time as the city has grown. For many academics in the realm of movement and transportation, urban sustainability signifies the limiting of mobility and passive traffic [25]. Ensuring that urban areas are prepared for an appropriate shape and size for walking, cycling, and efficient collective transportation, as mixed use is required to create social cohesion and interaction while allowing us to acquire services and facilities at lower costs [27]. The sustainable transport component and related indicators are critical in accomplishing the economic, social, and environmental objectives of sustainable urban housing. It also promotes the use of key forms of transportation, such as pedestrians and bicycles, in order to build a sustainable urban environment [28].
The World Business Council for Sustainable Development (WBCSD) defines sustainable transport as the ability to provide the community's need for freedom of movement, easy access, communication, and linkages without sacrificing the human and environmental values affecting society today or in the future [29]. Mixed use and proximity to services provide simple access and promote sustainable modes of transportation such as pedestrian walkways, cycling, public transportation, and reducing the use of private cars [22]. and includes two sub-indicators to quantify sustainable transport in residential communities, namely the diversity of transportation modes and accessibility:
6.2.1 Multiple modes of transport
The diversity of transport modes is a distinguishing aspect of sustainability, and it is one the markers of sustainable transport in modern cities, implying availability of different modes of transportation. indicator contains three metrics:
• Pedestrian movement: Pedestrian movement spaces are among the most potent and impactful components of sustainable urban housing [30]. a vital area that affects all urban functions as well as the economic, social, and environmental dimensions of its users, with its multiple components of sidewalks, crossings, and pedestrian areas, thus creating a sustainable residential neighborhood that achieves well-being and enhances social interaction for the population, and must strike a balance between pedestrian and car movement, The walking area is the primary section of the walkway and is allocated for people to stroll without barriers inside the sidewalk [31, 32]. Pedestrian traffic is a measure of the accessibility of services to develop a pedestrian environment with wider areas and high efficiency.
• Cycling: It is one of the most essential ecologically friendly modes of transportation, since much research has been conducted to find fewer energy-consuming alternatives while also providing citizens with comfort and physical safety. It is also a source of tourism and entertainment inside the city or for individual use. As a result, it contributes to the development of a desirable urban environment for the general public [33].
• Public transport: Public transport is one of the most important factors affecting the development of the internal structure of the city, but it is not encouraged to introduce public transport in residential neighborhoods, but it must be provided on its borders, as well as the importance of having nearby stations that are easily accessible and achieve interconnection and integration between the various modes of transport, which include pedestrian corridors, bicycles and [34].
• Private transport: The usage of private transportation is at the final level of transport patterns, and the concentration of pedestrian traffic inside the neighborhood is tied to places, public squares, and recreational areas on the community's outskirts, which are supported by strong public transportation connections [33, 50].
The sustainable transport factor can be quantified using a questionnaire form and compared to field survey requirements for the study area, as well as the population's opinions. Based on the following factors [35].
• Pedestrian Realm 10%
• Cycling 25%
• Public Transport 20%
• Private transport 45%
6.2.2 Accessibility
Accessibility refers to the ability to meet demands through numerous means and is an essential measure of distance and correlation between uses. The ease of entry facilitates the convergence of residents in green spaces and recreational areas [36]. It refers to the ability to walk to public places and services in short distances, as long as the uses are diversified and mixed [37, 38]. Residents who live near green spaces report higher subjective well-being and stronger social relationships among themselves [39].
This index is based on the ability of 100% of the population to access various services in the area according to the following criteria [40, 41]:
• The nearest green or recreational area within a maximum distance of 400 m.
• Ease of access to educational services standard: Within a distance of arrival of a radius of 400 m.
• Standard for easy access to health services: Within a distance of arrival of a radius of 800 m.
• Ease of access to commercial services standard: Within a distance of arrival of a radius of 600 m.
6.3 Social interaction and mix
Man must engage in social interaction and communicate with others around him in order to survive. Without him, he will be cut off from his culture, his surroundings, and everything else. Social interaction serves as the foundation for the establishment and growth of residential groups, as well as the formation of individual and group relationships. The built environment facilitates social contact, as a specific residential environment can create space for strong social relationships among its occupants, the social factor is an important factor in achieving sustainable urban housing in residential neighborhoods, By achieving communication, participation, and enhancing opportunities for meeting between, population and thus contributes to creating a sustainable urban environment [9, 42].
The social mix and mixed use are inextricably linked since they both contribute to increasing social contact and coherence among different social classes, as well as bringing additional services to the neighborhood and making them easily accessible. It can be tested by conducting a field survey and learning about the community's opinions through a questionnaire form, with a criteria of 50% indicating a high percentage of social interaction among the population [43, 44].
6.4 High density
Density is a key sustainability trend and component in sustainable urban housing. High density has an impact on the urban environment by promoting efficient land use and increased social interaction among residents. The major purpose and vision of high density is to focus on people, their activities, and the events that the population need, as well as to make them easily accessible within walking distance [45]. The high density factor can be quantified using two indicators, namely population and housing density (net and total), as shown below:
6.4.1 Population density (Net and total)
It is a typical indicator used in home planning and land use studies to determine the average population in a given geographic area. The net population density is the population divided by the residential area. The total population is calculated by dividing the population by the total area of the area, which includes public services and connected routes [46]. Special criteria have been specified for the indicator of net population density, which varies from 140 to 250 persons per hectare, whereas the total spans from 80 to 200 [47].
6.4.2 Housing density (Net and total)
One of the most important indicators used in urban planning and housing research is net density, which is the number of dwellings divided by the housing area, whereas total density is calculated by dividing the number of houses by total area. Previous study [47] and new urbanites in America defined the net housing density index with a standard of 15 to 50 housing units per hectare, whereas the total varies from 30 to 40 [48, 49].
This research relied on a review of a number of previous literature that dealt with the concepts of sustainability and urban housing, with a focus on the factors of sustainable urban housing. Through this review, it was possible to reach a number of effective indicators for sustainable urban housing that can be applied in the urban context of Iraqi cities. Some of these indicators depend on mathematical equations and geographic information system maps to be measured, while other indicators depend on field surveys and questionnaire forms. Some information was also obtained from the Directorate of Municipality and Urban Planning in the city of Najaf. The borders of the Hindiyah neighborhood in the city of Najaf represent the spatial boundaries of the research, and the borders extend from (1/12/2024- 12/3/2024). See Figure 2.
Figure 2. Research methodology
Source: Researchers
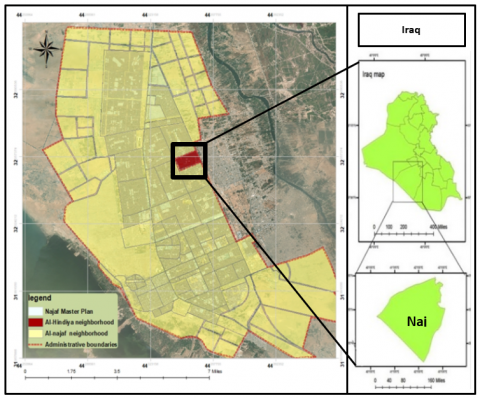
Al-Hindiya neighborhood is located in the northern sector of the city of Najaf, and in the northeast for the city center, as the city of Najaf is geographically located at the northeastern corner of the administrative region of the province of Najaf, at a distance of 160 km to the southwest of the capital Baghdad, to the southwest of the city of Hilla, south of Karbala, and to the west of the city of Diwaniyah. The Hindiya area was formed in 1984 for residential purposes. It is one of the new traditional communities. It was implemented by an Indian corporation, which is where it got its name. It is a community that spans 72.065 hectares and has a population of 8000 people. Indicators generated from the theoretical framework were used in the study area to determine their presence, match them with specific requirements, diagnose them, and fix their problems in order to achieve sustainable urban housing that meets sustainability goals. As seen in Figures 3 and 4.
Figure 3. The location of the study area (Al-Hindiya neighborhood) in the city of Najaf
Source: Researchers based on the Arc Gis [50]
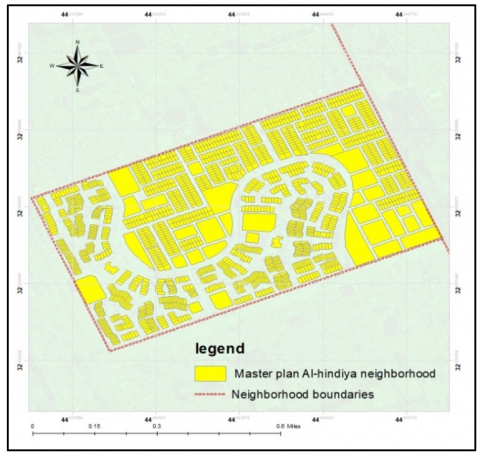
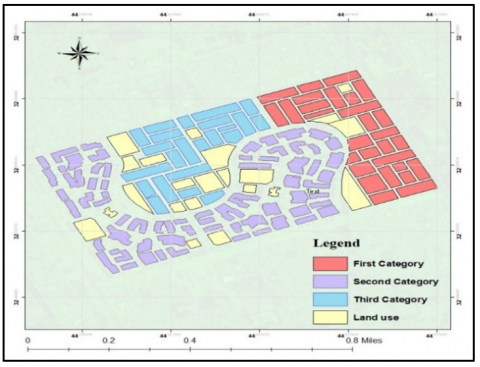
Figure 4. The borders and layout of the foundation of Al-Hindiya neighborhood in Najaf
Source: Researchers based on the Arc Gis [51]
The data used in the practical framework of the study were collected from the relevant government agencies (the Directorate of Urban Planning in Najaf, the Directorate of Najaf Municipality, the Department of Statistics in Najaf) and the field survey carried out by the researcher, as well as the use of the Geographic Information Systems (Arc Gis) program. To measure indicators of sustainable urban housing in the Al-Hindiya residential neighborhood.
9.1 Diversity
This factor can be measured through two indicators: horizontal mixed land use and diversity of housing areas. This study benefits from the GIS program to calculate the area of land uses and know the percentage of diversity.
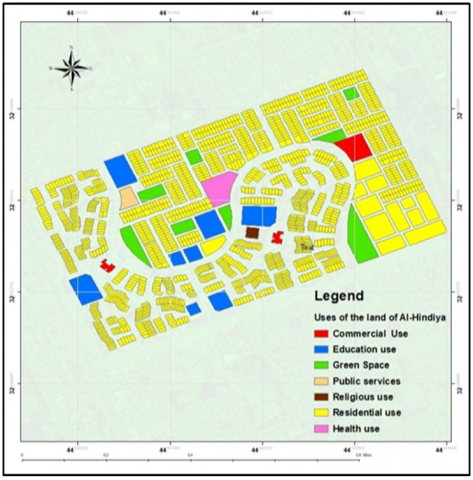
9.1.1 Horizontal mixed land use index
Mixed use has a great impact in encouraging people to bond with each other and meet their daily needs and achieve their cultural and social desires. The mixing index was calculated by applying the entropy equation, which ranges between 0-1, as the value (0) expresses the dominance of one use over other uses, and the value (1) expresses the presence of mixing at its optimal value. The percentage of the horizontal mixed use index in the study area was average, reaching (0.54), which is a good indicator that serves the basic needs of the population. as it indicates an average proportion, to establish a sustainable urban environment, it is vital to improve the mixed use index by diversifying land uses. As in Table 1 and Figure 5.
Entropy index $=-\left[\sum_{\mathrm{i}}^{\mathrm{k}} \mathrm{pi} \ln (\mathrm{pi})\right] / \ln (\mathrm{k})$
Ent =-[(0.506* In0.506)+ (0.0128*In0.0128) +(0.04708 *In0.04708) + (0.00468* In0.00468)+ (0.01264 * In0.01264) + (0.00222 * In0.00222) + (0.0409 * In0.0409) + (0.36111 * In0.36111)] / In(8) =0.54
where, (Ent) represents the number of land uses, (pi) represents the percentage of each use (area of each use (ha) /total area × 100%), (i) the category of each use is equal to 1, (k) the number of types of uses.
The value of this indicator ranges between (0) - (1), where the value (1) is the ideal value for the diversity of uses in the neighborhood, and the value (0) expresses the dominance of one use in the neighborhood.
Figure 5. Horizontal mixed lnd uses
Source: Researchers based on Arc Gis [52]
Table 1. The percentage of horizontal mixed land use index
|
Land Use |
Area (ha) |
Percentage % |
Mixed Land Use Index Value |
Standards |
Analysis |
|
Residential |
36:46 |
50.65 |
0.54 |
0-1 |
Conforms to the standard in an average percentage in Al-Hindiya neighborhod in Najaf |
|
Commercial |
9.264. |
1.286 |
|||
|
Green Spaces |
3.390 |
4.708 |
|||
|
Publics Services |
3.373 |
0.468 |
|||
|
Health |
9.103 |
1.264 |
|||
|
Religion |
0.1599 |
0.222 |
|||
|
Educational |
2.9453 |
4.090 |
|||
|
Roads |
26.060 |
36.111 |
|||
|
Total |
72.065 |
|
|||
Source: Researcher
9.1.2 Diversity of housing area index
The existence of housing types suitable for the various social classes of the population accomplishes the goals of sustainable urban housing, as evaluated by the Simpson coefficient, which ranges from 0 to 1. The value of 1 indicates that there is ideal diversity in dwelling kinds, whereas 0 indicates that there is just one type.
Simpson index $=1-\sum(\mathrm{Ai} / \mathrm{An})^2$
where, Ai: Number of each residential category, An: The total number of all residential categories, The value of this indicator ranges between (0) - (1).
$\begin{aligned} \text { S housing }=1 & -\left[(226 / 800)^2+(350 / 800)^2+(224 / 800)^2\right] \\ & =1-[0.0798+0.1914+0.0784]=0.65\end{aligned}$
It was discovered with the results of the field survey of the study area and the reliance on digital data, which includes three categories according to the areas of excretion in the Hindiya residential neighborhood (200, 250, 300), that the value of the Simpson coefficient was (0.65), which is a good indicator because it serves the needs of the population in various categories and classes. As in Table 2 and Figure 6 as follows.
Figure 6. The types of residential units in Al-Hindiya neighborhood
Source: Researcher based on Arc Gis
Table 2. The value of the housing area diversity index
|
The Dimension |
Indicator |
Studied Neighborhoods |
Category |
Area m2 |
Number Units |
Percentage |
Diversity Index |
Standards |
Analysis |
|
Veridian Dynamics. Diversity |
Diversity of Housing Area |
Al-Hindiya District |
First Category |
200 |
226 |
28.25% |
0.65 |
0-1 |
By comparing the reality of the situation with the criterion, it was found that the diversity index |
|
Second Category |
250 |
350 |
37.5 % |
||||||
|
Third Category |
300 |
224 |
22.5 % |
||||||
|
Total |
800 |
100% |
|||||||
Source: Researcher
9.2 Sustainable transport factor
The study addressed the sustainable transport factor using the following metrics, which contribute to the creation of an integrated and multi-option transportation system that achieves sustainability. Each indication contains a number of sub-indicators, as follows:
9.2.1 Multiple modes of transportation
The transport multiplicity index is calculated using three secondary measures: pedestrians, bicycles, and public and private transport. The field assessment of the research region reveals that there is no diversity in travel patterns because there are no actual public transport stations or other requirements to meet the public transport index in the Hindiya neighborhood.
The movement of people and cyclists was measured using a questionnaire, then analyzed and compared to the standard. The results showed that the indicator of pedestrian and bicycle mobility was achieved in good proportions, which is comparable with the standard, as well as the inadequacy of public transportation and the lack of stations. This is illustrated in Table 3.
9.2.2 Accessibility
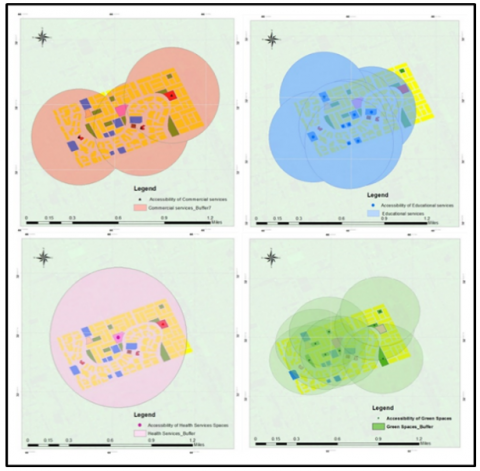
Criteria have been developed to determine the most appropriate amount to measure the index of accessibility to basic services within the neighborhood. The measurement of the indicator depends on the ability of 100% of the population to access services. Through comparison with the standard, it was found that there is a high degree of accessibility within the neighborhood as a result of the availability of safety for pedestrians and the proximity of services to each other. The results showed that ease of access has been achieved to a large degree, and thus it contributes to achieving the objectives of the study and creating a sustainable urban environment. As seen in Table 4 and Figure 7.
Figure 7. The distances of accessibility to recreational, educational, commercial and health services
Source: Researchers based on Arc Gis
Table 3. The value of the multiplicity of transport patterns index
|
Worker |
Indicator |
Forms of Transportation |
Standards |
Receiving Area |
Analysis |
|
Sustainable Transportation Factor |
Multitude, Pluralism, Plurality Transport Patterns |
Pedestrian realm |
10% |
50% |
Completed |
|
The cycling thing |
25% |
20 % |
Completed |
||
|
Public transportation |
20% |
10% |
Unverified |
||
|
Private transportation |
45% |
20% |
Unverified |
Source: Researchers
Table 4. The extent to which the accessibility index has been achieved
|
Worker |
Indicator |
Forms of Transportation |
Standards |
Receiving Area |
Analysis |
|
Sustainable Transport Factor |
Accessibility |
Green spaces and areas |
400 m |
Buffer |
Completed |
|
Cultural educational services |
400 m |
Buffer |
Completed |
||
|
Heath services |
800 m |
Buffer |
Completed |
||
|
Merchant services |
600 m |
Buffer |
Completed |
Source: Researchers
9.3 Social interaction
It examines the possibility of social interactions within urban spaces in the study area. According to the questionnaire form and the field survey shown, it was found that the percentage of social interaction and participation among the population is identical to the standard, reaching 53%. which is a good percentage. Paying attention to human comfort, interactions with neighbors, and meeting and communicating with each other contributes to achieving the social goals of sustainable urban housing and thus creating a sustainable urban environment in residential neighborhoods.
9.4 High density
The density factor is one of the most important aspects in shaping the urban structure and achieving sustainability objectives, The high density factor is one of the most important goals of sustainable urban housing, because it achieves optimal use of land, reduces energy consumption and conserves resources, and the compactness resulting from high densities encourages social interaction in the study area. To compute this factor, two indicators, namely population and housing density, were extracted measured according to the accepted standards, which are as follows:
9.4.1 Net and total population density
The research of the study region revealed that the net population density was 222 people per hectare. The total density reached 111 persons per hectare, which is similar to the standard because of the high population concentration and the proximity of services to each other.
9.4.2 Net and total housing density
The net housing density was a fair value, at 22 dwelling units per hectare. The total number of dwelling units per hectare was 11, which is lower than the minimum due to the residential neighborhood's green areas, outdoor gardens, and wide pedestrian pathways. As seen in Table 5.
Table 5. The high density in the study area
|
Worker |
Indicator |
Densitometers |
Standards |
Receiving Area |
Analysis |
|
High Density |
Population density |
Population density |
140-250 persons/ha |
222 persons/ha |
Completed |
|
Population density |
90-160 person/ha |
111 persons/ha |
Completed |
||
|
Density of dwellings |
Net housing density |
15-50 units/ha |
22 units/hectare |
Completed |
|
|
Total housing density |
30-40 units/ha |
11 units/hectare |
Unverified |
Source: Researchers
This research study conducted on the importance of analyzing and measuring indicators of sustainable urban housing and its role in achieving sustainability goals and establishing residential neighborhoods in which accessibility is achieved, and through the results of analysis, field survey, charts and maps, found that for the diversity factor, the value of the horizontal mixed land use index was 0.50, which is an average percentage compared to the standard due to the dominance. The housing area diversity indicator was determined to be extremely good, as the percentage of diversity in housing areas reached 0.73, which is a high percentage compared to the standard due to the presence of three types of housing areas. Regarding the factor of sustainable transport, with regard to the indicator of the multiplicity of transport patterns, it was clear through the field survey and questionnaire of the population and comparison with the criterion that the study area varies in transport options, but the use of public transport is very low due to the lack of public transportation stations close to the neighborhood. Through the survey of the study area and based on the given criteria, it was discovered that the accessibility index is very good since the accessibility of the essential services were realized at a very high rate. With regard to the factor of interaction and social mix, and based on the criteria and the field survey of the study area, it was found that the community participation index and the interaction of the population among them was achieved at a good rate, because the availability of mixed uses, accessibility and interest in the movement of pedestrians helps to enhance community interaction and participation and the interaction of the population among them. In terms of the density factor, the results of the analysis and field survey revealed that the value of the population density index and housing density is good and commensurate with the criterion as a result of population concentration and service location from one another. The investigation revealed that the Hindiya neighborhood has planning and housing characteristics that accomplish some of the aims of sustainability and sustainable urban dwelling. Based on the results, it can be said that the study area is characterized by a number of good characteristics that qualify it to be a sustainable urban environment. Also, some indicators that achieved low results can be addressed using planning methods in a phased manner to provide sustainable housing for their residents. As seen in Table 6.
Table 6. The final results of calculating the values of the indicators and the method of measurement according to the proposed methodology for the study area (Al-Hindiya neighborhood)
|
The Dimension |
Indicator |
Methods of Measurement |
Standards |
Case |
Analysis |
|
|
Veridian Dynamics. Diversity. |
Horizontal mixed use |
Entropy index |
0-1 |
0.50 |
Comparing the actuality of the situation to the standard, it was discovered that the value of the indicator matches the standard by an average percentage. |
|
|
Diversity of housing area |
- [Chewing loudly] – Simpson |
0-1 |
0.73 |
This proportion is good when compared to the standard, indicating the availability of various sorts of population places for all community classes. |
||
|
Sustainable Transportation |
Multitude, pluralism, plurality styles transportation |
Pedestrian realm |
Criterion mostadam |
10% |
50% |
The proportion of the indicator is high compared to the standard, indicating that services are close to one other and may be accessed by foot. |
|
The cycling thing. |
25% |
20% |
By comparing the actuality of the situation to the standard, it was discovered that the proportion is similar. |
|||
|
Public transportation |
20% |
10% |
The field survey revealed that there are no public transportation terminals serving all people in the neighborhood. |
|||
|
Private transportation |
45% |
20% |
The field survey revealed that the usage of private vehicles is very low due to the accessibility of maternity services and the absence of necessity for private mobility within the area. |
|||
|
Accessibility |
Grean areas |
Criterion mostadam |
400 m |
Completed |
Through the (Buffer) drawing use of the (Arc Gis) program and, it was found that the indicator was achieved and the population's ability to access services was achieved by 100%. |
|
|
Cultural educational services |
400 m |
Completed |
||||
|
Health services |
800 m |
Completed |
||||
|
Merchant services |
600 m |
Completed |
||||
|
High Density |
Population density |
Net population density |
Population, residential area, total area urban housing standard |
140-250 persons/hectare |
222 |
Comparing the reality of the situation with the standard revealed that population density index is achieved at a good rate and adheres to the criterion. |
|
Total population density |
90-160 person/hectar |
111 |
||||
|
Density of dwellings |
Net residential density |
Number of residences /residential area, total area urban housing Standard |
15-50 units/hectar |
22 |
By examining the study area and comparing it to the reality of the situation, it was determined that the net housing density index is attained by a little percentage and is not realized for the total housing density because of the presence of numerous unutilized regions. |
|
|
Total residential density |
30-40 units/hectar |
11 |
||||
|
Interaction Social |
Community engagement and population interaction |
Questionnaire form and specific criterion |
50% |
53% |
The study's findings, when compared to the reality of the situation, revealed that the index of community engagement and interaction was met at the same rate as the benchmark, which is a good percentage. |
|
Source: Prepared by the researchers
Based on the findings, it is possible to conclude that the derived indicators can be used as tools in urban planning to improve the quality of residential neighborhoods well as the trend toward sustainable urban housing that meets the population's needs and desires while also improving the quality of social and material life. The study identified some weaknesses in the study area that must be addressed, such as encouraging mixed use and converting some residential uses to commercial or administrative uses that serve and meet the needs of the population, as well as reducing empty spaces in the neighborhood to achieve the residential density factor. Providing public transportation terminals and promoting pedestrian circulation through the installation of walkways and medians,to encourage people to walk. The study area needs a number of planning treatments to enhance sustainability, including: Encouraging horizontal mixed use of land by replacing residential use with a variety of other purposes. The Hindiya neighbourhood must have a variety of mixed-use developments (residential, commercial, and recreational) that contribute to increasing quality of life and urban sustainability. Humanitarian interactions and social activities should be encouraged. This study constitutes one of the contributions towards the transformation of the study area in particular and the city of Najaf in general towards sustainability, while providing housing for the most needy groups. It also opens up research horizons to measure indicators of sustainable urban housing in other neighborhoods of the city of Najaf, to identify the deficiencies and weaknesses that the housing sector suffers from in this city. Based on the results of this study, it is possible to delve into examining the relationship between indicators of sustainable urban housing and the sense of place, while identifying effective indicators for this. The impact of sustainable urban housing indicators on the urban form of the city or its revitalization can also be studied.
[1] Ebrahimpour-Masoumi, H. (2014). Neo-traditional neighbourhood design concepts based on the urban form of the historical cities of central Iran. International Journal of Sustainable Society, 6(3): 264-286. https://doi.org/10.1504/IJSSOC.2014.065856
[2] Han, S.W. (2015). Neo-traditional town centers and residential travel behavior: Effect of retail composition. Undergraduate Honors Theses, Program in Environmental Design, University of Colorado at Boulder.
[3] Winston, N. (2014). Sustainable communities? A comparative perspective on urban housing in the European Union. European Planning Studies, 22(7): 1384-1406. https://doi.org/10.1080/09654313.2013.788612
[4] Shama, Z.S., Motlak, J.B. (2019). Indicators for Sustainable housing. In IOP Conference Series: Materials Science and Engineering, 518(2): 022009. https://doi.org/10.1088/1757-899X/518/2/022009
[5] Adamec, J., Janoušková, S., Hák, T. (2021). How to measure sustainable housing: A proposal for an indicator-based assessment tool. Sustainability, 13(3): 1152. https://doi.org/10.3390/su13031152
[6] Pakir, A.H.K., Tabassi, A.A., Ramli, M., Bakar, A.H.A., Roufechaei, K.M. (2012). Sustainable housing development and leadership: A review. Australian Journal of Basic and Applied Sciences, 6(12): 385-395.
[7] Choguill, C.L. (2007). The search for policies to support sustainable housing. Habitat International, 31(1): 143-149. https://doi.org/10.1016/j.habitatint.2006.12.001
[8] Marjan, R. (2013). Concepts and applications of sustainable planning and design in housing. Planning and Development Journal, 2013(27). https://search.emarefa.net/detail/BIM-377087
[9] Fatourehchi, D., Zarghami, E. (2020). Social sustainability assessment framework for managing sustainable construction in residential buildings. Journal of Building Engineering, 32: 101761. https://doi.org/10.1016/j.jobe.2020.101761
[10] Safronova, N., Nezhnikova, E., Kolhidov, A. (2017). Sustainable housing development in conditions of changing living environment. In MATEC Web of Conferences, 106: 08024. https://doi.org/10.1051/matecconf/201710608024
[11] Singh, V.S., Pandey, D.N. (2012). Sustainable housing: Balancing environment with urban growth in India. RSPCB Occasional Paper, 6: 17.
[12] Priemus, H. (2005). How to make housing sustainable? The Dutch experience. Environment and Planning B: Planning and Design, 32(1): 5-19. https://doi.org/10.1068/b3050
[13] Jiboye, A.D. (2011). Achieving sustainable housing development in Nigeria: A critical challenge to governance. International Journal of Humanities and Social Science, 1(9): 121-127.
[14] Darko, A., Chan, A.P.C., Owusu, E.K. (2018). What are the green technologies for sustainable housing development? An empirical study in Ghana. Business Strategy & Development, 1(2): 140-153. https://doi.org/10.1002/bsd2.18
[15] Prochorskaite, A., Couch, C., Malys, N., Maliene, V. (2016). Housing stakeholder preferences for the “Soft” features of sustainable and healthy housing design in the UK. International Journal of Environmental Research and Public Health, 13(1): 111. https://doi.org/10.3390/ijerph13010111
[16] Chen, Q., Glicksman, L., Lin, J., Scott, A. (2007). Sustainable urban housing in China. Journal of Harbin Institute of Technology (New Series), 14: 6-9.
[17] Alrobaee, T. (2021). Measuring spatial justice indices in the traditional Islamic cities by using GIS, An-Najaf Holy City, Iraq: A case study. Journal of Applssied Science and Technology Trends, 2(2): 99-105. https://doi.org/10.38094/jgier1220
[18] Hoppenbrouwer, E., Louw, E. (2005). Mixed-use development: Theory and practice in Amsterdam's Eastern Docklands. European Planning Studies, 13(7): 967-983. https://doi.org/10.1080/09654310500242048
[19] Smets, P., van Lindert, P. (2016). Sustainable housing and the urban poor. International Journal of Urban Sustainable Development, 8(1): 1-9. https://doi.org/10.1080/19463138.2016.1168825
[20] Al-Jawari, S.M. (2020). Regional development prospects for sustainable urbanization. Case study--Qalaat salih in Iraq. Journal of Settlements & Spatial Planning, 11(2): 57-66. https://doi.org/10.24193/JSSP.2020.2.01
[21] Jabareen, Y.R. (2006). Sustainable urban forms: Their typologies, models, and concepts. Journal of Planning Education and Research, 26(1): 38-52. https://doi.org/10.1177/0739456X05285119
[22] Song, Y., Knaap, G.J. (2004). Measuring the effects of mixed land uses on housing values. Regional Science and Urban Economics, 34(6): 663-680. https://doi.org/10.1016/j.regsciurbeco.2004.02.003
[23] Rose, D., Harrison, E. (2007). The European socio-economic classification: A new social class schema for comparative European research. European Societies, 9(3): 459-490. https://doi.org/10.1080/14616690701336518
[24] Alrobaee, T.R., Al-Kinani, A.S. (2019). Place dependence as the physical environment role function in the place attachment. In IOP Conference Series: Materials Science and Engineering, 698(3): 033014. https://doi.org/10.1088/1757-899X/698/3/033014
[25] De Castro Mazarro, A., George Kaliaden, R., Wende, W., Egermann, M. (2023). Beyond urban ecomodernism: How can degrowth-aligned spatial practices enhance urban sustainability transformations. Urban Studies, 60(7): 1304-1315. https://doi.org/10.1177/00420980221148107
[26] Sudarwani, M.M., Pasaribu, R.P., Eni, S.P., Widati, G. (2023). The architectural character of Chinese houses in the chinatown in Semarang, Indonesia. Journal of the International Society for the Study of Vernacular Settlements, 10(2): 16-32. http://repository.uki.ac.id/id/eprint/10868
[27] Clercq, F.L., Bertolini, L. (2003). Achieving sustainable accessibility: An evaluation of policy measures in the Amsterdam area. Built Environment, 29(1): 36-47. https://doi.org/10.2148/benv.29.1.36.53949
[28] Elkin, T., McLaren, D., Hillman, M. (1991). Reviving the City: Towards Sustainable Urban Development. Friends of the Earth, London, UK,.
[29] Chatziioannou, I., Nikitas, A., Tzouras, P.G., Bakogiannis, E., Alvarez-Icaza, L., Chias-Becerril, L., Karolemeas, S., Tsigdinos, S., Wallgren, P., Rexfelt, O. (2023). Ranking sustainable urban mobility indicators and their matching transport policies to support liveable city Futures: A MICMAC approach. Transportation Research Interdisciplinary Perspectives, 18: 100788. https://doi.org/10.1016/j.trip.2023.100788
[30] Zegras, P.C. (2005). Sustainable Urban Mobility: Exploring the Role of the Built Environment. Massachusetts Institute of Technology, USA.
[31] Khisty, J. (1994). Evaluation of pedestrian facilities: Beyond the level-of-service concept. TRID. https://trid.trb.org/View/413766.
[32] Red Deer. (2013). Governance, Policy Committee, “Neighbourhood Planning, Design Standards”, Alberta, Red Deer Canada.
[33] Ghafel, A.H., Al-Jawari, S.M. (2024). The role of road elements in providing a safe environment for pedestrians. In AIP Conference Proceedings, 3092(1): 060024. https://doi.org/10.1063/5.0199832
[34] Lumsdon, L. (2000). Transport and tourism: Cycle tourism–A model for sustainable development? Journal of Sustainable Tourism, 8(5): 361-377. https://doi.org/10.1080/09669580008667373
[35] KFH Group. (2009). Cuidelines-Design and Placement of Transit Stops. Washington Metropolitan Area Transit Authority, Maryland, USA.
[36] Rodrigue, J.P. (2020). The Geography of Transport Systems. Routledge. https://doi.org/10.4324/9780429346323
[37] Scannell, L., Gifford, R. (2017). The experienced psychological benefits of place attachment. Journal of Environmental Psychology, 51: 256-269. https://doi.org/10.1016/j.jenvp.2017.04.001
[38] Alrobaee, T., Al-Khafaji, A., Al-Jawari, S. (2021). Measurement of physical environment characteristics for supporting transit-oriented development areas for the Kufa city–Iraq. International Journal of Scientific & Engineering Research, 12(1): 635-642.
[39] Al-Jawari, S.M. (2020). Study for the informal settlement supposed to be distributed by the iraq government for poor people in Baghdad city-republic of Iraq. In IOP Conference Series: Earth and Environmental Science, 459(6): 062107. https://doi.org/10.1088/1755-1315/459/6/062107.
[40] Kimpton, A., Wickes, R., Corcoran, J. (2014). Greenspace and place attachment: Do greener suburbs lead to greater residential place attachment? Urban Policy and Research, 32(4): 477-497. https://doi.org/10.1080/08111146.2014.908769
[41] Johnstone, P. (2015). Health, equity and the north of England: A case study on a new approach. British Medical Bulletin, 116(1): 29-41. https://doi.org/10.1093/bmb/ldv048
[42] Urban and Rural Housing Standards in Iraq. (2018). Ministry of Construction, Housing, Municipalities and Public Works Department of Housing, University of Baghdad Planning Consultative Office.
[43] van den Berg, P., Timmermans, H. (2015). A multilevel path analysis of social networks and social interaction in the neighbourhood. Region, 2(1): 55-66. https://doi.org/10.18335/region.v2i1.32
[44] Dehghanmongabadi, A., Hoşkara, Ş.Ö., Shirkhanloo, N. (2014). Introduction to achieve sustainable neighborhoods. International Journal of Arts and Commerce, 3(9): 16-26.
[45] Al-Jawari, S.M., Kadhim, F.M., Albasri, N.A.R. (2024). Urban safety is a tool for containing slums to reach a sustainable urban structure. International Journal of Safety & Security Engineering, 14(1): 191-200. https://doi.org/10.18280/ijsse.140119
[46] Rudlin, D., Falk, N. (2010). Sustainable Urban Neighbourhood. Routledge. https://doi.org/10.4324/9780080939544
[47] Towers, G. (2005). An Introduction to Urban Housing Design: At Home in the City. Routledge. https://doi.org/10.4324/9780080454627
[48] Hasse, J., Lathrop, R.G. (2003). A housing-unit-level approach to characterizing residential sprawl. Photogrammetric Engineering & Remote Sensing, 69(9): 1021-1030. https://doi.org/10.14358/PERS.69.9.1021
[49] Winston, N., Pareja Eastaway, M. (2008). Sustainable housing in the urban context: International sustainable development indicator sets and housing. Social Indicators Research, 87: 211-221. https://doi.org/10.1007/s11205-007-9165-8
[50] Kadhim, S.H., Al-Jawari, S.M., Razak Hasach, N.A. (2024). Analyzing earth’s surface temperatures with relationship to land urban land cover (LULC) to enhance sustainability. International Journal of Sustainable Development & Planning, 19(1): 123-130. https://doi.org/10.18280/ijsdp.190110
[51] Residential Design Guide. (2014). Supplementary Planning Document. https://www.ashfield.gov.uk/media/8d850076b1a6e9e/residential-design-spd-nov-2014.pdf.
[52] Ministry of Planning, Central Bureau of Statistics, Najaf Statistics Directorate, 2023.