Sanusi*![]() | Shalleh Ahmad Bareduan
| Shalleh Ahmad Bareduan![]() | Larisang
| Larisang![]() | Abdul Hamid
| Abdul Hamid![]()
© 2024 The authors. This article is published by IIETA and is licensed under the CC BY 4.0 license (http://creativecommons.org/licenses/by/4.0/).
OPEN ACCESS
The demand for coconut is rising worldwide, and consumers are craving the quality of coconut, while coconut farmers are struggling to sell their coconut at a good price, it causes many farmers to leave their farmland due to supply chain issues. This study aims to ascertain the critical indicators that significantly impact the sustainability of the coconut supply chain. The study utilized an exploratory research approach by interviewing stakeholders using purposive sampling to ascertain the credibility and consistency of the indicators. Aiken's V and CVI were employed for validation purposes, and the intraclass correlation coefficient (ICC) was used for the reliability of the instruments. The assessment poll involved 15 professionals, including practitioners, regulators, academicians, and researchers, to determine critical indicators. The findings show that from 53 indicators identified, only 31 Indicators are critical, and the agreement coefficient Kendall's W is 0.718. The economic dimension has been identified as the most crucial factor using ANP, with a weightage of 60%, followed by the environmental at 21.76% and the social at 18.24%. In conclusion, achieving sustainability within the coconut supply chain necessitates a comprehensive approach encompassing economic, social, and environmental dimensions. This research focuses specifically on Indonesia's coconut supply chain and provides good insight for stakeholders in making decisions in the early stages.
sustainability, indicators, supply chain, analytical network process, coconut
A sustainable supply chain is a hot issue and attracts the attention of all the countries in the world because of regulations, consumer push, and the treatment of global problems [1]. The emergence of resilience is a significant engine of society, so from an international philosophical point of view, this concept implies the fulfilment of "the needs of the present without prejudice to future generations" [2, 3]. In 2015, Indonesia, together with 190 nations, pledged to support 17 Sustainable Development Goals (SDGs), as well as 169 objectives for an improved living of the succeeding generation tackling various global challenges, such as poverty, hunger, gender equality, clean water, climate action, and more. The resolution adopted aims to reform the planet and develop strategic efforts for the next fifteen years.
The implementation of the sustainable supply chain framework has already been applied in the manufacturing [4], automotive, oil and gas industries [5]; however, its application in the agricultural industry still needs to be given special attention [6]. Therefore, it attracts the attention of researchers, governments, and stakeholders to apply it in the agroindustry to know the level of sustainability of supply chains. Indicators of the supply chain sustainability level are varied [7]. Some studies provided indicators that are determined quantitatively [8-13] and also qualitatively.
Although previous researchers have used many supply chain indices in measuring the sustainability of supply chain [4, 14-17], this present study is an attempt to fill the gap in the literature and explore the proposed indicators to be used in determining the sustainability specifically for the coconut supply chain index using ANP model in Indonesia where the characteristic, culture, weather and politic atmosphere are different.
Coconut Cocos nucifera L. is a tree cultivated for its multiple utilities, mainly for its nutritional and medicinal values [18] and a palm tree plant belonging to the family Aceraceae. The coconut supply chain still needs attention and more research [19].
The previous studies were conducted using quantitative in investigating sustainability issues. However, this study was conducted using a qualitative approach, and the investigation finding was validated by five experts to determine the valid and reliable indicators. ANP model has some advantages compared to AHP [20, 21]. Supply chain sustainability is now recognized as a crucial aspect of responsible business management, and companies across industries are increasingly integrating sustainable practices into their supply chain operations to positively impact society, the environment, and their long-term success. The identified indicators could help stakeholders to perform an improvement and pay more attention to determined indicators in the future. It certainly strengthens the stakeholder's understanding and knowledge of the action taken for the sustainability of the coconut business in the future. The novelty of the study focuses on the coconut supply chain in developing country the integration of stakeholder perspectives to investigate the issues, expectations and applications to Indonesia's Coconut Industry, especially in the highest coconut producers in Indonesia.
The research focuses on the coconut supply chain in Indonesia, employs many analytical approaches, identifies crucial indicators, involves stakeholders, and has practical consequences for industry stakeholders makes it unique.
Sustainable supply chain (SSC) management is defined as the managerial approach that considers all three elements of sustainable development (environmental, social, and economic) to meet consumer and stakeholder expectations [22].
Indonesia is positioned at 75th place among a total of 169 countries worldwide and ranks 7th in East and South Asia in terms of its performance on the sustainability index [23].
In the Indragiri Hilir district is known as the largest contributor to coconut production was 83% in 2020, 80.21% in 2021, and 79.23% in 2022, with a decrease of 0.58% from 2021 to 2022 [24].
The monthly domestic market price for coconut (Rp/kg) for round coconut in January 2021 is Rp. 3731 per coconut fluctuated from February to November and in December it rose to Rp. 4,056. The coconut prices fluctuate from time to time [25].
2.1 Sustainability in agriculture supply chains
Sustainability in the agriculture supply chain has been discussed previously by some authors [8, 26-30]. It is a critical area of concern as agriculture plays a significant role in global environmental and social challenges. The agroindustry encompasses various agricultural products, including crops, livestock, and processed foods. Some key aspects and considerations related to sustainability in the agroindustry supply chain are sustainable farming practices, the responsible use of water, soil, and agricultural inputs, and implementing environmentally friendly practices such as crop rotation, conservation tillage, and integrated pest management. Responsible use of Agrochemicals, including proper use and management of agrochemicals, including pesticides and fertilizers, is vital for minimizing environmental impacts and ensuring the safety of agricultural workers and consumers. Energy efficiency, fair trade, social responsibility, ensuring fair wages, safe working conditions, and ethical treatment of workers in the agro-industry supply chain are fundamental aspects of sustainability. Fairtrade initiatives can help improve the livelihoods of small-scale farmers and workers.
At the same time, adopting circular economy principles in the agroindustry supply chain involves reducing waste, reusing by-products, and recycling. This is also critical to creating a more sustainable and resource-efficient system. The dimensions and measurements for sustainability vary from time to time. The change was caused by technology and regulation.
2.2 Analytical network process (ANP)
ANP is a multi-criteria decision-making (MCDM) method that extends the analytic hierarchy process (AHP) to handle complex decision-making problems involving interdependencies and feedback involving criteria and alternatives. Developed by Saaty [21], ANP provides a structured approach to evaluating and prioritizing alternatives based on multiple criteria or sub-criteria. In ANP, decision problems are represented using a network structure, including criteria, sub-criteria, alternatives, and the relationships between them. The network is constructed as a supermatrix, where each element represents pairwise comparisons of the criteria and alternatives, similar to the fundamental pairwise comparisons used in AHP [21]. ANP also can be combined with other methods to find the best decision, such as SWOT-ANP-ADAM [31], ANP and MAIRCA [32], ISM-ANP [33].
2.2.1 ANP model construction
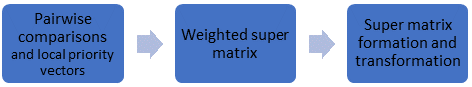
The ANP methodology consists of three main steps, shown in Figure 1.
Figure 1. ANP model construction
The supermatrix consists of some elements named $W i j$, in which each of these $W i j$ is derived from pairwise comparison and presents a matrix. The size of these matrices depends on the compared factors and sub-factors. For example, $W 11$, $W 12$, $W 21$, $W 22$ consist of three rows and three columns, whereas $W 14$, $W 24$ include three rows and two columns, or $W 43$ contains two rows and one column.
2.2.2 Consistency ratio
Pairwise comparisons are made for all combinations of relevant decision elements using the comparison scale. After the pairwise comparisons are in the judgment matrix A, an element represents the relative importance of the ith element to that of the jth element. The relative importance of a component can be expressed on a scale ranging from one to nine (Saaty’s scale). In the judgment matrix A, the reciprocal of the element aij is the element aij. To evaluate the weights of the elements, the principal eigenvector W of the judgment matrix A is calculated:
$\mathrm{AW}=\lambda_{\max } W$ (1)
where, λmax is the principal eigenvalue of A. By solving the equation, the weight vector w can be obtained and expressed:
$\mathrm{W}=\left(w_I w_2 \ldots w_n\right)^{\mathrm{T}}$ (2)
When all aij = 1/aij and aik x akj = aij for all i, j = 1,..., n, a judgment matrix A can be regardless of being consistent, subjective opinions can distort a pairwise comparison, so a judgment matrix A should be verified using the consistency ratio (CR). The CR is expressed by the consistency index (CI) and random index (RI):
$C R=\frac{C I}{R I}$ (3)
The CR of a pairwise comparison matrix is the CI's ratio to the corresponding RI value with range 0–1.45. The CI of a matrix can be expressed as:
$C I=\frac{(\lambda \max -n)}{(n-1)}$ (4)
The CI for a judgment matrix can be computed as a function of its maximum eigenvalue λmax and the order n of the matrix. The judgment matrix is reliable if the CR value is smaller than 0.1. However, when the CR value is more extensive than 0.1, the judgment matrix's result is viewed as unreliable, and the judgment matrix must be revised [20, 21].
2.2.3 Geometric mean
The geometric mean of all respondents' responses is calculated to build a scientific consensus result. Below is the formula of Saaty's geometric mean:
$\left(\prod_i^n=1 a_i\right)^{1 / n}=\sqrt[n]{a_1 a_1 a_1 \ldots \ldots a_1}$ (5)
2.2.4 The Kendall coefficient of concordance
The Kendall coefficient of concordance was introduced to assess the agreement level between respondents for the study. The Kendall coefficient of concordance (τ) is a measurement agreement among rankings. The range of the concordance coefficient is from 0-1. One shows a perfect agreement, and zero indicates no agreement. Constructing the ANP model is a mixed-method approach to build a schematic that outlines the overall flow of the proposed ANP framework used in this study. The ANP construction step required a data-gathering method to answer the research questions by designing the criteria and sub-criteria of the ANP network and determining pairwise comparisons questionnaire among the respondents.
$W=\frac{12 S}{m^2\left(n^3-n\right)}$ (6)
where, S is the sum of squared deviations, m is the number of judges (raters), n is the total number of objects being ranked.
This section describes the multi-methodological approach followed to fulfil the research goals, starting from face-to-face interviews with stakeholders and a literature review through qualitative content analysis before instrument validation by five experts. The ANP pairwise comparison survey was obtained by soliciting expert opinions to determine the weighting elements for decision-making. Gladwell [34] suggests that experts in a field are a heterogeneous group with around 10,000 hours of practice. The mixed approach is a process employed to develop tools or indexes that are more efficient and specifically customized to the given environment. According to Creswell [35], the suggested range for the number of interviews in phenomenology research is between five and 15. Morse [36] recommended a minimum of 6 interviews.
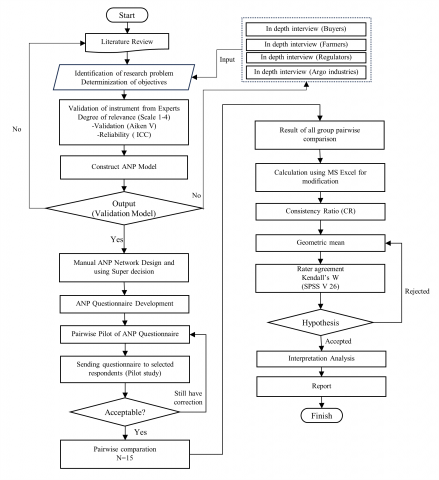
The technique of determining respondents in order to dig up information and expert knowledge (opinion acquisition) is an expert judgment method using purposive sampling. Basic consideration of determination to be used as respondents using criteria: 1) existence, and the willingness of respondents to be interviewed and fill up the questionnaires, 2) has a reputation position and has shown his credibility as an expert in the field researched, 3) has the experience and knowledgeable in the field, and 4) has more than five years in the field. The 15 professionals were seven researchers and academicians, three regulators and five practitioners. The details of the methodology are summarized in Figure 2.
The study procedure was structured according to the multiphase research methodology. Figure 2 displays the research procedure in a multiphase structure, illustrating the various processes involved in the research process. The study deployed a multiphase research strategy to produce a sustainable supply chain index as its primary focus. This process facilitates the integration of qualitative and quantitative data gathering and analysis in order to achieve the study objective.
3.1 Analytic network process (ANP)
The analytic network process (ANP) is used as a data processing instrument to obtain criteria or sub-criteria weight values and index performance calculation.
The stages of data processing with the ANP method involve contracting the model manually and designing super decisions, developing an ANP pairwise comparisons questionnaire, performing a pilot test on eight respondents, revising the questionnaire, and performing a pairwise ANP survey by distributing and communicating the questionnaire to 15 selected respondents (researchers and academician, regulators, practitioners) to determine critical indicators affecting the performance of agroindustry coconut supply chains of coconut the next stage involves calculating the consistency ratio (CR), the geometric mean, and the rater agreement using SPSS V 26 to find the Kendal W and inter-rater reliability. The last process is analyzing the critical factors and determining the related weightage for the decision-making process.
Operationally, a sustainable supply chain is complex due to the involvement of stakeholders, and activities usually have their requirements. In this research, the process of determining supply chain sustainability indicators is based on expert judgment and a search of relevant literature. The results of the literature search are discussed with some experts who can understand agribusiness processes and supply chains. This study's sustainability aspect includes economic, social, and environmental issues. Following [20] rules, the allowable consistency ratio should be only about 0.10 (10%). Consistency checks must be conducted to ensure the consistency of experts' judgments, and the CR values were obtained from the judgment comparison. The CR matrix is divided into three groups of experts, namely academicians, researchers, practitioners, and regulators.
Figure 2. The flowchart of the research
The study commenced by identifying the indicators that impact the performance of the coconut supply chain in the agroindustry. This was done through a review of relevant literature and conducting in-depth interviews with stakeholders in the coconut supply chain. The purpose of these interviews was to analyze the requirements of all parties involved in the system and identify the crucial indicators for developing a sustainable supply chain index. From the stakeholder's input, the next process was sending the indicators’ questionnaire to five validators and conducting validation of instruments using Aiken V and content validity index (CVI) before performing intraclass correlation coefficient (ICC) for the reliability process. In this process, all the valid and reliable items or indicators are accepted; on the other hand, invalid items or indicators are removed. The purpose of this phase is to analyse the responses to the research questions posed in the previous chapter on the process of integrating the judgement findings and validating the index generated from the ANP pairwise comparison approach. A pilot test was administered to eight participants prior to the evaluation of the questionnaire by 15 experienced and certified respondents. After completing the pairwise comparisons, the identified indicators were used to construct the index. The next step involved calculating the consistency ratio (CR), geometric mean, and rater agreement's W Kendall using statistical package for the social sciences (SPSS) version 25. The ANP-derived indicators and weights are used to quantify the level of supply chain sustainability.
The determination of critical success factors to be implemented for coconut supply chain sustainability was started with the identification of current conditions through interviews with selected respondents. The study starts by identifying indicators affecting coconut (agroindustry) supply chain performance from literature combined with in-depth interview techniques with 17 coconut supply chain stakeholders to analyze the needs of all related parties. Impotent indicators obtained were used to build a sustainable supply chain model, while the identified indicators were sent to five experts for validation purposes. Aiken's V and CVI were implemented to validate the proposed indicators, and the intraclass correlation coefficient (ICC) was used as a reliability test. From 53 identified indicators, only 31 indicators were concluded as valid and reliable. The success of implementing a sustainable supply chain is determined by several interrelated factors, including economic, environmental, and social dimensions, which must be seriously considered in making decisions to carry out business activities in the future. The results showed that 62.26% of the indicators were deemed valid, while 37.74% were considered invalid. A total of 31 items will serve as study instruments, acting as proposed indicators to assess the sustainability of the coconut supply chain.
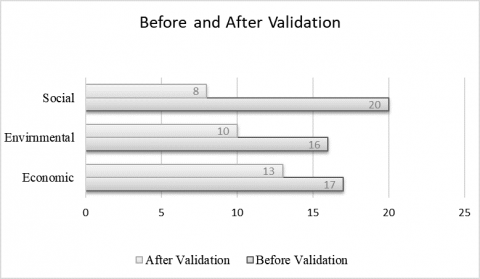
According to the invalid indications, the five validators' indexes are below 0.60 for Aiken V and at a moderate level (0.60) for CVI. It can be concluded from the value that an index greater than 0.60 is regarded as legitimate. Of the twenty-one indicators in total, 39.62% of them were given a score of four by all validators. This shows that the validators are in complete agreement about how important these indicators are.
Figure 3. Before and after validation
Figure 3 depicts the number of indicators before and after expert validation with Aiken's V. The number of social dimension indicators has decreased from 20 to 8, environmental dimension indicators from 16 to 10, and economic dimension indicators from 33 to 17.
With in-depth knowledge and experience in determining critical factors in decision-making, supply chain sustainability will be easier to achieve. Therefore, determining critical success factors is vital for all stakeholders and their involvement in determining the coconut supply chain. The stakeholders identified in this study are farmers, drop order (DO), government, buyers, and customers.
4.1 Rater agreement overall experts
Kendall's W (also known as Kendall's coefficient of concordance) is a non-parametric statistic for rank correlation. It can be used to assess agreement among raters, particularly inter-rater reliability. Kendall's W ranges from 0 (no agreement) to 1 (complete agreement). The data used for Kendall's rater agreement test is the limiting priority matrix since all data nodes have the same probability. The test results are shown in Table 1.
Table 1. The test statistic for overall experts
|
N |
15 |
|
Kendall's Wa |
0.718 |
|
Chi-Square |
452.56 |
|
df |
42 |
|
Asymp. Sig. |
0.000 |
N: Number of raters, Df: Degree of freedom, Sig: Significance.
It is demonstrated that Kendall's coefficient for the relationship among the experts is 0.718. Since the coefficient is close to 1, the relationship among the experts is indicated to have a high inter-rater agreement.
4.2 Rater agreement among groups
The rater agreements are also tested for groups of experts. This test has three groups: academicians and practitioners, researchers and regulators. Each group is given the same test, and the results are shown in Table 2.
Table 3 shows that the Kendall's W test results for all groups are above 0.6. These coefficients show that all the groups had relationships among the raters' scores. The result of Kendall's W test for the practitioner’s group is the highest. If the test shown that above 0.6 meaning all the respondents are agree with the section determined. When all the groups are agree with the result indicating that determined value can be used and considered representative for all stakeholders.
The practitioner group's highest coefficient indicates that there is especially great practitioner agreement with the scores given. The determined value is more dependable and representative for all stakeholders when all groups exhibit high levels of agreement (over 0.6), which denotes a high degree of consensus among respondents. This indicates that the study's findings are robust and that the calculated value is trustworthy enough to guide choices or draw conclusions that are pertinent to all stakeholders.
The economic dimension is the highest priority, followed by the environmental and social dimension, respectively.
The strategy requires determining future action for a strategic decision to achieve sustainability. The result of the ANP calculation using www.superdecisions.com is described in detail.
Table 3 shows the critical factors that affect stakeholders' decision-making in their future planning, requiring clear and concise direction. Each dimension has certain factors related to other dimensions. The higher the rank, the higher priority the factors in sustainable supply chain have. More detail is explained.
4.2.1 Economic dimension
Based on the analysis, it has been determined that the economic dimension of the coconut supply chain has the most tremendous significance, representing 60% of the overall sustainability factors. In order to establish a sustainable coconut supply chain, the research indicates that it is advisable to concentrate on economic aspects. The process entails the prioritization and execution of sustainable strategic decisions (53.66%) after tactical decisions (27.04%) are made, and finally, operational decisions (19.30%) are addressed. In order to achieve sustainable stability over an extended period, the supply chain must prioritize substantial investments in strategic decision-making and optimize the exploitation of resources while guaranteeing the accessibility of raw materials.
This dimension comprises several factors directly influencing the supply chain's financial aspects, beginning with strategic decisions such as investment and logistic costs. This study examines various factors that influence decision-making in both tactical and operational contexts within a supply chain. These factors encompass capacity utilization, overall profitability, revenue growth, the perceived value of the product, availability of raw materials, customer satisfaction rates, appropriate coconut prices, and utilization of information technologies that can improve sustainability production flexibility, inventory costs, operational costs, and production efficiency.
Although investment remains significant within strategic considerations, three fundamental variables warrant attention to ensure sustainability. These factors encompass customer satisfaction, perceived value of the product, and the utilization of information technologies. These elements substantially influence the attainment of a sustainable coconut supply chain compared to alternative approaches.
4.2.2 Environmental dimension
While the environmental dimension weighted 21.76 %, indicating slightly lower importance than the economic dimension, it remains a critical aspect of supply chain sustainability for the coconut industry. This dimension is concerned with the ecological impact of coconut production and processing, and addressing these environmental factors is vital for mitigating climate change, minimizing ecological damage, and ensuring the long-term availability of resources needed for coconut production.
Table 2. Test statistics among groups
|
Group |
N |
Kendall's W |
Chi-Square |
Degree of Freedom (df) |
Asymptotic Significance |
|
Experts (Academician and researchers) |
7 |
.696 |
204.62 |
42 |
.000 |
|
Regulators |
3 |
.816 |
102.86 |
42 |
.000 |
|
Practitioners |
5 |
.844 |
117.18 |
42 |
.000 |
N: Number of raters
Table 3. Local and global weight
|
Dimension |
Weight (%) |
Indicators |
Local Weight (%) |
Rank |
Global Weight (%) |
Rank |
|
1. ECONOMIC |
60 |
1.1 Strategy for Eco |
53.66 |
1 |
0.0559 |
- |
|
1.2 Tactical for Eco |
27.04 |
2 |
0.0241 |
- |
||
|
1.3 Operational for Eco |
19.30 |
3 |
0.0241 |
- |
||
|
1.1.1 Investment costs |
60.06 |
1 |
0.0309 |
6 |
||
|
1.1.2 Logistic cost |
39.94 |
2 |
0.0248 |
7 |
||
|
1.2.1 Capacity utilisation |
30.88 |
1 |
0.0248 |
8 |
||
|
1.2.2 Perceived value of the product |
26.89 |
3 |
0.0354 |
20 |
||
|
1.2.3.Improved overall profitability and revenue growth |
42.23 |
2 |
0.0313 |
23 |
||
|
1.3.1 Operational costs |
9.8 |
7.8 |
0.0137 |
22 |
||
|
1.3.2 Customer satisfaction rates |
17.59 |
2 |
0.0464 |
16 |
||
|
1.3.3 Production efficiency |
9.8 |
7.8 |
0.0308 |
27 |
||
|
1.3.4 Inventory costs |
9.14 |
6 |
0.0255 |
25 |
||
|
1.3.5 Production flexibility |
9.16 |
5 |
0.0222 |
24 |
||
|
1.3.6 Use of information technologies |
9.19 |
4 |
0.0349 |
21 |
||
|
1.3.7 Availability of raw material |
18.44 |
1 |
0.0071 |
19 |
||
|
1.3.8 Appropriate coconut price |
16.89 |
3 |
0.0128 |
18 |
||
|
2. ENVIRONMENTAL |
21.76 |
2.1 Strategy for Env |
38.39 |
1 |
0.0071 |
- |
|
2.2 Tactical for Env |
27.98 |
3 |
0.0066 |
- |
||
|
2.3 Operational for Env |
33.63 |
2 |
0.0066 |
- |
||
|
2.1.1 Innovation & improvement |
17.98 |
3 |
0.0067 |
15 |
||
|
2.1.2 Regulatory compliance |
30.98 |
2 |
0.0134 |
11 |
||
|
2.1.3 Environmental quality management |
33.06 |
1 |
0.0123 |
14 |
||
|
2.1.4 Selecting green modes of transportation |
17.98 |
3 |
0.0133 |
13 |
||
|
2.2.1 Resource utilisation |
51.42 |
1 |
0.023 |
10 |
||
|
2.2.2 Reverse logistic |
48.58 |
2 |
0.0245 |
9 |
||
|
2.3.1 Pollution emission reduction & waste recycling program |
19.14 |
3 |
0.0133 |
12 |
||
|
2.3.2 Applying renewable sources in production |
17.88 |
4 |
0.0374 |
3 |
||
|
2.3.3 Land availability |
31.49 |
1 |
0.0353 |
4 |
||
|
2.3.4 Fertilizer efficiency usage |
31.49 |
1 |
0.0139 |
17 |
||
|
3. SOCIAL |
18.24 |
3.1 Strategy for Soc |
44.05 |
1 |
0.013 |
- |
|
3.2 Tactical for Soc |
38.90 |
2 |
0.0229 |
- |
||
|
3.3 Operational for Soc |
17.05 |
3 |
0.0229 |
- |
||
|
3.1.1 Training rates |
43.66 |
2 |
0.0328 |
5 |
||
|
3.1.2 Adoption of safety practices |
56.34 |
1 |
0.0423 |
2 |
||
|
3.2.1 Customer retention |
35.09 |
2 |
0.026 |
26 |
||
|
3.2.2 Labor equity |
64.91 |
1 |
0.0482 |
1 |
||
|
3.3.1 Labor efficiency |
17.09 |
4 |
0.012 |
31 |
||
|
3.3.2 Child & forced labor avoidance |
32.71 |
2 |
0.023 |
28 |
||
|
3.3.3 Establish long-term partnerships with suppliers |
32.95 |
1 |
0.0231 |
29 |
||
|
3.3.4 Wage ratio |
17.26 |
3 |
0.0121 |
30 |
||
|
Eco: Economic; Env: Environmental; Soc: Social |
||||||
The environmental component encompasses several aspects that are taken into account when formulating strategies (38.39%), making tactical decisions (27.98%), and implementing operational decisions (33.63%). The total environmental sustainability of the coconut supply chain is contingent upon various strategic aspects, including but not limited to environmental quality management, regulatory compliance, innovation and improvement, and the deliberate use of green means of transportation. At the tactical level, it is imperative to prioritize certain variables, such as resource utilization and reverse logistics, to implement sustainable environmental practices effectively.
Operational decisions about environmental sustainability encompass various critical factors, such as the availability of land, the efficient utilization of fertilizers, the reduction of pollution emissions, the implementation of waste recycling programs, the utilization of renewable sources in production, and the optimization of processes.
Through the acknowledgement and mitigation of environmental issues, as well as the integration of sustainable methodologies, the coconut supply chain has the potential to significantly contribute towards the overarching objective of diminishing its ecological impact and cultivating a more sustainable and robust sector.
4.2.3 Social dimension
The social dimension, which holds a weight of 18.24% in the ANP analysis, is crucial in attaining sustainability within the coconut supply chain. The concept of social sustainability centres around enhancing the overall welfare and prosperity of individuals and communities participating in the supply chain. It assumes a critical role in the preservation of mutually beneficial connections among stakeholders, the prevention of social disputes, and the advancement of inclusive development. In the realm of the social dimension, a comprehensive analysis involves the consideration of several elements: strategic dimension weight (44.05%), tactical dimension weight (38.90%), and operational dimension weight (17.05%). Adopting safety measures (56.34%) exhibits a higher prevalence of strategy elements compared to the growth in training rates (43.66%). Employee training may improve sustainable performance.
The labour equity score (64.91%) surpasses the consumer retention score (35.09%) regarding tactical measures. The operational standards on establishing long-term partnerships with suppliers, the avoidance of child and forced labour, and the pay ratio account for 32.95%, 32.71%, and 17.26%, respectively, in terms of their significance in achieving supply chain sustainability. Labour efficiency is also considered as a factor in supply chain sustainability. Labour equity, safety practices, and training rates are crucial to social sustainability within the coconut supply chain. Failure to consider any of these elements can result in imbalances and enduring adverse ramifications for the sustainability of the coconut sector.
Therefore, adopting a comprehensive and interconnected strategy encompassing the economic, environmental, and social dimensions is imperative to attain genuine sustainability within the coconut supply chain. By strategically allocating resources and managing these various elements, the sector may actively strive toward an environmentally sustainable and socially responsible future.
The findings of the research will cause stakeholders to rethink their approach, which now calls for employing vital indicators to help them develop a sustainable strategy. Even if the economic component is larger than the environmental and social components, all the dimensions need to be taken into consideration.
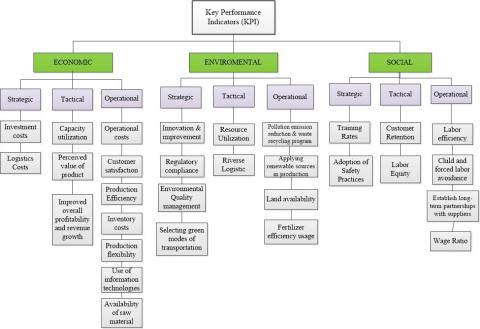
Figure 4. Coconut sustainable supply chain KPI
It is true that concentrating on key indicators can help achieve sustainability goals, guarantee that operations don't negatively affect the environment, and increase revenue. Businesses can more effectively connect their strategy and operations with sustainable practices, minimizing adverse environmental effects and possibly boosting efficiency and profitability, by recognizing and prioritizing these indicators. Long-term advantages for the business and the environment may result from this strategy.
Figure 4 depicts the hierarchy of sustainable supply chain key performance indicators (KPIs) for coconut, with detailed breakdowns of each dimension. The analysis reveals a structured approach to evaluating supply chain sustainability, with a focus on the social, environmental, and economic dimensions. A comprehensive approach to sustainability in the coconut supply chain, with each dimension thoroughly detailed to ensure a clear understanding of the key performance indicators required to achieve sustainable goals.
In summary, the research successfully identified and verified 31 indicators encompassing economic, environmental, and social aspects that are pivotal in attaining sustainability within the coconut supply chain. The study emphasized the significance of the economic dimension as the primary determinant, followed by environmental and social dimensions. The results emphasize the need for stakeholders within the coconut industry to make economic considerations a top priority while also integrating environmental and social factors into their methods of managing the supply chain.
It expected that by more focus and attention on economic dimension, the stakeholders can manage the critical indicators from beginning in order to optimize the system. Promoting sustainability in the coconut sector necessitates adopting a comprehensive and well-rounded approach. The study's findings significantly enhance our comprehension of the fundamental elements that promote sustainability within the coconut supply chain, thereby extending the applicability of these insights to the broader domain of supply chain management within the agroindustry. This research offers significant insights and indicators that can assist stakeholders in making well-informed decisions and executing initiatives that effectively promote sustainability. This study contributes to the discourse surrounding sustainability within supply chain management.
It also serves as a foundation for future investigations and the implementation of practical strategies within the coconut production sector and other agricultural fields. This research had to be limited due to time and resource restrictions. While the survey sample was adequate for the statistical analysis, a more insightful investigation of the relationships in SSCM could have been facilitated by a larger and more diverse sample of responses. Differences between location or sample size could have been evaluated which could have strengthened generalizability of findings and model applicability. As recommendations, further evaluation requires more surveys of stakeholders and statistical analysis; this research focused on the downstream supply chain (Farmers to Buyers).
This work is supported by Universiti Tun Hussein Onn Malaysia and Universitas Ibnu Sina for partially supporting and sponsoring the research.
|
W |
Kendall, non-parametric statistic for rank correlation |
|
CR |
Consistency Rasio |
|
N |
Number of experts |
|
Greek symbols |
|
|
a |
The level of significance |
|
λ |
A measure of association for nominal variables |
[1] Wu, Z., Mohammed, A., Harris, I. (2021). Food waste management in the catering industry: Enablers and interrelationships. Industrial Marketing Management, 94: 1-18. https://doi.org/10.1016/j.indmarman.2021.01.019
[2] Alzaman, C. (2014). Green supply chain modelling: Literature review. International Journal of Business Performance and Supply Chain Modelling, 6(1): 16-39. https://doi.org/10.1504/IJBPSCM.2014.058891
[3] Keeble, B.R. (1988). The brundtland report: ‘Our common future’. Medicine and War, 4(1): 17-25. https://doi.org/10.1080/07488008808408783
[4] Latif, H.H., Gopalakrishnan, B., Nimbarte, A., Currie, K. (2017). Sustainability index development for manufacturing industry. Sustainable Energy Technologies and Assessments, 24: 82-95. https://doi.org/10.1016/j.seta.2017.01.010
[5] Gardas, B.B., Raut, R.D., Narkhede, B. (2019). Determinants of sustainable supply chain management: A case study from the oil and gas supply chain. Sustainable Production and Consumption, 17: 241-253. https://doi.org/10.1016/j.spc.2018.11.005
[6] de Carvalho, M.I., Relvas, S., Barbosa-Povoa, A.P. (2022). A roadmap for sustainability performance assessment in the context of agri-food supply chain. Sustainable Production and Consumption, 34: 565-585. https://doi.org/10.1016/j.spc.2022.10.001
[7] Galli, A., Pires, S.M., Iha, K., Alves, A.A., Lin, D., Mancini, M.S., Teles, F. (2020). Sustainable food transition in Portugal: Assessing the footprint of dietary choices and gaps in national and local food policies. Science of the Total Environment, 749: 141307. https://doi.org/10.1016/j.scitotenv.2020.141307
[8] Jouzdani, J., Govindan, K. (2021). On the sustainable perishable food supply chain network design: A dairy products case to achieve sustainable development goals. Journal of Cleaner Production, 278: 123060. https://doi.org/10.1016/j.jclepro.2020.123060
[9] Pahlevan, S.M., Hosseini, S.M.S., Goli, A. (2021). Sustainable supply chain network design using products’ life cycle in the aluminum industry. Environmental Science and Pollution Research, 1-25. https://doi.org/10.1007/s11356-020-12150-8
[10] Gilani, H., Sahebi, H., Oliveira, F. (2020). Sustainable sugarcane-to-bioethanol supply chain network design: A robust possibilistic programming model. Applied Energy, 278: 115653. https://doi.org/10.1016/j.apenergy.2020.115653
[11] Gilani, H., Sahebi, H. (2021). A multi-objective robust optimization model to design sustainable sugarcane-to-biofuel supply network: The case of study. Biomass Conversion and Biorefinery, 11: 2521-2542. https://doi.org/10.1007/s13399-020-00639-8
[12] Isaloo, F., Paydar, M.M. (2020). Optimizing a robust bi-objective supply chain network considering environmental aspects: A case study in plastic injection industry. International Journal of Management Science and Engineering Management, 15(1): 26-38. https://doi.org/10.1080/17509653.2019.1592720
[13] Yun, Y., Chuluunsukh, A., Gen, M. (2020). Sustainable closed-loop supply chain design problem: A hybrid genetic algorithm approach. Mathematics, 8(1): 84. https://doi.org/10.3390/math8010084
[14] Jones, D. (2011). Dow Jones sustainability world indexes guide v. 7.0. https://sustentabilidad.uai.edu.ar/pdf/negocios/djsi/DJSI_World_Guidebook_91.pdf.
[15] Qorri, A., Mujkić, Z., Kraslawski, A. (2018). A conceptual framework for measuring sustainability performance of supply chains. Journal of Cleaner Production, 189: 570-584. https://doi.org/10.1016/j.jclepro.2018.04.073
[16] Singh, R.K., Murty, H.R., Gupta, S.K., Dikshit, A.K. (2007). Development of composite sustainability performance index for steel industry. Ecological Indicators, 7(3): 565-588. https://doi.org/10.1016/j.ecolind.2006.06.004
[17] Fercoq, A., Lamouri, S., Carbone, V. (2016). Lean/Green integration focused on waste reduction techniques. Journal of Cleaner production, 137: 567-578. https://doi.org/10.1016/j.jclepro.2016.07.107
[18] DebMandal, M., Mandal, S. (2011). Coconut (Cocos nucifera L.: Arecaceae): In health promotion and disease prevention. Asian Pacific Journal of Tropical Medicine, 4(3): 241-247. https://doi.org/10.1016/S1995-7645(11)60078-3
[19] Gunawan, I., Trihastuti, D., Mulyana, I.J. (2021). Sustainability issues of the coconut supply chain in Indonesia. In 2021 IEEE International Conference on Industrial Engineering and Engineering Management (IEEM), Singapore, Singapore, pp. 158-162. https://doi.org/10.1109/IEEM50564.2021.9672964
[20] Saaty, R.W. (1987). The analytic hierarchy process-What and how it is used. Mathematical Modelling, 9(3-5): 161-176. https://doi.org/10.1016/0270-0255(87)90473-8
[21] Saaty, T.L., Vargas, L.G. (2006). Decision Making with the Analytic Network Process. Berlin, Germany: Springer Science+ Business Media, LLC.
[22] Seuring, S., Müller, M. (2008). From a literature review to a conceptual framework for sustainable supply chain management. Journal of Cleaner Production, 16(15): 1699-1710. https://doi.org/10.1016/j.jclepro.2008.04.020
[23] Sustainable Development Report. (2023). https://dashboards.sdgindex.org/rankings.
[24] BPS - Statistics, “Production of Estate”. (2023). https://riau.bps.go.id/indicator/54/220/1/produksi-perkebunan.html.
[25] Zulfadli. (2022). Statistik perkebunan provinsi riau tahun 2021. https://ppid.riau.go.id/download/17/1701418165buku-statistik-perkebunan-riau-2021-oke_compressed.pdf.
[26] Yakovleva, N., Sarkis, J., Sloan, T.W. (2010). Sustainability indicators for the food supply chain. In Environmental Assessment and Management in the Food Industry, pp. 297-329. https://doi.org/10.1533/9780857090225.3.297
[27] Hendiani, S., Liao, H., Jabbour, C.J.C. (2022). A new sustainability indicator for supply chains: Theoretical and practical contribution towards sustainable operations. International Journal of Logistics Research and Applications, 25(4-5): 384-409. https://doi.org/10.1080/13675567.2020.1761308
[28] Hourneaux Jr, F., Gabriel, M.L.D.S., Gallardo-Vázquez, D.A. (2018). Triple bottom line and sustainable performance measurement in industrial companies. Revista de Gestão, 25(4): 413-429. https://doi.org/10.1108/REGE-04-2018-0065
[29] Nazeer, S., Fuggate, P. (2019). Sustainability framework for farm level cotton supply chain management. In Proceedings of the International Conference on Industrial Engineering and Operations Management, Bangkok, Thailand, pp. 3751-3757.
[30] Narimissa, O., Kangarani-Farahani, A., Molla-Alizadeh-Zavardehi, S. (2020). Evaluation of sustainable supply chain management performance: Dimensions and aspects. Sustainable Development, 28(1): 1-12. https://doi.org/10.1002/sd.1959
[31] Agnusdei, L., Krstić, M., Palmi, P., Miglietta, P.P. (2023). Digitalization as driver to achieve circularity in the agroindustry: A SWOT-ANP-ADAM approach. Science of the Total Environment, 882: 163441. https://doi.org/10.1016/j.scitotenv.2023.163441
[32] Yontar, E. (2023). Critical success factor analysis of blockchain technology in agri-food supply chain management: A circular economy perspective. Journal of Environmental Management, 330: 117173. https://doi.org/10.1016/j.jenvman.2022.117173
[33] Kumar, A., Mangla, S.K., Kumar, P., Karamperidis, S. (2020). Challenges in perishable food supply chains for sustainability management: A developing economy perspective. Business Strategy and the Environment, 29(5): 1809-1831. https://doi.org/10.1002/bse.2470
[34] Gladwell, M. (2008). The Story of Success. Hachette UK.
[35] Creswell. (1998). Qualitative Inquiry and Research Design: Choosing among Five Tradition. London: Sage Publications.
[36] Morse, J.M. (1994). Determining Sample Size.