Mokhtar Debbouz![]() | Zoubir Aoulmi
| Zoubir Aoulmi![]() | Chamseddine Fehdi
| Chamseddine Fehdi![]() | Moussa Attia*
| Moussa Attia*![]()
© 2024 The authors. This article is published by IIETA and is licensed under the CC BY 4.0 license (http://creativecommons.org/licenses/by/4.0/).
OPEN ACCESS
Efficient mineral transportation is critical for sustainable open-cast mining operations. Queuing theory offers a practical approach to optimizing truck-shovel systems and address truck waiting times at loading and unloading sites. This research evaluates the excavator-truck system at an Algerian open-pit phosphate mine using an M/M/1 queuing model. The model reveals relationships between truck fleet size and queue length, waiting time, shovel utilization, and overall production. Moreover, loading and transportation costs are analysed to determine the optimal truck fleet size that minimizes costs and emissions. The match factor further evaluates fleet compatibility for sustainable planning. This systems analysis provides insights into achieving efficient, low-emission truck-shovel operations through optimized fleet sizes, reduced waiting times, and cost-emission optimization. The integrated queuing model and planning techniques presented can guide sustainable planning of open-pit mining transportation systems. Focusing on efficiency, costs, and emissions allows strategic optimization for both economic and environmental sustainability.
truck-shovel, haulage system, queuing theory, production rate, phosphate, match factor
The global economy is significantly impacted by the mining sector. The five primary stages of mining process are exploration, development, exploitation, reclamation, and prospecting. Among the techniques employed in surface mining are dredging, mountaintop removal, open-pit, open-cast, and strip mining. Interestingly, over 60% of total surface output comes from open-pit operations [1]. Loading, loaded transit, dump maneuvering, dumping, and returning to the loader are the steps involved in open-pit mining. The choices about when and how to complete these tasks are made by mining engineers or planners [2].
The primary duties in mining transportation involve loading and hauling, commonly performed through the use of a truck and shovel technique [3]. This system is precisely tailored to meet the company's production goals, both in the short and long term. The design considers the size of the fleet and the loaders in order to obtain the optimal equipment combination [4]. Equipment selection is an optimization technique that identifies the fleet size with the lowest total haulage cost and maximum equipment utilization [5].
Queuing theory has been used in the past to improve truck-shovel systems, but more research needs to be done on how it can be used in open-pit mining operations [6]. Specifically, it needs to be looked at how changing the size of the truck fleet affects things like queue length, waiting time, shovel utilization, and overall production efficiency [7]. This study aims to fill that gap by looking at the excavator-truck system at an open-pit phosphate mine in Algeria using an M/M/1 queuing model [6]. It will show how to make truck-shovel operations more efficient and low-emission by adjusting fleet sizes, cutting down on wait times, and finding the best balance between cost and emissions [8].
At loading and unloading locations, there are occasionally wait durations. The waiting periods at these stations raise the unit cost per material carried since they lower operating capacity [9]. It is clear that when there is over- or under-trucking, waiting times happen. Overtucking the system results in higher loader utilization but lower truck utilization, whereas under-tucking lowers shovel utilization and hence lowers production. For instance, excessive trucking reduces truck productivity while increasing shovel production until the service rate reaches its ideal level [10-12].
Queuing theory stands out as a commonly used method in optimizing shovel-truck production, primarily for its capacity to handle randomly increasing demands [13]. Previous studies have applied various queuing models to optimize truck-shovel systems in mining operations. Abbasian-Hosseini et al. [14] and Sheikh et al. [15] utilized queuing approaches to determine the optimal truck fleet size by employing more precise productivity estimates, thereby minimizing idle equipment costs. Alkass et al. [16] and Mohamed and Ali [17] introduced the FLSELECTOR queuing model, which considered server utilization in computing haulage system production. Grosse et al. [18] and Seyyedhasani et al. [19] adapted the "Machine Repair Model," a finite source queuing model, to effectively estimate fleet size and produce accurate results. In a separate study, Khasanah et al. [20] and Ramdani et al. [21] used a single-channel queuing model to establish correlations between truck numbers, shovel utilization, system production, and queue length. The M/M/1 queuing model employed in this research is well-suited for the specific case study due to its simplicity, effectiveness in real-world applications, and ability to handle randomly increasing demands within the truck-shovel system.
Its effectiveness lies in offering enhanced estimations for wait times within a haulage system. Compared to simulation techniques, queuing theory boasts faster computation times and simpler formulation, expediting the transmission of crucial information for more efficient operations [22]. In queuing theory, two primary service channel types are recognized: the single-server channel and the multi-server channel. Within a single-server channel, trucks are directed to a lone loader within the system [23].
Koenigsberg [24] pioneered the utilization of queuing theory within mining operations, specifically modeling conventional and mechanized room-and-pillar mining setups to establish a closed-loop queuing system. This system accounted for a finite number of mine faces, assuming exponential service time distributions. Despite simulation's prevalence in the 1960s, queuing theory gained popularity due to the substantial computer memory and CPU (central processing unit) demands of simulations at that time. Consequently, analytical modeling methods like queuing theory, requiring minimal or no computational resources, emerged as a viable alternative to computer simulation models.
Karshenas [25] adapted the queuing approach for equipment selection, which was further investigated by Sabha. Their aim was to create a model for determining the optimal truck fleet size by employing a more precise productivity estimate, thereby minimizing the expenses related to idle equipment. El-Moslmani [26] introduced a queuing model, termed FLSELECTOR, that factored in server utilization in computing haulage system production. This computer-based model facilitated the selection of the optimal fleet size based on cost minimization and maximizing production output.
Krause [27] and Musingwini et al. [28] demonstrated that a modified version of the "Machine Repair Model," an example of a finite source queuing model, could effectively estimate fleet size and produce accurate results. They tailored the equations of this model to suit loading and hauling scenarios, adjusting the average time trucks spent waiting for repair to represent the average queuing time at dumpsites or loading sites. In a separate study, Hai [29] utilized a single-channel queuing model to establish correlations between varying truck numbers, shovel utilization, system production, and queue length. This model's applicability extends to any haulage system provided the data on truck arrival times and shovel service times conform to an exponential distribution.
The primary objective of this study is to improve decision-making by optimizing the truck loader system using queuing theory. The specific aims of this research encompass:
• Assessing the efficiency of the shovel-truck system.
• Investigating the effects of varying the truck fleet size on parameters such as queue length, waiting time, shovel utilization, production, and operating costs.
2.1 Queuing theory
The basic sequence delineated in the queuing models is as follows [30]: Trucks requiring loading services are consistently generated by an input source. Upon arrival, these trucks join a queue if no loaded truck is currently present. The initial truck in the queue is selected for service, undergoing the requisite loading operation, after which the truck departs from the queuing system (Figure 1).
Figure 1. Single server queue system
The subsequent analytical equations were formulated to represent the practical loading and hauling procedures through the application of the queuing model (M/M/1), which was employed for the truck-shovel system at the Open Pit Mine [31].
Probability that the system operating without any trucks.
The primary queuing model used in our study is the M/M/1 model, which is suited for systems with a single server where arrivals and services are Markovian. Here, the equations include:
λ: Average arrival rate of trucks per hour, representing the frequency at which trucks arrive at the loading station, derived from empirical data collected at the Djebel Onk mine over a continuous 30-day period.
µ: Service rate of the shovel per hour, calculated based on the average loading time per truck as observed directly and recorded during our data collection phase.
Lq: Expected number of trucks in the queue, calculated using the formula:
$L_q=\frac{\lambda^2}{\mu(\mu-\lambda)}$ (1)
Wq: Expected waiting time in the queue for trucks, given by:
$W_q=\frac{\lambda}{\mu(\mu-\lambda)}$ (2)
These parameters and their interactions are critical for optimizing the truck-shovel system at the mine, aiming to reduce waiting times and operational costs.
$P(0)=\frac{1}{\sum_{n=0}^N\left[\frac{N!}{(N-n)!}\left(\frac{\lambda}{\mu}\right)^n\right]}$ (3)
The utilization of the shovel, denoted as $\eta_S$, and the utilization of the trucks, denoted as $\eta_{t r}$, are provided in Eqs. (4) and (5), respectively [13].
$\eta_S=1-P_0$ (4)
$\eta_{t r}=\frac{W_q}{W_{q-\text { Turck Cycle time }}}$ (5)
Hourly production of the shovel Qn
$Q_n=N \times \mu \times M_{t r}$ (6)
Capacity of truck in ton.
N: number of trucks.
Truck operating cost, (DA/hr.)
$C_{t r}=\frac{N \cdot C_{\text {turck }}}{Q_n}$ (7)
Shovel operating cost, (DA/hr.)
$C_{s h}=\frac{C_{\text {shovel }}}{Q_n}$ (8)
Total cost (cost of use of trucks + Shovel operating cost), (DA/hr.)
$P(n)=\frac{N!}{(N-n)!}\left(\frac{\lambda}{\mu}\right)^n P(0)$ (9)
Probable number of trucks in the queue
$L_q=N-\frac{\lambda+\mu}{\lambda}\left(1-P_0\right)$ (10)
Probable number of trucks in system
$L_s=L_q+1-P(0)$ (11)
Expected waiting time for trucks in the queue, measured in minutes.
$W_q=\frac{L_q}{\lambda(N-L)}$ (12)
Expected waiting time of trucks in system, (minutes)
$W_S=W_q+\frac{1}{\mu}$ (13)
λ is average number of trucks washed per period.
µ is the service rate.
Probability of “n” trucks in system
$C_T=C_{\text {shovel }}+$ N.C ${ }_{t r}$ (14)
Ctruck: Cost of operating truck and shovel per hour.
Cshovel: Cost of operating shovel per hour.
2.2 Method to find a mismatch of equipment
Match factor (MF) is the most commonly used method to measure efficiency and productivity of an equipment fleet. It is defined as the ratio of truck arrival rate to shovel service. Match factor is commonly used to measure the compatibility among trucks and shovels in terms of fleet size, truck cycle and shovel loading times [32].
The calculations made to get the match factor for trucks are given
$Match\,\, Number =\frac{Average\,\, Truck\,\, cycle\,\, time }{ Average \,\,Shovel\,\, Load\,\, cycle\,\, time }$ (15)
The research area, located in the Djebel Onk mining basin, is positioned in the Tebessa region, approximately 600 km southeast of Algiers and just 20 km from the Algerian-Tunisian borders (Figure 2). The Djebel Onk mining basin, situated within the Tebessa region roughly 600 km southeast of Algiers and 20 km from the border with Tunisia, encompasses an area of about 15 square kilometers. The mine annually extracts approximately 1.2 million metric tons of phosphate from the Kef Essenoun deposit, one of five identified deposits in this area. Selected for its suitability for applying queuing theory and for the scale of its operations, this site serves as an exemplary case of large-scale mining with readily available operational data essential for the empirical validation of our model. As reported in 2019, this mine's total phosphate resource is estimated at 2.2 billion metric tons [33].
Data collection involved both direct observation and historical data analysis. We recorded the times of truck arrivals and service completions through direct monitoring over a month and analyzed past records from the mine's operational database to determine the average service and arrival rates over the past year. This comprehensive method allows for robust analysis and reliable model inputs, ensuring consistency and reliability in applying the queuing model to real-world scenarios.
Table 1 displays the input data, with the arrival and service rates being derived from experimental data.
Figure 2. Satellite image (Google Earth Map) depicting the position of the phosphate-ore mine
Table 1. The input data, with the arrival and service rates being derived from experimental data
|
DATA |
Values |
|
Arrival rate (λ) |
2.66 trucks/hour |
|
Service rate (μ) |
22.47 trucks/hour |
|
Number of shovels (s ) |
1 |
|
Traffic of shovels (ρ = λ/ μ) |
0.1183 |
|
Cost of operating shovel, Cshovel |
250 $ (33600 DA) |
|
Cost of operating trucks; Ctruck |
180 $ (24192) |
|
Shovel average loading time (min.) |
2.67 |
|
Truck average cycle time (min.) |
22.47 |
|
Truck capacity |
55 ton |
|
Loading capacity |
6 m3 |
In the current research, the transportation system within the mine utilizes a queuing model characterized by a single service parameter, specifically conforming to the M/M/1 queuing model format. This analytical approach was meticulously applied to generate a comprehensive set of results, which are critical in understanding the dynamics of the haulage system. The calculated outcomes from this model include detailed assessments of the waiting times for truck loading (denoted as Wq), the utilization rates of the servers (shovels), and the overall production output from the shovels. Additionally, the model facilitated a thorough evaluation of the associated operational costs linked to these parameters. These results are crucial for optimizing the efficiency and cost-effectiveness of the mining operations. The detailed numerical values derived from these computations are methodically organized and presented in Table 2, providing a clear and structured overview of the key performance indicators for the haulage system.
Table 2. Queuing model outputs
|
Truck Fleet Size |
Lq (trucks) |
Ls (trucks) |
Wq (min) |
Ws (min) |
Shovel Utilization ηs |
Production Qn, ton/h |
Cost of Loading, Csh/Qn |
Cost of Hauling KCtr/Qn |
Total Cost, DA/h |
Truck Utilisation ηt |
|
2 |
0.022 |
0.232 |
0.283 |
2.95 |
0.2094 |
258.730 |
129.865 |
187.006 |
316.871 |
0.9876 |
|
3 |
0.072 |
0.382 |
0.618 |
3.29 |
0.3100 |
383.056 |
87.716 |
189.466 |
277.182 |
0.9732 |
|
4 |
0.155 |
0.562 |
1.025 |
3.71 |
0.4070 |
502.936 |
66.808 |
192.406 |
259.214 |
0.9564 |
|
5 |
0.281 |
0.780 |
1.537 |
4.27 |
0.4995 |
617.328 |
54.428 |
195.941 |
250.369 |
0.9360 |
|
6 |
0.458 |
1.044 |
2.192 |
5.00 |
0.5866 |
724.997 |
46.345 |
200.210 |
246.555 |
0.9111 |
|
7 |
0.697 |
1.364 |
3.038 |
5.95 |
0.6672 |
824.543 |
40.750 |
205.379 |
246.129 |
0.8809 |
|
8 |
1.009 |
1.749 |
4.118 |
7.14 |
0.7400 |
914.479 |
36.742 |
211.635 |
248.377 |
0.8451 |
|
9 |
1.402 |
2.206 |
5.441 |
8.56 |
0.8043 |
993.976 |
33.804 |
219.048 |
252.851 |
0.8051 |
|
10 |
1.896 |
2.754 |
7.057 |
10.25 |
0.8578 |
1060.153 |
31.694 |
228.193 |
259.887 |
0.7610 |
|
11 |
2.483 |
3.384 |
8.854 |
12.069 |
0.902 |
1114.2056 |
30.156 |
238.836 |
268.992 |
0.7173 |
|
12 |
3.165 |
4.100 |
10.775 |
13.959 |
0.935 |
1155.7676 |
29.072 |
251.179 |
280.250 |
0.675 |
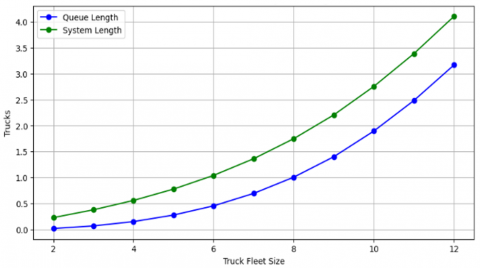
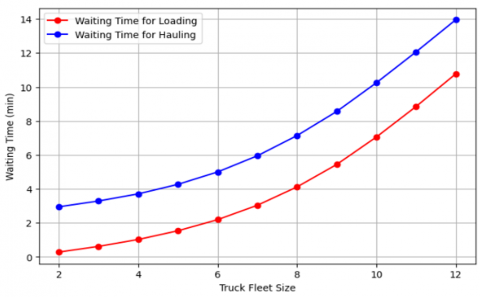
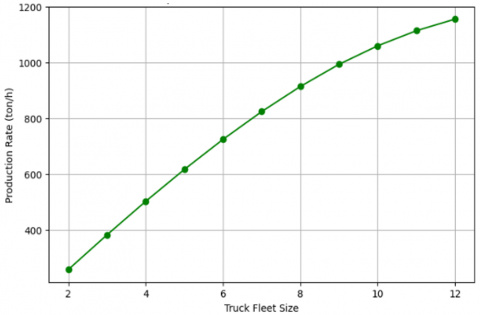
Graphs illustrating the impact of variations in fleet size on queue length, waiting time for trucks in the queue, shovel utilization, and costs can be generated and observed in Figures 3 to 7.
Figure 3. Trucks in queue length, and in system
The graphs reveal an increasing trend in the correlation between the number of trucks and various outputs from the queuing model, including queue length, waiting time in queue, shovel utilization, and production. With an expansion in fleet size, there is a corresponding rise in the number of trucks awaiting service at the shovel, leading to an increase in queue time. Interestingly, a greater number of dispatched trucks results in a more efficient performance of the shovel.
As illustrated in Figure 6, adding two more trucks to the system resulted in an approximately 20% rise in shovel utilization, leading to increased production. Conversely, the addition of five more trucks to the system resulted in a nearly 10% decrease in truck utilization.
Figure 4. Relationship between waiting time and number of truck
Figure 5. Relationship between production and number of trucks
Analyzing the relationship depicted in Figure 7 between the number of trucks and operational costs, it becomes apparent that loading costs and hauling costs are in direct opposition. Increasing the number of trucks leads to a reduction in loading costs but an elevation in hauling costs. The total cost is derived by combining the hauling and loading cost curves. This cost is minimized at the curve's lowest point, indicating the optimal number of trucks in the queue system. Referring to Figure 7, the optimized position is at 7 trucks. In other words, deploying 7 trucks for 1 shovel in this scenario ensures the system operates at the most cost-effective level.
This optimized fleet configuration not only enhances production efficiency but also significantly affects the environmental impact of mining operations by reducing idle times and lowering fuel consumption. By balancing the number of trucks and shovels, the system can achieve an equilibrium where operational efficiency and environmental sustainability intersect. The strategic management of fleet size thus becomes crucial in mitigating excessive costs and promoting eco-friendly practices. The insights from these graphical analyses underscore the importance of precise equipment scheduling and capacity planning in reducing operational bottlenecks and optimizing resource allocation within the mining industry.
These graphs not only demonstrate the dynamics of fleet management but also support strategic decision-making. By optimizing truck numbers based on performance data, the mine can significantly boost productivity and cost-efficiency. This approach shows how analytical tools can transform traditional mining operations into more economically sustainable systems, providing key insights for continuous improvement in the sector.
Figure 6. Correlation between shovel utilization and truck utilization in relation to the number of trucks
Figure 7. Relationship between cost and number of trucks
From Figure 8, it's evident that the efficiency of the system correlates directly with the match factor. A match factor of precisely 1.0 signifies a perfect alignment, resulting in optimal efficiency at 100% within the system. However, any deviation from this value indicates a degree of mismatch between the components. Here's a detailed breakdown of the insights provided:
1. Perfect match (Match factor = 1.0):
- System efficiency achieves peak performance at 100%.
- Both the loader and hauler operate at their maximum efficiency levels.
2. Match factor < 1.0:
- Indicates a form of mismatch.
- Excess loading capacity is observed within the system.
- While loader efficiency remains near 100%, transporter efficiency experiences a reduction.
3. Match factor > 1.0:
- Signals a different type of mismatch.
- Shovel efficiency reaches 100%.
- However, hauler efficiency declines in this scenario.
In essence, it's apparent that the match factor serves as a pivotal parameter in evaluating the system's efficiency. A match factor of 1.0 symbolizes an ideal equilibrium between the loader and hauler, whereas deviations from this value highlight imbalances leading to either surplus loader capacity or compromised hauler efficiency.
Upon reviewing the results presented in Table 3 and analyzing Figure 8, it becomes evident that the most advantageous scenario emerges with the utilization of 8 trucks. This conclusion closely aligns with the outcomes derived from the queuing method, as evidenced by the closely matching cost values. This finding underscores the significance of carefully considering the match factor in optimizing transportation systems within the studied context.
Table 3. Efficiency and match factor
|
N (trucks) |
MF |
% Efficiency |
|
2 |
0.23712256 |
23.7122558 |
|
3 |
0.35568384 |
35.5683837 |
|
4 |
0.47424512 |
47.4245115 |
|
5 |
0.59280639 |
59.2806394 |
|
6 |
0.71136767 |
71.1367673 |
|
7 |
0.82992895 |
82.9928952 |
|
8 |
0.94849023 |
94.8490231 |
|
9 |
1.06705151 |
93.294849 |
|
10 |
1.18561279 |
81.4387211 |
|
11 |
1.30417407 |
69.5825933 |
|
12 |
1.42273535 |
57.7264654 |
Figure 8. Efficiency and match factor analysis
In conclusion, the mining industry's focus on transportation and packaging systems, which collectively represent about 60 percent of production costs, underscores the critical importance of optimizing these processes. This study delves specifically into the shovel-truck system within an open-cast phosphate mine located in eastern Algeria. By employing the queuing model (M/M/1), we have significantly advanced our understanding of the transportation system's performance and identified optimal solutions.
Practical experimentation conducted on-site provided crucial input parameters, including arrival and service rates, which were essential for modeling the system accurately. Through this method, we were able to obtain various outputs, shedding light on critical system parameters such as queue length, waiting time, shovel utilization, and overall system production.
A key finding of this study was the discernible correlations observed between these variables and the size of the truck fleet. As the fleet size increased, the number of trucks waiting for the shovel and the time spent within the system also increased. However, this led to noteworthy improvements in shovel utilization rates and overall production efficiency.
The determination of the optimal number of trucks to be dispatched into the system within the queuing model was pivotal. This optimization was achieved by minimizing the total operating cost, which was derived by graphically summing the loading and hauling expenses. The point where the total cost curve reaches its lowest represents the optimized number of trucks for this queuing system.
Furthermore, the utilization of the match factor allowed us to assess the compatibility between trucks and shovels. By considering fleet size, truck cycle, and shovel loading times, we gained valuable insights into the efficiency and synergy between these components of the transportation system.
In essence, this study not only provides practical insights into optimizing transportation systems within open-pit mines but also underscores the importance of utilizing mathematical models such as queuing theory to enhance operational efficiency and ultimately drive sustainable practices within the mining industry.
The authors wish to extend their heartfelt thanks to the management professionals, employees, and laborers at the Djebel Onk mine in Algeria. Their support in furnishing essential technical details and offering feedback on the data and experimental work is greatly appreciated.
[1] Welch, C., Barbour, S.L., Hendry, M.J. (2021). The geochemistry and hydrology of coal waste rock dumps: A systematic global review. Science of the Total Environment, 795: 148798. https://doi.org/10.1016/j.scitotenv.2021.148798
[2] Al-Masri, M. (2022). An approach for evaluating the full truck and full bucket loading strategies in open-pit mining using a discrete event simulation and machine learning. Master Degree, Yashar Pourrahimian. https://doi.org/10.7939/r3-1dcb-rx31
[3] Derbal, C., Djellali, A., Attia, M., Zaamouche, F., Belkhiri, A. (2023). Enhancing sustainable mining practices through fracture-informed blasting strategies: A case study of the Aïn El Kebira limestone quarry in Algeria. International Journal of Sustainable Development & Planning, 18(12): 3689-3701. https://doi.org/10.18280/ijsdp.181201
[4] Liu, S.Q., Lin, Z., Li, D., Li, X., Kozan, E., Masoud, M. (2022). Recent research agendas in mining equipment management: A review. Mining, 2(4): 769-790. https://doi.org/10.3390/mining2040043
[5] Burt, C.N., Caccetta, L. (2018). Equipment Selection for Mining: With Case Studies. Springer. https://doi.org/10.1007/978-3-319-76255-5
[6] Navidi, S., Motamedi, M., Aghsami, A., Jolai, F. (2023). A G/M/C//M queueing model for revenue management of shovel-truck systems in an open-pit mine considering carbon emission, a case study. International Journal of Management Science and Engineering Management, 18(2): 88-103. https://doi.org/10.1080/17509653.2021.2015004
[7] Dindarloo, S.R., Siami-Irdemoosa, E. (2016). Determinants of fuel consumption in mining trucks. Energy, 112: 232-240. https://doi.org/10.1016/j.energy.2016.06.085
[8] Bao, H., Knights, P., Kizil, M., Nehring, M. (2023). Electrification alternatives for open pit mine haulage. Mining, 3(1): 1-25. https://doi.org/10.3390/mining3010001
[9] Moghrani, R., Aoulmi, Z., Attia, M. (2023). Hybrid RPI-MCDM approach for FMEA: A case study on belt conveyor in bir El Ater Mine, Algeria. Journal Européen des Systèmes Automatisés, 56(3): 465-473. https://doi.org/10.18280/jesa.560314
[10] Attia, M., Bechouat, M., Sedraoui, M., Aoulmi, Z. (2022). An optimal linear quadratic regulator in closed loop with boost converter for current photovoltaic application. European Journal of Electrical Engineering/Revue Internationale de Génie Electrique, 24(2): 97. https://doi.org/10.18280/ejee.240204
[11] Cundiff, J.S., Grisso, R.D., Resop, J.P., Ignosh, J. (2023). Load-out and hauling cost increase with increasing feedstock production area. AgriEngineering, 5(4): 1694-1712. https://doi.org/10.3390/agriengineering5040105
[12] Grozdanović, P., Gligorijević, A., Andrejić, M., Nikolić, M., Kilibarda, M. (2023). A new model for determining the price of product distribution based on fuzzy logic. Logistics, 7(3): 62. https://doi.org/10.3390/logistics7030062
[13] Elijah, K., Joseph, G., Samuel, M., Mauti, D. (2021). Optimisation of shovel-truck haulage system in an open pit using queuing approach. Arabian Journal of Geosciences, 14(11): 973. https://doi.org/10.1007/s12517-021-07365-z
[14] Abbasian-Hosseini, S.A., Liu, M., Leming, M. (2015). Comparison of least-cost and least-pollution equipment fleet configurations using computer simulation. Journal of Management in Engineering, 31(6): 04015003. https://doi.org/10.1061/(ASCE)ME.1943-5479.0000360
[15] Sheikh, A., Lakshmipathy, M., Prakash, A. (2016). Application of queuing theory for effective equipment utilization and maximization of productivity in construction management. International Journal of Applied Engineering Research, 11(8): 5664-5672.
[16] Alkass, S., El-Moslmani, K., AlHussein, M. (2003). A computer model for selecting equipment for earthmoving operations using queuing theory. In Proceedings of the CIB W78's 20th International Conference on Construction IT, Construction IT Bridging the Distance, CIB Report 284, ISBN 0-908689-71-3, Waiheke Island, New Zealand, pp. 1-8. https://doi.org/10.22260/ISARC2013/0040
[17] Mohamed, Y., Ali, M. (2013). A simplified online solution for simulation-based optimization of earthmoving operations. In ISARC Proceedings of the International Symposium on Automation and Robotics in Construction, Montréal, Canada, pp. 368-376.
[18] Gross, D., Kioussis, L.C., Miller, D.R. (1987). Transient behavior of large Markovian multiechelon repairable item inventory systems using a truncated state space approach. Naval Research Logistics (NRL), 34(2): 173-198. https://doi.org/10.1002/1520-6750(198704)34:2<173::AID-NAV3220340204>3.0.CO;2-2
[19] Seyyedhasani, H., Peng, C., Jang, W.J., Vougioukas, S.G. (2020). Collaboration of human pickers and crop-transporting robots during harvesting-Part II: Simulator evaluation and robot-scheduling case-study. Computers and Electronics in Agriculture, 172: 105323. https://doi.org/10.1016/j.compag.2020.105324
[20] Khasanah, A.U., Muqaffi, M.S., Nurcahyati, N. (2023). Simulation of two channels, single-phase queuing system using Monte Carlo model in a government office. In AIP Conference Proceedings, 2485(1): 090003. https://doi.org/10.1063/5.0105465
[21] Ramdani, H., Aoulmi, Z., Louafi, M., Attia, M., Mebarkia, M. (2024). Enhancing sustainability through drilling machine efficiency: A comparative analysis of TOPSIS and VIKOR methods for energy optimization. International Journal of Computational Methods and Experimental Measurements, 12(1): 45-52. https://doi.org/10.18280/ijcmem.120105
[22] Rovetto, C., Cruz, E., Nuñez, I., Santana, K., Smolarz, A., Rangel, J., Cano, E.E. (2023). Minimizing intersection waiting time: Proposal of a queue network model using Kendall’s notation in Panama city. Applied Sciences, 13(18): 10030. https://doi.org/10.3390/app131810030
[23] Galimulina, F.F., Barsegyan, N.V. (2024). Application of mass service theory to economic systems optimization problems—A review. Mathematics, 12(3): 403. https://doi.org/10.3390/math12030403
[24] Koenigsberg, E. (1960). Finite queues and cyclic queues. Operations Research, 8(2): 246-253. https://doi.org/10.1287/opre.8.2.246
[25] Sabha, F.H. (2012). Modeling reclamation earthwork operations using special purpose simulation tool. Master of Science, University of Alberta Libraries. https://doi.org/10.7939/R3D433
[26] El-Moslmani, K. (2002). Fleet selection for earthmoving operations using queueing method. Doctoral dissertation, Concordia University.
[27] Krause, A.J. (2006). Shovel-truck cycle simulation methods in surface mining. University of the Witwatersrand.
[28] Musingwini, C., Ali, M.M., Dikgale, T. (2009). A linear programming and stochastic analysis of mining replacement rate for typical Bushveld Complex platinum reef conventional mining under variable geological losses. In Proceedings of the Eighteenth International Symposium on Mine Planning and Equipment Selection (MPES 2009), pp. 551-565.
[29] Hai, D.V. (2016). Optimization of truck and shovel for haulage system in the cao son mine, Viet Nam using queuing theory Prince of Songkla University. http://kb.psu.ac.th:8080/psukb/bitstream/2016/12019/1/419559.pdf.
[30] Selinka, G., Franz, A., Stolletz, R. (2016). Time-dependent performance approximation of truck handling operations at an air cargo terminal. Computers & Operations Research, 65: 164-173. https://doi.org/10.1016/j.cor.2014.06.005
[31] Czaplicki, J.M. (2008). Shovel-Truck Systems: Modelling, Analysis and Calculations. CRC Press. https://doi.org/10.1201/9780203881248
[32] Burt, C.N., Caccetta, L. (2007). Match factor for heterogeneous truck and loader fleets. International Journal of Mining, Reclamation and Environment, 21(4): 262-270. https://doi.org/10.1080/17480930701388606
[33] Boumaza, B., Kechiched, R., Chekushina, T.V. (2021). Trace metal elements in phosphate rock wastes from the Djebel Onk mining area (Tébessa, eastern Algeria): A geochemical study and environmental implications. Applied Geochemistry, 127: 104910. https://doi.org/10.1016/j.apgeochem.2021.104910