Saja Ghanim Alhadedy*![]() | Ahmed Yousif Alomary
| Ahmed Yousif Alomary![]()
© 2024 The authors. This article is published by IIETA and is licensed under the CC BY 4.0 license (http://creativecommons.org/licenses/by/4.0/).
OPEN ACCESS
Many countries have shown interest in the happiness of societies due to its significant importance to citizens. This interest has been reflected through important indicators aimed at enhancing urban happiness, including economic factors such as per capita GDP, healthcare and educational services, as well as environmental factors. The research aims to explore one aspect of the reasons for the decline in the classification of Iraqi cities in the World Happiness Index. Green spaces have been the primary focus of studies in improving urban happiness, along with blue spaces. Due to instability, Iraq has experienced a decline in the ranking of its cities globally. The research utilized the NDVI (Normalized Difference Vegetation Index) and NDWI (Normalized Difference Water Index) calculated using the Copernicus Open Access Hub, Sentinel2L1C. The study compared the reality of Iraqi cities (Mosul, Baghdad, Basra, and Najaf) with the two happiest cities in the world according to international happiness reports for 2023: Aarhus in Denmark ranked first and Amsterdam in the Netherlands ranked second. Data analysis was conducted using Land Viewer|EOS to extract the proportions of green and blue spaces for each city. The results indicated that green spaces in Iraqi cities were limited, with little attention paid to blue spaces or their preservation, resulting in their scarcity compared to Aarhus and Amsterdam. This has contributed to Iraqi cities lagging in their classification as happy cities.
happiness indicators, green and blue infrastructure, NDVI, NDWI, happy cities
According to the World Happiness Report, issued annually, Aarhus in Denmark was considered the happiest city in the world in 2023, followed by Amsterdam. This ranking is based on various indicators and standards including education, comprehensive policies, economy, transportation, environmental protection, and access to green spaces or innovation [1]. Green spaces, such as parks, gardens, and street trees, play a crucial role in shaping the fabric of a city. There is a growing need for green spaces due to their environmental, climatic, and recreational significance. However, providing green spaces has become a challenge due to the overuse of natural resources and ecosystem destruction. This has led urban planners to consider integrating green spaces into urban fabrics [2]. Green spaces facilitate physical activity, social interactions, mental relaxation, stress reduction, and thermal comfort, there by directly and indirectly contributing to happiness and physical and mental health. It is known that urban green spaces and happiness have a positive implicit relationship. There are three main reasons linking green spaces to well-being and happiness: humans' natural emotional connection to nature, mitigating environmental drawbacks, and facilitating beneficial behaviors for physical and mental health. There are five pathways through which green cover may have beneficial effects: parks offer stress relief, facilitate physical activity, promote social interactions, generate aesthetic appreciation, provide a sense of shelter, and come up with ways to adapt to environmental pressure [3, 4].
The presence of green spaces in cities is highly significant due to their environmental benefits such as pollution reduction and improvement of local climatic conditions, as well as their social and psychological benefits, making them essential elements in cities. The amount of green space in a city varies greatly depending on natural conditions and urban, social, and economic circumstances. Therefore, it is difficult to establish general criteria for green spaces within cities. Planning standards may vary, considering factors such as the portion of green space per individual, household, or housing unit, or other environmental aspects [5].
In the 1960s, planners like Simonds suggested a rate of 90 square meters per family and a minimum of 10% green space in the city. In the 1990s, international organizations such as the United Nations Environment Programme (UNEP) attempted to set quantity standards, ranging from 12 to 16 square meters per person. Most advanced countries achieve multiples of this figure in their cities (in most European cities, it ranges from 20 to 40 square meters per person). The percentage of green areas in a city may be misleading in cases of high population or building densities and tall building heights. However, the minimum requirement usually ranges between 10% and 20% of the city's area [6].
This research paper was undertaken because there hasn't been previous focus or research on improving the happiness of Iraqi cities through attention to green and blue spaces. Iraqi cities suffer from climate changes throughout the seasons and desertification. What is the extent of the decline in green and blue spaces in them? And what is the impact of green-blue infrastructure on the happiness of cities? The reasons for choosing these Iraqi cities for comparison with the happiest two cities in the world, are that Mosul, Baghdad, Basra, and Najaf are cities with large areas and high population density, in addition to their geographic location and ethnic diversity. Also, Baghdad being the capital of Iraq, the comparison was made to determine the position of Iraqi cities in the indicators and global happiness rankings.
Regional variations in the distribution of green spaces are influenced by climate. Countries closer to the equator with tropical climates have relatively high levels of urban green space (UGS) per capita, whereas countries within the latitudes of 20-30 exhibit exceptionally low levels of UGS due to dry climates. UGS increases with latitude in higher latitude regions. Conversely, countries in Northern and Western Europe and North America show relatively high levels of happiness. Western Asian countries also exhibit relatively high happiness levels despite lower UGS rates, showing really the strong relationship between happiness and green spaces that been influenced by climate factors. Cities have urban green spaces that help to reduce carbon dioxide levels in the environment and create breeze that keep the area cool, which, in turn, enhance people's health and well-being [3].
Studies have shown that open green spaces enhance social interaction by providing places for socializing. People naturally meet their neighbors in local green spaces through outdoor parties and festivals, fostering community participation. Larger green spaces like parks can host events and public activities, promoting social mixing between communities and achieving happiness [3].
Public green spaces should be made available to urban residents to enhance social support. By doing so, one crucial aspect is public safety. If public safety is not ensured in urban parks, their positive role in social support and happiness may diminish. The meaning of public safety may change; for example, ensuring biological safety will be a priority in keeping urban parks available during the COVID-19 pandemic. The increased rate of virus transmission in enclosed spaces will raise awareness of the importance of open spaces such as urban parks. While some urban parks may be closed during lockdowns, some reports suggest that viewing them from home can also help reduce stress during the pandemic [3].
Huang et al. [7] confirmed that different types of greenery, such as grassy areas, tree-lined areas, and plant-free areas, have different effects on people's happiness. Grass areas had the greatest impact on people's happiness.
Houlden et al. [8] emphasized the difference in types of nature and stated that natural green spaces were more efficient than parks and sports fields, while a study by Andalib et al. [9] mentioned that the environment, as sites of scenic beauty, whether natural or built, suggesting that the type of greenery chosen for an area can have the highest impact on citizens' happiness and health.
Recent research has found strong correlations between access to urban green public spaces, such as parks and public squares, and increased levels of well-being and happiness. The important finding is that happiness is more strongly correlated with green space than with social and economic status. Psychologists are also conducting new research on how landscapes and aesthetics influence our decisions, emotional responses, and self-perception. The pattern, shape, texture, light, and color of landscapes collectively influence how we feel and perform, consciously or subconsciously. Humans have countless emotional responses to aesthetics and landscapes, confirming the observation by the French writer Stendhal that "beauty is a promise of happiness" [10].
Green areas reduce risks of environmental hazards like air pollution and noise levels in the cities. Moreover, they protect the local biodiversity help city authorities develop long-term visions, and create green cities that involve community participation. Green spaces provide access to natural elements and landscapes, such as parks, street trees, grassy areas, forests, and riverbanks. The public spaces with greenery can encourage physical activity, have positive impacts on health and mental well-being, reduce stress, and provide natural cooling and shadow [11].
Parks and trees are essential elements of green urban structures on campuses, promoting comfort for pedestrians and stimulating positive emotions, thus achieving happiness [12].
As for blue cover, the presence of water in its various forms (such as fountains) enhances the vitality of a place. Water, with its forms and sounds, along with the potential for creating communal activities (such as water play areas), is an important factor in creating feelings in a place [13].
Water is extremely necessary for modern urban life if we want to be happier, more relaxed, and more productive. Water adds a magical touch to landscapes [10] The presence of water in its various forms is an essential element, a reference point, and a meeting point if provided with seats and meeting areas. Flowing water, in particular, has the property of inducing tranquility in the environment, with a sense of well-being for those who can use it [14].
The accumulated research has indicated that the COVID-19 pandemic witnessed a surge in the use and appreciation of Urban Green Spaces (UGS). To ensure equal physical and visual access to UGS, Konijnendijk (2023) recently proposed the 3-30-300 rule: residents should be able to see at least three trees from their home with a 30% tree canopy cover and within a 300-meter distance to the nearest green space. While the rule appears as a guiding principle for urban planners, the precise nuances in context regarding the relationship between happiness in UGS must be evaluated. Public health, urban planning, and natural sciences including meteorology and epidemiology have been central to studies aiming to clarify the potential links between UGS, happiness, and well-being [15].
When creating a new landscape, it is important to consider the visual harmony of the plants and components intended to be integrated by forming a cohesive composition that ultimately contributes to enhancing the quality of life. The plant cover, through subtle means such as color harmony, shapes, texture and structure of leaves and flowers, delicate fragrance, as well as the invisible influence of the plants' bioenergy field, works on the mental state of individuals, positively affecting their mood and tone of voice, then In green spaces, colors play a specific role. They create atmospheres filled with optimism. Among the five senses (sound, sight, touch, taste, and smell), the color and texture of the plants used in garden landscaping directly influence mood and evoke memories and emotions Thus it stimulates happiness [16].
One of the experimental evidence is the use of mind mapping, a technique innovated by Kevin Lynch (1960), which has since been widely used in research. Mind map analysis was employed to study students' emotional experience in green open spaces on the university campus to identify memorable areas. This study, as a single case study, was conducted at the campus of Effat University in the Kingdom of Saudi Arabia, and according to their responses, access to green areas is the most important factor in promoting happiness [17].
Additionally, electrocardiogram (ECG) testing was widely used as an important means to determine mood changes. Smart wearable devices were used to integrate ECG data with spatial characteristics, and SDNN and RMSSD were taken as indicators of ECG to assess mood changes. Green spaces evoked positive emotions in them according to the ECG test [18]. Table 1 illustrates the variables addressed by previous studies, as well as the results reached by each study.
Table 1. The studied references
|
Author(s) |
Variable |
Results |
|
Kwon, Hong, Yong and Jung 2021 |
Climate, location and public safety affect the distribution of green spaces |
It enhances social interaction and community participation and its positive role in promoting happiness and public health |
|
Haung, Yang Bauer. 2020 |
Biodiversity of plants |
Reducing stress, arousing positive feelings and achieving happiness |
|
Holden, 2021 |
Natural green spaces |
It is considered more efficient than parks and sports fields |
|
Vissilia and others 2015 |
Access to green places Presence of water |
Promotes increased levels of well-being and happiness Happier and more relaxed |
|
Desmet, samavati 2022 |
Green areas (parks, trees, grassy areas) |
It reduces pollution, encourages physical activity, and provides natural cooling and shade, which has positive effects on health and well-being |
|
Maria and others 2018 |
Visual harmony of color and texture |
It positively affects mood and thus stimulates happiness |
|
Maria, 2015 |
The presence of water in its various forms and flowing water |
Achieving calm and well-being |
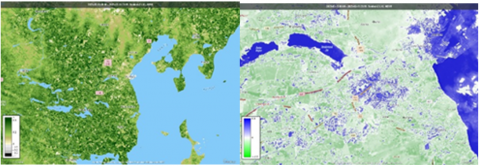
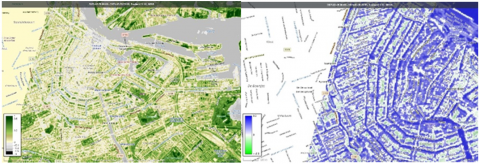
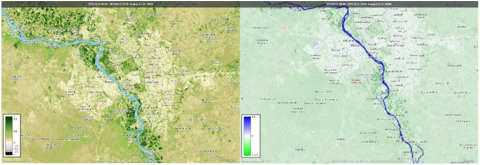
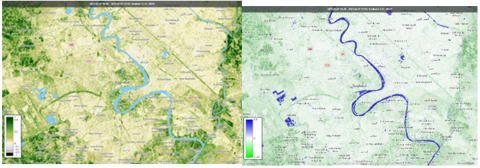
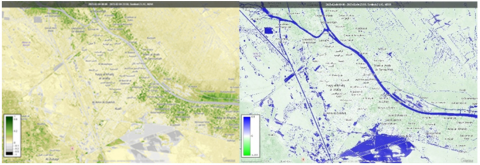
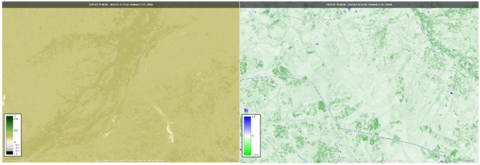
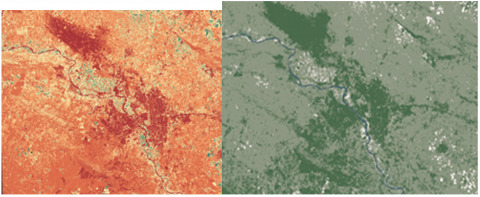
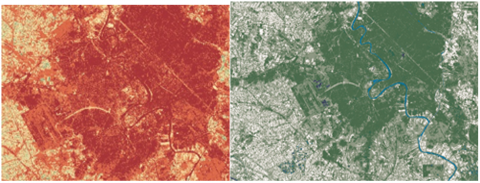
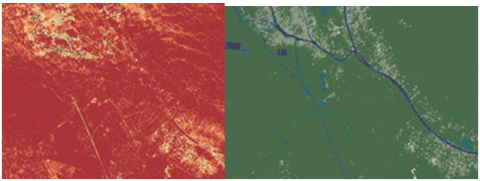
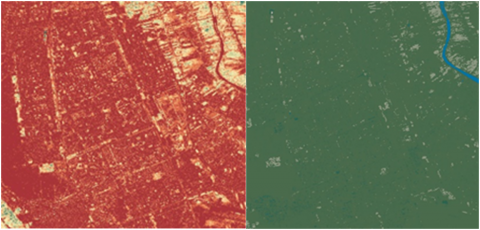
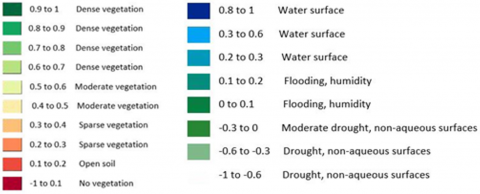
Aarhus and Amsterdam, ranked among the happy cities, were selected and compared with cities in Iraq (Mosul, Baghdad, Basra, and Najaf) using a comparative approach in the case study of cities. The criteria for choosing the cities Arhus and Amsterdam is that they are globally ranked as the happiest two cities according to the 2023 World Happiness Report. As for the Iraqi cities (Baghdad, Mosul, Basra, Najaf), they enjoy a geographical location with large areas, high population density, ethnic diversity, and Baghdad being the capital city. Where the location was used Copernicus Open Access Hub, Sentinel2L1C (It's a wide-ranging, high-resolution, and multi-spectral European imaging mission. With its high-resolution visual images, it has numerous applications, including land monitoring, emergency response, and assisting security agencies. The satellite's multi-spectral imaging device provides a versatile set of 13 spectral bands ranging from visible to near-infrared and shortwave infrared wavelengths. It is an Open source website, to obtain aerial images for Aarhus, Amsterdam, Mosul, Baghdad, Basra, and Najaf, including NDVI and NDWI for these cities [19]. The NDVI values range from 1 to -1, and NDWI values range from 0.8 to -0.8 (See Figure 1 for illustration). The data was then analyzed using Land Viewer|EOS (is a convenient daily satellite image processing tool. On-the-fly imagery analytics and download of any image suitable for your business purposes. allows merging multiple scenes into one and performing satellite image mapping of any large area). To analyze a city, its name was inputted in the "location" field or selected through the "draw" icon. From SCENE SEARCH, sensors were specified, and an image showing the area of interest was chosen. Subsequently, the NDVI or NDWI was selected from the BAND COMBINATIONS icon to read and analyze the city's image in terms of proportions and areas. Finally, the analyzed image was saved using SCENE Downloading [20] (See Figure 2 for illustration). So, the NDVI ratios will be collected for each city relative to the total area of the city, and comparisons will be made between the selected cities. Similarly, NDWI ratios will be collected and compared between the selected cities. The statistical analysis used is the ratio of green or blue area to the total city area.
Aarhus
Amsterdam
Mosul
Baghdad
Basra
Najaf
Figure 1. NDVI and NDWI
Aarhus
Amsterdam
Mosul
Baghdad
Basra
Najaf
Figure 2. Analysis of the percentage of NDVI and NDWI
Key:
NDVI NDWI
Support for urban happiness can be achieved through investing in green (or blue) infrastructure, and the Normalized Difference Vegetation Index (NDVI) serves as a simple yet effective indicator for assessing the quantity of green vegetation. It reflects the health status of vegetation based on how plants absorb light at certain wavelengths. According to the Copernicus Open Access Hub website, the range of NDVI values for Sentinel2L1C satellite imagery is between -1 and 1. Negative values of NDVI (values approaching -1) correspond to water bodies. Values close to zero (-0.1 to 0.1) generally indicate barren areas of rocks, sand, or snow. Low positive values represent shrubs and grasslands (around 0.2 to 0.4), while high values indicate temperate and tropical rainforests (values approaching 1).
The Normalized Difference Water Index (NDWI) is the most suitable indicator for mapping water bodies. Values greater than 0.5 represent water bodies, whereas vegetation has smaller values. Built-up features have positive values between zero and 0.2.
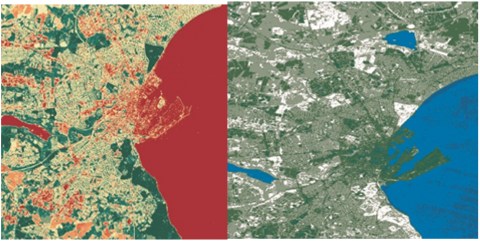
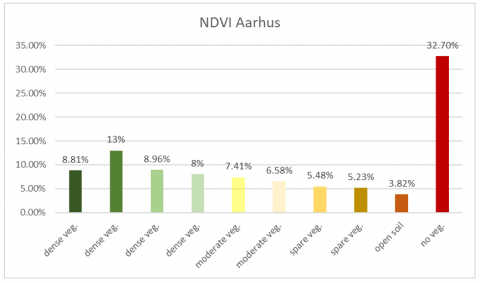
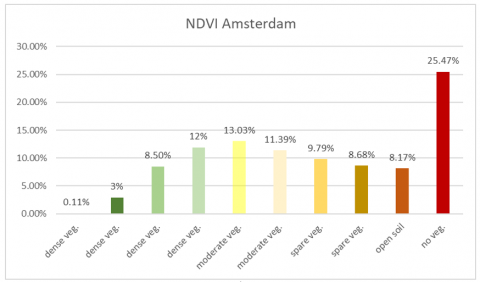
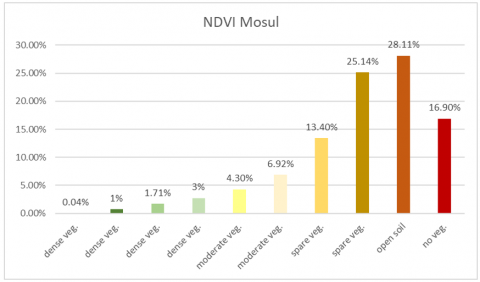
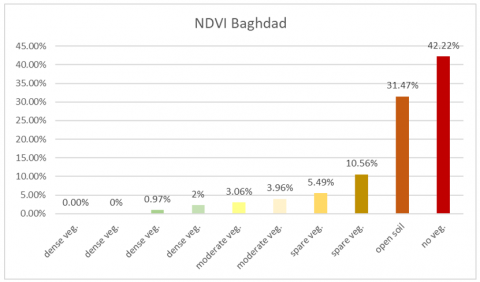
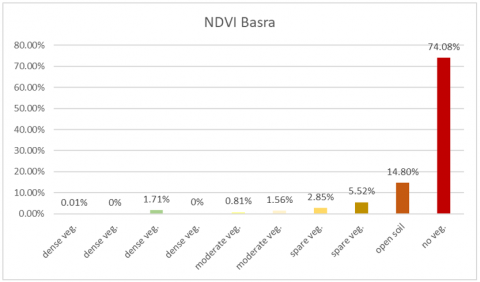
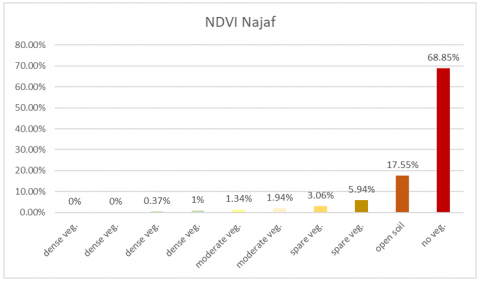
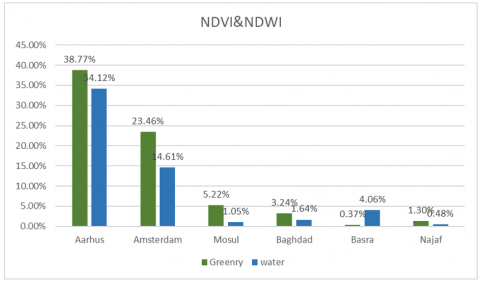
Analyzing the data using Land Viewer|EOS revealed the following NDVI percentages for dense vegetation in each city: Aarhus 38.77% (comprising 8.81% + 13% + 8.96% + 8), Amsterdam 23.46% (comprising 0.11% + 2.94% + 8.5 + 11.91), Mosul 5.22% (comprising 0.04% + 0.72% + 1.71% + 2.75%), Baghdad 3.24% (comprising 0.97 + 2.27), Basra 0.37% (comprising 0.01% + 0.05% + 0.31%), and Najaf 1.30% (comprising 0.03 + 0.37 + 0.9). These are the total NDVI percentages for dense vegetation in each city, with NDVI values ranging from 0.6 to 1. For moderate-density vegetation, the total NDVI percentages are Aarhus 13.99% (comprising 7.41% + 6.58%), Amsterdam 24.4 (comprising 11.39% + 13.03%), Mosul 11.22% (comprising 6.92% + 4.3%), Baghdad 7.02% (comprising 3.96% + 3.06%), Basra 2.37% (comprising 1.56% + 0.81%), and Najaf 3.28% (comprising 1.94% + 1.34%). These are the total NDVI percentages for moderate-density vegetation in each city, with NDVI values ranging from 0.4 to 0.6. The remaining values represent scattered vegetation or non-vegetated areas, as illustrated in Table 2 and Figure 3.
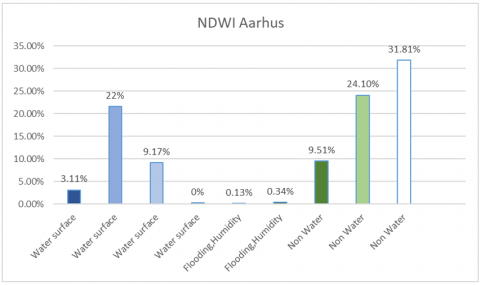
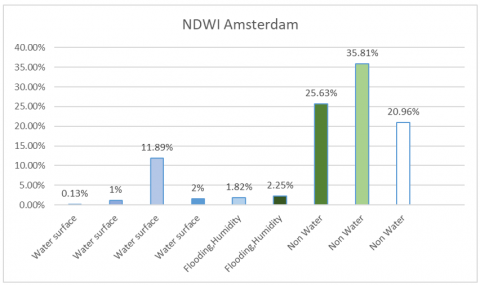
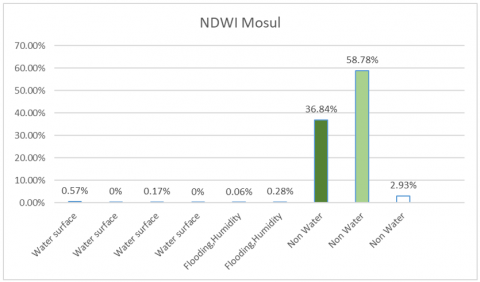
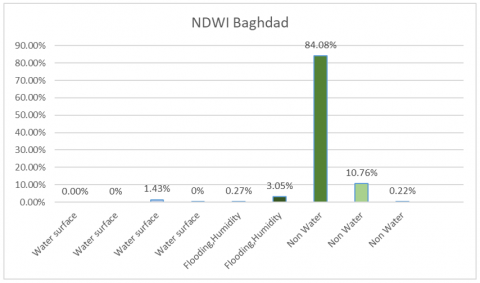
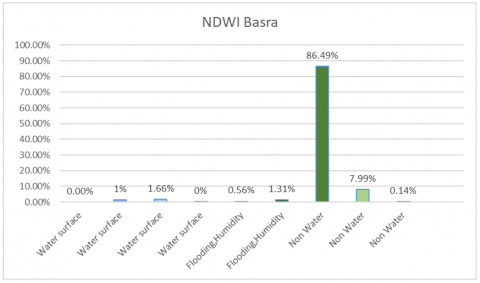
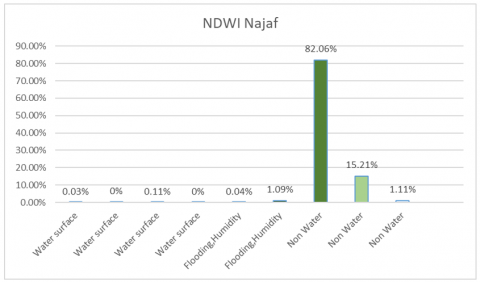
As for the NDWI percentages: Aarhus 34.12% (comprising 3.11% + 21.59% + 9.17% + 0.25%), Amsterdam 14.61% (comprising 0.13% + 1.07% + 11.89% + 1.52%), Mosul 1.05% (comprising 0.57% + 0.31% + 0.17% + 0.05%), Baghdad 1.64% (comprising 1.43% + 0.21%), Basra 4.06% (comprising 1.36% + 1.66% + 0.48%), and Najaf 0.48% (comprising 0.03% + 0.31% + 0.11% + 0.03%). These are the total NDWI percentages including blue areas for each city, with NDWI values ranging from 0.2 to 1, as shown in Table 3 and Figure 4.
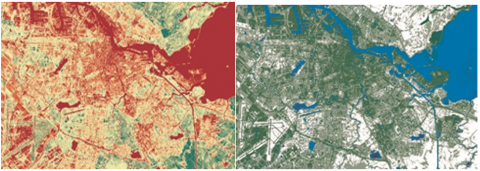
Based on these results, Aarhus includes high green and blue areas, followed by Amsterdam, compared to the Iraqi cities, which include limited green and blue areas as shown in Figure 5. This allows us to answer the research questions, as green-blue spaces play an important role in achieving urban happiness, as in Aarhus and Amsterdam, which top the global happiness lists. In contrast, the climate changes and desertification in Iraqi cities have led to a decline in their green-blue areas, making them lag in global happiness rankings.
Table 2. Analysis of the percentage of NDVI
|
|
Dense Vegetation |
Moderate Vegetation |
Sparse Vegetation |
Open Soil |
No Veg. |
|||||
|
Aarhus |
8.81% |
13% |
8.96% |
8% |
7.41% |
6.58% |
5.2% |
5.48% |
3.82% |
3.72% |
|
Amsterdam |
0.11% |
2.94% |
8.5% |
11.91% |
13.03% |
11.39% |
9.79% |
8.6% |
8.17% |
25.4% |
|
Mosul |
0.04% |
0.72% |
1.71% |
2.75% |
4.3% |
6.92% |
13.4% |
25.1% |
28.11% |
16.9% |
|
Baghdad |
0% |
0% |
0.97% |
2.27% |
3.06% |
3.96% |
5.4 % |
10% |
31.47% |
42.2% |
|
Basra |
0% |
0.01% |
0.05% |
0.31% |
0.81% |
1.56% |
2.8% |
5.5% |
14.8% |
74.08% |
|
Najaf |
0% |
0.03% |
0.37% |
0.9% |
1.34% |
1.94% |
3% |
5.9% |
17.5% |
68.8% |
Table 3. Analysis of the percentage of NDWI
|
|
Water Surface |
Flooding, Humidity |
Non-Water |
Non-Water |
Non-Water |
||||
|
Aarhus |
3.11% |
21.59% |
9.17% |
0.25% |
0.13% |
0.34% |
9.51% |
24.1% |
31.81% |
|
Amsterdam |
0.13% |
1.07% |
11.89% |
1.52% |
1.82% |
2.25% |
25.63% |
35.81% |
20.96% |
|
Mosul |
0.57% |
0.31% |
0.17% |
0.05% |
0.06% |
0.28% |
36.84% |
58.78% |
2.93% |
|
Baghdad |
0% |
0% |
1.43% |
0.21% |
0.27% |
3.05% |
84.08% |
10.76% |
0.22% |
|
Basra |
0% |
1.36% |
1.66% |
0.48% |
0.56% |
1.31% |
86.49% |
7.99% |
0.14% |
|
Najaf |
0.03% |
0.31% |
0.11% |
0.03% |
0.04% |
1.09% |
82.06% |
15.21% |
1.11% |
Figure 3. Analysis of the percentage of NDVI
Figure 4. Analysis of the percentage of NDWI
Figure 5. Total of the percentage of NDVI and NDWI
The percentage of green areas including dense vegetation cover in the city of Arhus is 38.77%, and those including medium vegetation cover are 13.99%. This was the highest percentage, followed by Amsterdam, which includes areas with dense vegetation cover at a rate of 23.46%, and areas with medium vegetation cover at a rate of 24.42%. This has placed these two cities at the forefront of happy cities. As for cities in Iraq, the percentages are low. In Mosul, the percentage of dense vegetation cover is 5.22%, and medium vegetation cover is 11.22%. In Baghdad, dense vegetation cover is 3.24%, and medium vegetation cover is 7.52%. In Basra, dense vegetation cover is 0.37%, and medium vegetation cover is 2.37%. In Najaf, dense vegetation cover is 1.30%, and medium vegetation cover is 3.28%. This has placed Iraqi cities at the bottom of the list of happy cities. Similarly, in terms of water areas, the highest percentage was in Arhus, reaching 34.12%, followed by Amsterdam with 14.61%. Iraqi cities had low percentages: Mosul at 1.05%, Baghdad at 1.64%, Basra at 4.06%, and Najaf at 0.48%.
The results obtained are in line with previous studies on improving urban happiness through green-blue spaces.
There are no imposed restrictions on data sources as they are open-source.
Tree planting processes are always taking place in Iraqi cities, but the absence of effective policy management by policymakers in improving irrigation methods has led to the decline of green spaces. Therefore, new and advanced irrigation methods must be adopted. Additionally, the lack of overall urban planning by planners and the ongoing urban expansion have resulted in the loss of many open spaces. Hence, there is a need to activate the role of planners and consider urban planning for cities, distributing green-blue spaces according to the needs of each city.
The presence of green or blue spaces plays a significant role in improving happiness indicators for cities. Therefore, focusing on planning and distributing them correctly when designing cities contributes to their development and achieving happiness for their residents.
The high proportion of green or blue spaces in the cities of Aarhus and Amsterdam has placed them at the forefront of happy cities.
The low proportion of green or blue spaces in Iraqi cities has made them lag behind in terms of happiness. Therefore, attention should be paid to these cities and efforts should be made to improve their current situation in order to achieve higher ranks in happiness rankings.
The authors wish to express their gratitude to the Scientific Committee, in the Department of architecture at the College of Engineering is From the University of Mosul, to support to them and its role of science and ethics.
[1] Helliwell, J., Layard, R., Sachs, J. (2022). World happiness, report. WellBeing International. https://www.wellbeingintlstudiesrepository.org/cgi/viewcontent.cgi?article=1001&context=hw_happiness.
[2] Abdulraouf, A. (2019). People, square and medina - Urbanization, revolution and society. In the human, architectural, and urban story of tahrir square. Beirut: Arab Center for Research and Policy Studies.
[3] Kwon, O.H., Hong, I., Yang, J., Wohn, D.Y., Jung, W.S., Cha, M. (2021). Urban green space and happiness in developed countries. EPJ Data Science, 10(1): 28. https://doi.org/10.1140/epjds/s13688-021-00278-7
[4] MacKerron, G., Mourato, S. (2013). Happiness is greater in natural environments. Global Environmental Change, 23: 992-1000. https://doi.org/10.1016/j.gloenvcha.2013.03.010
[5] Jameel, M., Younis, M. (2012). The impact of the green open areas on the social life in Mosul. Journal of Techniques, 25(3): A28-A43.
[6] Simonds, J.O. (1961). Landscape Architecture: The Shaping of Man's Natural Environment. McGraw-Hill.
[7] Huang, Q., Yang, M., Jane, H.A., Li, S., Bauer, N. (2020). Trees, grass, or concrete? The effects of different types of environments on stress reduction. Landscape and Urban Planning, 193: 103654. https://doi.org/10.1016/j.landurbplan.2019.103654
[8] Houlden, V., Porto de Albuquerque, J., Weich, S., Jarvis, S. (2021). Does nature make us happier? A spatial error model of greenspace types and mental wellbeing. Environment and Planning B: Urban Analytics and City Science, 48(4): 655-670. https://doi.org/10.1177/2399808319887395
[9] Andalib, E., Diaconu, M.G., Temeljotov-Salaj, A. (2023). Happiness in the urban built environment, people, and places. In IOP Conference Series: Earth and Environmental Science, 1196(1): 012090. https://doi.org/10.1088/1755-1315/1196/1/012090
[10] Vissilia, A.M., Georgi, N.J., Constantinides, C. (2015). Public space as landscape experience of happiness: A surprise public garden amidst water and large blocks of woodland. Urban Happiness and Public Space, 3rd Biennale of Public Space, 261: 59-62.
[11] Samavati, S., Desmet, P.M.A. (2022). Happy Public Spaces: A Guide with 20 Ingredients to Design for Urban Happiness. Delft: Delft University of Technology.
[12] Dabdoob, R.M. (2023). Is Mosul university campus comfortable for walking? Al-Rafidain Engineering Journal (AREJ), 28(1): 74-88 https://doi.org/10.33899/rengj.2023.136856.1213
[13] Sepe, M. (2017). The role of public space to achieve urban happiness. Urban Regeneration and Sustainability, 96: 364-373. https://doi.org/10.2495/SDP-V12-N4-724-733
[14] Maria, L. (2015). The happy city as multifactorial synergy. In Urban Happines and Public Space.
[15] Syamili, M.S., Takala, T., Korrensalo, A., Tuittila, E.S. (2023). Happiness in urban green spaces: A systematic literature review. Urban Forestry & Urban Greening, 86: 128042. https://doi.org/10.1016/j.ufug.2023.128042
[16] Maria, C., Florina, G.E., Erzsebet, B., Zaharia, A., Denisa, J., Alexandra, S.R. (2018). Implementation of landscape design solutions with the color and texture of plants. Journal of Horticulture, Forestry and Biotechnology, 22(1): 22-28.
[17] Farag, A.A., Badawi, S.R., Doheim, R.M. (2019). Assessment of user happiness in campus open spaces. The Journal of Public Space, 4(1): 45-64. https://doi.org/10.32891/jps.v4i1.566
[18] Zhang, J., Li, Y. (2023). The impact of campus outdoor space features on students’ emotions based on the emotion map. International Journal of Environmental Research and Public Health, 20(5): 4277. https://doi.org/10.3390/ijerph20054277
[19] https://dataspace.copernicus.eu/browser/?zoom=12&lat=52.37019&lng=4.89269&themeId=DEFAULT-THEME&visualizationUrl=https%3A%2F%2Fsh.dataspace.copernicus.eu%2Fogc%2Fwms%2F274a990e-7090-4676-8f7d-f1867e8474a7&datasetId=S2_L1C_CDAS&fromTime=2023-02-07T00%3A00%3A00.000Z&toTime=2023-02-07T23%3A59%3A59.999Z&layerId=3_NDVI&demSource3D=%22MAPZEN%22&cloudCoverage=10&date-Mode=SINGLE, accessed on May, 25, 2024.
[20] https://eos.com/landviewer/?lat=33.0&lng=44.0&z=11, accessed on May, 25, 2024.