Mohammad Ridwan Rangkuti*![]() | Marlon Sihombing
| Marlon Sihombing![]() | Heri Kusmanto
| Heri Kusmanto![]() | Hatta Ridho
| Hatta Ridho![]()
© 2024 The authors. This article is published by IIETA and is licensed under the CC BY 4.0 license (http://creativecommons.org/licenses/by/4.0/).
OPEN ACCESS
The research aims to determine the community's participation in education services in Deli Serdang Regency and fiscal decentralization. This research is important and beneficial in identifying patterns and characteristics of income and expenditure in education services, exploring various types and patterns of community participation in education, and establishing the link between income and expenditure in education services and community participation in education in Deli Serdang Regency. The research used the constructivist Paradigm and a qualitative approach. The researchers gathered data through documentation technique, in-depth interviews and discussions with various informants from the Regency, Regional People's Representative Council (DPRD), Sub-Regencies, Schools (elementary and junior high), and Community Figures. The research also gathered data through literature review, document study, and secondary data. The findings show that there is a financial imbalance between the Central Government and the Local Government, and horizontally between provinces and regencies/cities in Indonesia. Secondly, Deli Serdang Regency's Local Own-Source Revenue (PAD) is relatively high compared to other regencies in Sumatera Utara. However, the PAD has not optimized. Thirdly, the Expenditure in Education Services in Deli Serdang Regency for 2017-2022 is relatively stable. In addition, education Services allocated more funds to Indirect Expenditure (Operational Expenditure) than Direct Expenditure (Capital Expenditure).
education governance, education expenditure, community participation
This research aims to determine the community's perception of essential education services in the Deli Serdang Regency and their relationship with Fiscal Decentralization, both in terms of income and expenditure in education services in the Deli Serdang Regency from 2017 to 2022. The region's dissatisfaction with the State's (Central Government's) substantial control over natural resource management in the region, as well as the Central Government's insufficient attention to the development gap between regions (Java and non-Java), has resulted in a strong desire from the regions for a division of power/authority between the Central Government and the regions. Various proposals for fiscal decentralization have been made since the early 1970s. However, the main elements of Fiscal Decentralization have never been implemented [1-6].
The dissatisfaction felt by the regions reached its peak, triggered by the economic crisis and political turmoil that occurred from mid-1997 to early 1998. The economic crisis, characterized by the weakening of the exchange rate of the Indonesian Rupiah against the U.S. dollar, was followed by a soaring inflation rate (77.63%) in 1998, a 66.53% increase from previous years. As a result, a political crisis occurred during the Soeharto administration. Demonstrations took place everywhere. The public was dissatisfied with the situation at that time. The political situation worsened when the government implemented many policies deemed illogical and not in favor of the people, such as the reduction of fuel subsidies.
Meanwhile, violence occurred on a large and massive scale. The people were mainly driven by a sense of injustice, leading to this violence. The economic crisis and political turmoil of the time forced Soeharto to resign as President of the Republic of Indonesia. Since then, the government has shifted from an authoritarian and highly centralized Soeharto regime to a more democratic and decentralized Reform Era regime [7, 8]. Indonesia was undergoing a fundamental change in its political and governance life. One of the changes was the implementation of Regional Government and Political Systems. The pattern of relations between the Central Government and Regional Governments has shifted. At the time, people knew this shift in the pattern of relations as Regional Autonomy (Decentralization). The Central Government responded to the increasing demand for Regional Autonomy (Decentralization) by promptly requesting the People's Consultative Assembly (DPR) to discuss and approve two laws in April 1999.
The government enacted Law Number 22 of 1999 regarding Regional Government and Law Number 25 of 1999 regarding Financial Balance between the Central Government and Regional Governments. January 1, 2001, was the starting date for implementing Regional Autonomy (Decentralization). The implementation of Regional Autonomy and Fiscal Decentralization, which began on January 1, 2001, had implications for delegating authority/matters between the Central Government and Regional Governments in various fields. Law Number 22 of 1999 regarding Regional Government and Law Number 25 of 1999 regarding Financial Balance between the Central Government and Regional Governments regulated the delegation of authority. These laws have undergone several changes over time.
According to Law Number 33 of 2004, Regional Autonomy or Decentralization is the transfer of governance authority from the Government to Autonomous Regions to regulate and manage government affairs within the system of the Unitary State of the Republic of Indonesia [9-11]. Law Number 33 of 2004 states that enacting laws on Financial Balance between the Central Government and Regional Governments is intended to support the funding for the transfer of affairs to Regional Governments as regulated in the Law on Regional Government. Based on Law Number 33 of 2004, Fiscal Balance consists of Revenue Sharing Funds, General Allocation Funds, and Special Allocation Funds. Fiscal Balance aims to reduce vertical fiscal disparities between the Central Government and Regional Governments and assist the regions in financing the delegated authorities/matters [12-14].
Financing based on the principle of "money follows function" means that financing follows the functions of governance that have become the obligations and responsibilities of each level of government. With the enactment of Law Number 32 of 2004, the authority/matters of Regional Governments have expanded. Meanwhile, Law Number 33 of 2004 is expected to promote the improvement of regional financial capacity [15, 16]. Regional Autonomy or Decentralization is expected to actively serve as a means for Regional Governments to promote economic and public service efficiency [17]. Thus, Regional Autonomy can stimulate regional economic growth and improve the welfare of residents through the various multiplier effects of decentralization [18, 19].
Several studies on Fiscal Decentralization have shown an improvement in public services. For example, the implementation of decentralization in various parts of the world was driven by the desire or effort to obtain better public services [20, 21]. Other studies have shown that Decentralization policies (revenue and expenditure) are part of the way to improve the efficiency of the public sector, reduce budget deficits, and enhance economic growth [22-29].
According to Law Number 33 of 2004, the sources of financing for the implementation of Regional Government include Regional Own-Source Revenue (PAD), Fiscal Balance Funds, Regional Loans, and Other Legitimate Revenues. Regional Own-Source Revenue (PAD) is the region's income derived from local taxes, local levies, management of separated regional wealth, and other legitimate regional own-source revenues, aimed at providing flexibility for regions to explore funding in the implementation of regional autonomy as a manifestation of the principle of decentralization. Law Number 28 of 2009 regarding Regional Taxes and Levies was issued to follow up on the authority of regions in increasing PAD. This law regulates the authority of Regional Governments to collect funds from the local community to obtain funding for regional development. Fiscal Balance Funds are regional financing derived from the State Budget (APBN). Fiscal Balance Funds consist of Revenue Sharing Funds, General Allocation Funds, and Special Allocation Funds [30, 31]. General Allocation Funds (DAU) are funds sourced from the State Budget to equalize financial capabilities among regions. It is intended to reduce financial disparities between regions by applying a formula that considers the needs and potentials of the regions.
Based on Law Number 33 of 2004, the needs for General Allocation Funds (DAU) for a Region (Province etc.) are determined using the fiscal gap concept and basic allocation approach. The fiscal gap is calculated based on the fiscal needs minus the fiscal capacity of the region. In other words, DAU is used to close the fiscal gap because the region's needs exceed its revenue potential. Typically, the distribution of DAU to regions with relatively higher capacity will be smaller, while regions with relatively lower capacity will receive relatively larger DAU. For the basic allocation concept, DAU is calculated based on the region's number of Civil Servants (PNS). To reduce disparities in financing needs and tax jurisdiction between the Central and Regional Governments, a minimum of 26% of net domestic revenue is allocated to regions such as DAU [32].
One of the purposes of the Fiscal Balance Funds is to assist regions in financing their authorities. Additionally, the funds aim to reduce the imbalance in funding sources between the Central and Regional Governments and narrow the funding gap between Inter-Regional Governments. By providing financial support to regions, the funds can address each area's specific challenges and opportunities and promote more balanced economic development across Indonesia. These three components of Fiscal Balance Funds are a system of fund transfers from the government and form a cohesive unit [33, 34].
The transfer policy from the Central Government to Regional Governments has existed since the New Order era. The amount of transfer from the Central Government to Regional Governments during the New Order era was implemented in three forms: (1) Autonomous Regional Subsidy (SDO); (2) Assistance for Special Projects (Inpres); and (3) Project List (DIP). The purpose of the Autonomous Regional Subsidy (SDO) was to support the routine budget of Regional Governments and facilitate the creation of a financial balance between government levels. It is reported that the region utilized around 95% of the Autonomous Regional Subsidy (SDO) to finance the salaries of Government employees [35, 36]. The region allocated the remaining portion for various purposes, including subsidies for routine expenditures in primary education, rewards for rural employees, subsidies for regional hospital operations, and funding for Government employee training [35, 36]. SDO is categorized as a specific grant from the Central Government, as the region does not have the authority to determine the use of SDO.
The financial balance policy between the Central and Regional Governments derives from the Regional Autonomy policy, which entails actively transferring some government authorities from the Central to the Regional Governments. Previous study stated that the regions incur more significant costs as more authorities transfer [37]. Therefore, in managing decentralization, the principle of efficiency becomes a requirement. The budget for government tasks or public services must be managed while producing maximum output. Another vital point to understand is that Fiscal Decentralization in Indonesia refers to fiscal decentralization on the expenditure side, primarily funded through transfers to the regions [38, 39].
The concept of Fiscal Decentralization in Deli Serdang Regency refers to decentralization as the transfer of planning, decision-making, and/or administrative authority from the central government to central organizations in the region, local administrative units, semi-autonomous organizations, and parastatal (corporations), local government, or non-governmental organizations. The differentiation of decentralization concepts is primarily determined by the level of authority for planning, deciding, and managing the authority transferred by the central government and the degree of autonomy granted to carry out these tasks.
The concept of participation in Deli Serdang Regencies participation that has given rise to a concept of participation aimed at a sense of concern, involving various forms of citizen involvement in policy-making and decision-making in various key arenas that influence community life.
The implementation of Fiscal Decentralization in Indonesia began in 2001, marked by the transfer of financial resources in the form of transfers to Regional Governments, which amounted to a significant total sum for the regions. The Central Government provides Fiscal Balance Funds (DBH, DAU, and DAK) as transfers to Regional Governments. DBH and DAU are unconditional transfers, while DAK is conditional [32, 40]. Since the start of Fiscal Decentralization in 2001, the total amount of Fiscal Balance Funds provided to the regions as transfers was Rp. 81.1 trillion. In 2012, the Fiscal Balance Funds amounted to Rp. 411.2 trillion. In 2020, the Transfer to Regions and Village Funds (TKDD) reached Rp. 856.94 trillion. TKDD consists of transfers to regions amounting to Rp. 784.94 trillion, and Village Funds amounting to Rp. 72.00 trillion. So, this study aims to determine the community's participation in education services in Deli Serdang Regency and fiscal decentralization.
The research paradigm used in this study is the Constructivist paradigm, with a qualitative research method [41]. Data is collected through in-depth interviews and discussions with several informants from the Regency (Regional Government and Regional Representative Council), Sub-Regency, Schools (Elementary etc.), and Community Figures (Regency). Data is also collected through literature review, document study, and secondary data.
This research utilizes primary data. Firstly, primary data is collected through a Questionnaire. The distribution of the questionnaire is intended to identify issues in education services and issues in the Allocation and Implementation of Regional Expenditures (Operational and Capital Expenditures) in the field of education in Deli Serdang Regency. The data obtained through the distribution of the questionnaire is then analyzed using descriptive analysis techniques. The results of the data analysis are subsequently interpreted. From the data distribution, various issues in education services related to the Allocation and Implementation of Regional Revenue and Expenditures in Deli Serdang Regency will be identified. Additionally, issues that arise regarding community participation in education services in Deli Serdang Regency, such as Gross Participation Rate (APK), Net Enrollment Rate (APM), and Dropout Rate (APS), will also be examined.
Furthermore, the researchers conducted interviews with crucial and ordinary informants, and they conducted in-depth interviews with both types of informants. The informants in this study include Government Officials from the Regency, Members of the Deli Serdang Regional Representative Council, and Community Figures (Community Organizations, NGOs). The interviews aim to reinforce the findings and seek explanations for the research findings. Interview data will be recorded using audio or video recording devices. The interview data will then be transcribed. Interviews with the informants are instrumental in further exploring initial findings and enriching the data related to issues in education services, the Allocation and Implementation of Education Service Expenditures, and community participation in education services in Deli Serdang Regency.
3.1 Income transfers of Deli Serdang Regency
Since the beginning of Fiscal Decentralization in 2001, the Intergovernmental Transfer Funds provided to the regions in the form of Regional Transfers have been implemented. In the fiscal year 2001, the Regional Transfer Funds amounted to IDR 81.1 trillion. Then, in the fiscal year 2012, the Regional Transfer Funds increased to IDR 411.2 trillion. In the fiscal year 2020, the Transfers to the Regions (including Village Funds or TKDD) reached IDR 856.94 trillion. The TKDD in the fiscal year 2020 consisted of Regional Transfers amounting to IDR 784.94 trillion and Village Funds amounting to IDR 72.00 trillion. Deli Serdang Regency is one of the Autonomous Regency in North Sumatra Province. The area of Deli Serdang Regency covers 2,808.91 square kilometers, with a population of 1,886,388 people. In 2015 Deli Serdang Regency had 22 Regencies and 394 villages/urban wards. Out of the 394 villages/urban wards, we can geographically classify them into 148 urban villages and 246 rural villages.
Since 2001, Deli Serdang Regency has been receiving Intergovernmental Transfer Funds. During the fiscal periods of 2018, 2019, 2020, and 2021, Deli Serdang Regency received Intergovernmental Transfer Funds (TKDD). In the fiscal year 2020, Deli Serdang Regency received an amount of IDR 2,417,551,946,000. The Deli Serdang Regency's Regional Budget (APBD) allocates these Intergovernmental Transfer Funds in revenue and expenditure. They are allocated for Direct Expenditure (Capital Expenditure) and Indirect Expenditure (Operational Expenditure). Meanwhile, the Proposed Regional Budget (RAPBD) of Deli Serdang Regency for the fiscal year 2018 amounted to IDR 3,733,345,654,763, the RAPBD for the fiscal year 2019 amounted to IDR 4,016,480,823,937, the RAPBD for the fiscal year 2021 amounted to IDR 3,999,683,294,443. The RAPBD for the fiscal year 2022 amounted to IDR 4,202,535,350,834.
Intergovernmental Transfer Funds in Transfers to the Region (TKD) for Deli Serdang Regency during fiscal years 2017-2022 can be seen in the following Table 1.
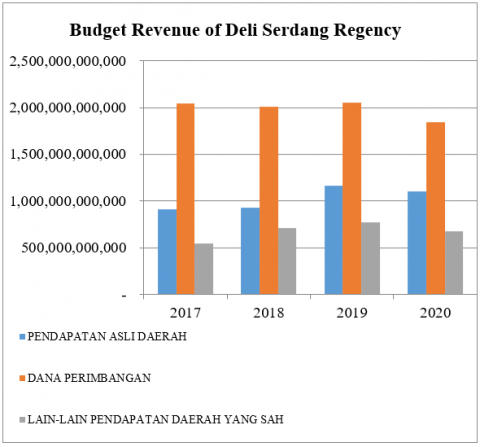
Table 1 shows that revenue from intergovernmental transfers was relatively stable in the FY 2017-2020 period. Except, in 2020, there was a decrease in revenue. More details can be seen in Figure 1.
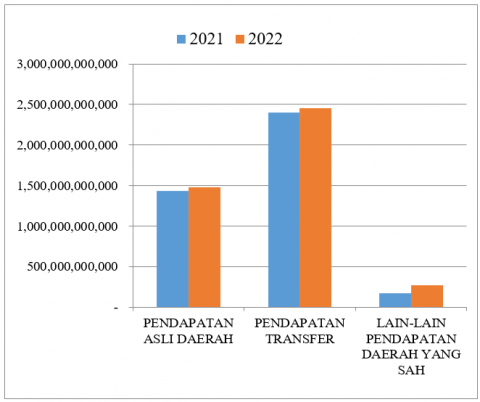
Meanwhile, in fiscal years 2021 and 2022, there was an increase in the regional revenue of Deli Serdang Regency derived from intergovernmental transfers. Please refer to Table 2 and Figure 2.
Furthermore, Deli Serdang Regency's budgeted revenue from Intergovernmental Transfer, Local Own Source Revenue (PAD), and other legitimate Regional Revenues is allocated to Regional Expenditures, both Direct and Indirect Expenditures. In Deli Serdang Regency, the allocation ratio of Indirect Expenditures and Direct Expenditures shows a more significant allocation for Indirect Expenditures compared to Direct Expenditures from 2017 to 2020.
This indicates that the Deli Serdang Regency Government allocates more funds to Employee Expenditures (Operational Expenditures) than Investment Expenditures, Capital Expenditures, or Infrastructure Expenditures. Refer to the following Table 3.
Similarly, in 2021 and 2022, the Indirect Expenditure (Operational) ratio was higher than Capital Expenditure (Direct Expenditure). Please refer to Table 4 and Figure 3.
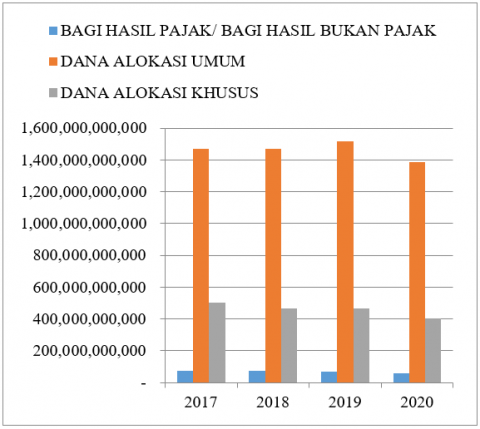
If we look further, Deli Serdang Regency obtained the intergovernmental transfer for 2017-2020 from the General Allocation Fund (DAU), Special Allocation Fund (DAK), and Tax Revenue Sharing/Non-Tax Revenue Sharing. The General Allocation Fund (DAU), the Special Allocation Fund (DAK), and Tax Revenue Sharing/Non-Tax Revenue Sharing provided the most significant intergovernmental transfer. The trend of intergovernmental transfer from the General Allocation Fund (DAU) during 2017-2020 was relatively stable, except for a slight decrease in 2020. Please refer to the Table 5 and Figure 4.
In addition to Central Transfers, the Deli Serdang Regency Government also receives Inter-Regional Transfer Revenue. Inter-Regional Transfer Revenue comes from the Transfer from the North Sumatra Province. The total Provincial Transfer Funds for 2021 amounted to Rp. 144,795,606,664, and for 2022 amounted to Rp. 283,969,301,090. Please refer to the Tables 4-7 and Figures 5 and 6.
Table 1. Intergovernmental transfer (TKD) data for Deli Serdang Regency, years 2017-2020
|
Year |
Revenue |
|||
|
Local Own Source Revenue |
Intergovernmental Transfer Revenue |
Other Legitimate Local Revenue |
Total Revenue |
|
|
Total (Rp) |
||||
|
2017 |
912.593.775.000 |
2.043.192.659.743 |
542.641.987.290 |
3.498.428.422.033 |
|
2018 |
925.522.525.079 |
2.007.320.996.209 |
707.736.400.521 |
3.640.579.921.809 |
|
2019 |
1.167.794.977.442 |
2.054.904.857.733 |
776.367.814.048 |
3.999.067.649.223 |
|
2020 |
1.100.498.262.974 |
1.845.298.432.000 |
674.363.175.664 |
3.620.159.870.638 |
Source: Data processed based on the Official Document of R-Perda Deli Serdang Regency 2021
Table 2. Data on Deli Serdang Regency's intergovernmental transfers in 2021-2022
|
Year |
Revenue |
|||
|
Local Own Source Revenue |
Intergovernmental Transfer Revenue |
Other Legitimate Local Revenue |
Total Revenue |
|
|
Total (Rp) |
||||
|
2021 |
1.431.739.161.779 |
2.395.217.628.664 |
172.726.500.000 |
3.999.683.290.443 |
|
2022 |
1.479.436.406.744 |
2.451.019.494.090 |
272.079.450.000 |
4.202.535.350.834 |
Source: Data processed based on the Official Document of R-Perda Deli Serdang Regency 2022
Figure 1. Budget of Deli Serdang Regency year 2017-2020
Source: Data processed based on the Official Document of R-Perda Deli Serdang Regency 2021
Figure 2. Deli Serdang Regency revenue budget for 2021-2022
Source: Data processed based on the Official Document of R-Perda Deli Serdang Regency 2022
Table 3. Regional expenditure budget for Deli Serdang Regency year 2017-2020
|
Year |
Expenditure |
||
|
Indirect Expenditure |
Direct Expenditure |
Total Expenditure |
|
|
Total |
|||
|
2017 |
1.917.385.975.857 |
1.825.169.017.108 |
3.742.554.992.965 |
|
2018 |
2.012.180.560.607 |
1.809.991.207.411 |
3.822.171.768.018 |
|
2019 |
2.049.712.500.678 |
2.057.534.399.513 |
4.107.246.900.191 |
|
2020 |
2.042.114.855.716 |
1.657.073.005.633 |
3.699.187.861.349 |
Source: Data processed based on the Official Documents of the 2017-2020 Deli Serdang Regency Budget
Table 4. Deli Serdang Regency indirect expenditure budget for 2021-2022
|
Year |
Expenditure |
||||
|
Operational Expenditure |
Capital Expenditure |
Unexpected Expenditure |
Transfer Expenditure |
Total Expenditure |
|
|
Total (Rp) |
|||||
|
2021 |
2.729.689.077.920 |
768.581.572.799 |
10.000.000.000 |
518.412.645.724 |
4.026.683.296.443 |
|
2022 |
2.944.945.106.830 |
704.614.705.097 |
49.500.000.000 |
530.475.538.907 |
4.229.535.350.834 |
Source: Data processed based on the Official Budget Document for the Deli Serdang Regency Year 2020-2021
Table 5. Intergovernmental transfer revenue budget/transfer funds for the regional government of Deli Serdang Regency
|
Year |
Intergovernmental Transfer |
|||
|
Tax/Non-Tax Revenue Sharing |
General Allocation Fund |
Special Allocation Fund |
Total Intergovernmental Transfer |
|
|
Total (Rp) |
||||
|
2017 |
72.896.904.743 |
1.468.561.952.000 |
501.733.803.000 |
2.043.192.659.743 |
|
2018 |
73.084.751.250 |
1.468.561.952.000 |
465.674.292.959 |
2.007.320.996.209 |
|
2019 |
70.413.631.000 |
1.516.175.120.000 |
468.316.106.733 |
2.054.904.857.733 |
|
2020 |
55.977.920.000 |
1.385.860.252.000 |
403.460.260.000 |
1.845.298.432.000 |
Source: Data processed based on the Official Document for Regional Transfer Budget for Deli Serdang Regency Year 2017-2020
Table 6. Deli Serdang Regency transfer revenue for the year 2021-2022
|
Year |
Transfer Revenue |
Total Transfer Revenue |
|
|
Central Government Transfer Revenue |
Inter-Regional Transfer Revenue |
||
|
Total (Rp) |
|||
|
2021 |
2.250.422.022.000 |
144.795.606.664 |
2.395.217.628.664 |
|
2022 |
2.167.050.193.000 |
283.969.301.090 |
2.451.019.494.090 |
Source: Data processed based on the Official Document for Regional Transfer Budget for Deli Serdang Regency Year 2021-2022
Figure 3. Budget for Deli Serdang Regency year 2017-2020
Source: Data diolah Berdasarkan Dokumen Resmi Anggaran Belanja Deli Serdang Regency Year 2017-2020
Figure 4. Deli Serdang District indirect expenditure budget for the year 2021-2022
Source: Data processed based on the Official Budget Document for the Deli Serdang Regency Year 2020-2021
Figure 5. Intergovernmental transfer revenue budget/transfer funds for the regional government of Deli Serdang Regency
Source: Data processed based on the Official Document for Regional Transfer Budget for Deli Serdang Regency Year 2017-2020
Figure 6. Deli Serdang Regency transfer revenue for the year 2021-2022
Source: Data processed based on Official Budget Documents Deli Serdang Regency Regional Transfer Year 2021-2022
Table 7. Target and revenue realization of Deli Serdang Regency government
|
Year |
Target |
Realization |
(%) |
|
Total (Rp) |
|||
|
2017 |
3.498.428.422.033.00 |
3.332.039.840.502.13 |
95.24% |
|
2018 |
3.640.579.921.809.07 |
3.363.304.583.385.75 |
92.38% |
|
2019 |
4.009.331.169.223.00 |
3.573.056.389.618.75 |
89.12% |
|
2020 |
3.620.159.870.638.00 |
3.335.349.826.580.82 |
92.13% |
|
2021 |
4.104.380.358.501.00 |
3.539.280.627.629.33 |
86.23% |
|
2022 |
4.202.535.350.834.00 |
- |
0% |
Source: Data processed based on target documents and budget realization Regency of Deli Serdang Year 2017-2022
When looking at the expenditure targets and actual expenditure for 2017-2022, the Deli Serdang Regency Government only achieved 90% (90.25%) of the target in 2017. The actual expenditure amounted to Rp. 3,377,738,242,038.88. However, starting from 2018-2022, the realization was less than 90%. The actual expenditure experienced a decrease, reaching 82.19% in 2021 (Table 8).
Table 8. Targets and realization of Deli Serdang Regency government expenditures for 2017-2022
|
Year |
Target |
Realization |
(%) |
|
Total (Rp) |
|||
|
2017 |
3.742.554.992.965.98 |
3.377.738.242.083.88 |
90.25% |
|
2018 |
3.822.171.768.018.30 |
3.422.610.573.014.61 |
89.55% |
|
2019 |
4.117.510.420.191.37 |
3.601.407.369.876.00 |
87.47% |
|
2020 |
3.699.187.861.349.12 |
3.274.161.220.772.19 |
88.51% |
|
2021 |
4.226.597.995.061.00 |
3.473.760.778.916.05 |
82.19% |
|
2022 |
4.229.535.350.834.00 |
- |
0% |
Source: Data processed based on the Target Document and the Realization of the Deli Serdang Regency Regional Budget for the 2017-2022 Year
3.2 Low local own source revenue in Deli Serdang
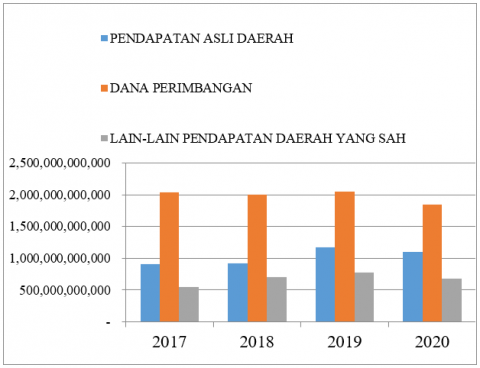
The Local Own Source Revenue (PAD) of Deli Serdang Regency from 2017-2022 has shown an increasing trend. In 2017, it amounted to Rp. 912,593,775,000. In 2020, the PAD reached Rp. 1,100,498,262,974. Refer to Table 9 and Figure 7.
Meanwhile, on TA. In 2021 and 2022 there will be another trend of increasing Regional local own source revenue (PAD) for Deli Serdang Regency. PAD TA. 2021 of Rp. 1,431,739,161,779, - and PAD TA. 2022 of Rp. 1,479,406,744, - (Table 10 and Figure 8).
Local Own Source Revenue (PAD) of Deli Serdang Regency is relatively high when compared to the PAD of other Regencies in North Sumatra Province. Furthermore, PAD experienced a significant increasing trend. During the TA Period. 2020 and FY. 2021 PAD Deli Serdang RegencyTA. 2020 of Rp949.025.000.000,- TA. 2021 of Rp. 1,183,640,522,000, - and TA PAD. 2022 of Rp. 1,479,406,744,-. Meanwhile, the PAD of Batubara Regency TA. 2020 FY. 145,593,651, - TA. 2021 Rp. 110.310.000.000,-.
Meanwhile, Padang Lawas Regency TA. 2020 Rp. 11,584,348,000, - and TA. 2021 Rp. 23,466,914,000, - Humbang Hasundutan Regency TA. 2020 Rp. 10,287,602,000 and TA. Rp. 10. 287,602,000, - Nias Regency TA. Rp. 5,550,000,000, - and TA. 2021 Rp. 4,808,900,000, - West Pakpak Regency TA. 2020 Rp. 3,172,000,000, - and TA. 2021 Rp. 1.782.000.000,-.
Figure 7. Deli Serdang Regency revenue budget 2017-2022
Source: Official document of the 2017-2022 Deli Serdang Regency Revenue budget
Table 9. Revenue budget for Deli Serdang Regency for 2017-2020
|
Year |
Revenue |
|||
|
Local Own Source Revenue |
Intergovernmental Transfer |
Other Legitimate Local Revenue |
Total Revenue |
|
|
Total (Rp) |
||||
|
2017 |
912.593.775.000 |
2.043.192.659.743 |
542.641.987.290 |
3.498.428.422.033 |
|
2018 |
925.522.525.079 |
2.007.320.996.209 |
707.736.400.521 |
3.640.579.921.809 |
|
2019 |
1.167.794.977.442 |
2.054.904.857.733 |
776.367.814.048 |
3.999.067.649.223 |
|
2020 |
1.100.498.262.974 |
1.845.298.432.000 |
674.363.175.664 |
3.620.159.870.638 |
Source: Official document of the 2017-2020 Deli Serdang Regency Revenue budget
Table 10. Local own source revenue of Deli Serdang Regency year 2021-2022
|
Year |
Revenue |
|||
|
Local Own Source Revenue |
Intergovernmental Transfer |
Other Legitimate Local Revenue |
Total Revenue |
|
|
Total (Rp) |
||||
|
2021 |
1.431.739.161.779 |
2.395.217.628.664 |
172.726.500.000 |
3.999.683.290.443 |
|
2022 |
1.479.436.406.744 |
2.451.019.494.090 |
272.079.450.000 |
4.202.535.350.834 |
Source: Official document of the 2021-2022 Deli Serdang Regency Revenue budget
Figure 8. Local revenue for Deli Serdang Regency for the year 2021-2022
Source: Official document of the 2021-2022 Deli Serdang Regency Revenue budget
3.3 Education service expenditure of Deli Serdang Regency
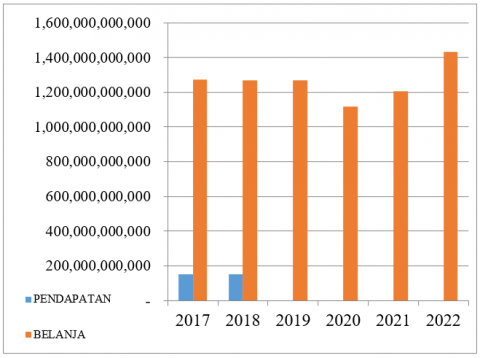
The Education Service Expenditure of Deli Serdang Regency remained relatively stable from 2017 to 2022. However, there was a slight decrease in expenditure in 2020, while an increase of Rp. 1,432,236,482,578,- was observed in 2022. Please refer to the following Table 11 and Figure 9 for more details.
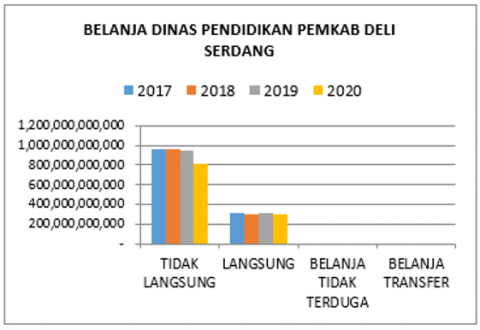
Upon further analysis, the ratio of Education Service Expenditure shows a more significant allocation towards Indirect Expenditure (Operational Expenditure) compared to Direct Expenditure (Capital Expenditure). From 2017 to 2022, Indirect Expenditure remained relatively large and stable in 2017, 2018, and 2019. It experienced an increase in 2021 and 2022, with a slight decrease in 2020. Please refer to the following Table 12 and Figure 10 for a visual representation.
Generally, there are several programs in education management at Deli Serdang Regency. These include the management of primary education (SD), the management of junior high schools (SMP), the management of early childhood education (PAUD), and the management of non-formal/equivalency education. Regency Deli Serdang directs Operational Expenditure and Capital Expenditure toward managing education programs. Capital Expenditure includes expenditures on building and infrastructure, such as moderate or heavy rehabilitation of teacher or principal or administration rooms, moderate or heavy rehabilitation of facilities/infrastructure and school utilities, student practice and demonstration equipment procurement, and construction of housing for school principals/teachers/guards. On the other hand, Operational Expenditure includes expenditures on goods and services, such as the procurement of practice tools and student materials (Table 13 and Figure 11).
Table 11. P-APBD of the Deli Serdang Regency government education office
|
Year |
Revenue |
Expenditure |
|
Total (Rp) |
||
|
2017 |
152.363.000.000 |
1.274.912.015.689 |
|
2018 |
152.363.000.000 |
1.269.813.555.724 |
|
2019 |
- |
1.268.117.961.543 |
|
2020 |
- |
1.115.813.728.614 |
|
2021 |
- |
1.206.941.868.684 |
|
2022 |
- |
1.432.236.482.578 |
Source: Data processed based on Official Documents from the Deli Serdang Regency Education Office for the 2017-2022 Year
Figure 9. P-APBD of the Deli Serdang Regency government education office
Source: Data processed based on Official Documents from the Deli Serdang Regency Education Office for the Year 2017-2022
Table 12. Expenditure of Deli Serdang Regency education department for the year 2017-2020
|
Year |
Education Department Expenditure |
||||
|
Indirect |
Direct |
Unexpected Expenditure |
Transfer Expenditure |
Total Expenditure |
|
|
Total (Rp) |
|||||
|
2017 |
956.301.491.587 |
318.610.524.102 |
- |
- |
1.274.912.015.689 |
|
2018 |
966.439.950.082 |
303.373.605.642 |
- |
- |
1.269.813.555.724 |
|
2019 |
950.411.148.017 |
317.706.813.526 |
- |
- |
1.268.117.961.543 |
|
2020 |
814.493.463.814 |
301.320.264.800 |
- |
- |
1.115.813.728.614 |
Source: Data processed based on Education Office Expenditure of Deli Serdang Regency Year 2017-2020
Table 13. Expenditure of Deli Serdang Regency education department for the year 2021-2022
|
Year |
Education Department Expenditure |
||||
|
Operational Expenditure |
Capital Expenditure |
Unexpected Expenditure |
Transfer Expenditure |
Total Expenditure |
|
|
Total (Rp) |
|||||
|
2021 |
1.111.297.626.134 |
95.644.242.550 |
- |
- |
1.206.941.868.684 |
|
2022 |
1.342.711.271.367 |
89.525.211.211 |
- |
- |
1.432.236.482.578 |
Source: Data processed based on Expenditure of the Deli Serdang Regency Education Office for the 2021-2022 Year
Figure 10. Education office expenditure of Deli Serdang Regency year 2017-2020
Source: Data processed based on the 2017-2020 Expenditure of the Deli Serdang District Education Office
Figure 11. Expenditures for the Deli Serdang Regency education office for the 2021-2022 year
Source: The data is processed based on Expenditures from the Deli Serdang Regency Education Office for 2021-2022
a. Education Expenditure Realization
Meanwhile, the realization of Education Expenditure (Direct and Indirect Expenditure) in Regency Deli Serdang during fiscal years 2017-2021 was above 90%. Except for the fiscal year 2018, the realization of Indirect Expenditure (Operational Expenditure) was 87.12%, and in the fiscal year 2019, it was 89.49%. On the other hand, the realization of Direct Expenditure (Capital Expenditure) in the fiscal year 2019 was 89.36%; in the fiscal year 2020, it was 88.77%; and in the fiscal year 2021, it was 73.84%.
Meanwhile, the school infrastructure in Regency Deli Serdang generally consists of a total of 1,914 schools, including 52 senior high schools (MA), 190 primary schools (MI), 148 junior high schools (MTs), 915 primary schools (SD), one particular primary school (SDTK), two inclusive schools (SKB), 136 senior high schools (SMA), 2 Christian senior high schools (SMAK), 127 vocational high schools (SMK), 329 junior high schools (SMP), one particular junior high school (SMPTK), two vocational schools (SMTK), four private primary schools (SPK SD), one private senior high school (SPK SMA), and four private junior high schools (SPK SMP).
b. Harmonization of Central and Regional Expenditures
Upon reviewing the ratio of Education Service Expenditure in Deli Serdang Regency, a more significant allocation and realization of expenditure are allocated to Indirect Expenditure (Operational Expenditure) compared to Direct Expenditure (Capital Expenditure). However, there has been a fluctuation in expenditure during fiscal years 2017-2022. Indirect Expenditure is relatively large and stable in fiscal years 2017, 2018, and 2019. It experienced an increase in fiscal years 2021 and 2022 and a slight decrease in fiscal year 2020. However, there is a relatively similar spending pattern compared to the allocation and realization of Central Government Expenditure (in the State Budget) from 2016 to 2019. Therefore, it does not support improving public services, especially in the region's Education field.
The allocation and realization of expenditure (in the State Budget), both for Indirect Expenditure (Operational Expenditure), are larger compared to Direct Expenditure (Capital Expenditure). In fiscal year 2016, Personnel Expenditure amounted to Rp. 347,509.0 trillion, in fiscal year 2018, it was Rp. 344,963.5 trillion, in fiscal year 2018, it was Rp. 365,691.5 trillion, and in fiscal year 2019, it was Rp. 381,561.1 trillion. Expenditure on Goods in fiscal year 2016 amounted to Rp. 323,353.7 trillion, in fiscal year 2017, it was Rp. 269,704.0 trillion, in fiscal year 2018, it was Rp. 340,130.2 trillion, and in fiscal year 2019, it was Rp. 345,230.7 trillion. Meanwhile, Direct Expenditure (Capital Expenditure) in fiscal year 2016 amounted to Rp. 201,583.4 trillion, in fiscal year 2017, it was Rp. 220,686.9 trillion, in fiscal year 2018, it was Rp. 203,879.4 trillion, and in fiscal year 2019, it was Rp. 189,343.2 trillion.
In addition to Personnel Expenditure, Expenditure on Goods, and Capital Expenditure, the allocation and realization of Central Government Expenditure also include Debt Interest Payments, Subsidies, Other Expenditures, Grants, Social Assistance, Education Budget Adjustments, and Additional Stimulus. It is exciting and essential to note the Social Assistance during fiscal years 2016-2019. During the period of Central Government Expenditure, Social Assistance increased sharply. Social Assistance in fiscal year 2016 amounted to Rp. 54,936.8 trillion, in fiscal year 2017, it was Rp. 55,752.5 trillion, in fiscal year 2018, it was Rp. 81,259.8 trillion, and in fiscal year 2019, it was Rp. 102,055.5 trillion. For further details, please refer to the following Table 14.
Compared to the Central Government Expenditure, the Regional Expenditure is relatively tiny. This is true in the field of education, for example. Based on the data from LKPP (Indonesia's Public Procurement Agency), the Central Government Expenditure on education for the fiscal year 2017 amounted to Rp. 138,507 trillion for the fiscal year 2018 amounted to Rp. 145,941 trillion, and for the fiscal year 2020, amounted to Rp. 155 trillion.
On the other hand, the realization of expenditure by the Ministry of Education, Culture, Research, and Technology for the fiscal year 2022 is below 62%. Personnel Expenditure (Operational Expenditure) is 62.7%, and Capital Expenditure is 17.38%. Please refer to Table 15.
c. Output and Outcome of Education Expenditure
The Gross Enrollment Rate (APK) and Net Enrollment Rate (APM) serve as indicators of educational services. As per BPS (Bureau of Statistics), the Gross Enrollment Rate (APK) represents the percentage ratio of the number of students at a specific level of education to the population of school-age children at the same level. This includes Elementary School (SD), Junior High School (SLTP), and Senior High School (SLTA), among others. The Gross Enrollment Rate (APK) is the ratio of the number of students, regardless of age, attending a particular level of education to the population of the corresponding age group for that level of education. For example, the APK for Elementary School is the number of students enrolled in Elementary School divided by the population of the age group 7 to 12 years. The Gross Enrollment Rate (APK) indicates the overall level of participation of the population in a particular level of education. The Gross Enrollment Rate (APK) is the most straightforward indicator to measure the absorption capacity of the school-age population at each level of education. In order to increase the gross enrollment rate that has yet to reach the target, actions can be taken, such as adding educational facilities, improving the skills of educators, and increasing the education budget from both local and central sources.
The Gross Enrollment Rate (APK) is obtained by dividing the number of enrolled students (or the number of students) at a particular level of education, regardless of age, by the population of the corresponding age group for that level of education. APK is formulated as APK. Where: t is the population in year t of various ages currently attending school at a particular level of education; h is the population in year t in age group a, which is the age group related to education level h. The data required to calculate the APK are the number of school-age population (or students) of various ages at each level of education and the number of population per standard age group (refer to the standard age table) related to each level of education.
Table 14. Government expenditure by function year 2017-2021
|
Code |
Function |
2017 |
2018 |
2019 |
2020 |
2021 |
|
LKPP |
LKPP |
LKPP |
LKPP |
APBN |
||
|
01 |
Public service |
307,147.2 |
375,196.1 |
400,090.7 |
537,820.0 |
526,181.3 |
|
02 |
Defense |
117,506.6 |
106,832.3 |
115,424.5 |
136,908.2 |
137,185.6 |
|
03 |
Order and security |
135,748.1 |
143,305.8 |
147,956.0 |
154,107.6 |
166,632.2 |
|
04 |
Economy |
307,787.5 |
382,420.9 |
358,426.6 |
399,930.0 |
511,338.1 |
|
05 |
Environment |
10,613.7 |
13,709.6 |
16,094.0 |
13,041.8 |
16,689.9 |
|
06 |
Housing and public facilities |
27,277.4 |
32,198.0 |
26,622.5 |
22,784.1 |
33,217.3 |
|
07 |
Health |
57,225.1 |
61,869.7 |
71,006.9 |
105,088.5 |
111,666.7 |
|
08 |
Tourism and creative economy |
5,770.6 |
10,700.0 |
4,229.9 |
3,151.8 |
5,261.4 |
|
09 |
Religion |
8,870.4 |
9,379.0 |
11,218.8 |
9,488.0 |
11,075.9 |
|
10 |
Education |
138,507.3 |
145,941.7 |
155,160.2 |
155,113.1 |
175,236.5 |
|
11 |
Social protection |
148,905.5 |
173,771.6 |
190,083.7 |
295,517.8 |
260,063.6 |
|
Total |
1,265,359.4 |
1,455,324.9 |
1,496,313.8 |
1,832,950.9 |
1,954,548.5 |
|
Source: Ministry of Finance, 2022
Including those whose functions are not classified (TA. 2005 Rp0,17 trillion; TA. 2006 minus Rp0,01 trillion; TA. 2007 minus Rp0,01 trillion; TA. 2010 Rp0,9 trillion; TA. 2011 Rp62,3 trillion; TA. 2012 Rp0,3 trillion; TA. 2013 Rp0,1 trillion).
There was a change in the nomenclature of tourism and creative economy functions in 2014.
Table 15. Budget realization per expenditure type at the ministry of education, culture, research and technology year 2022
|
No. |
Type of Expenditure |
Budget Realisation |
% |
|
1 |
Employee expenditure |
15.714.840.272 |
62.7 |
|
2 |
Goods expenditure |
15.491.699.016 |
49.52 |
|
3 |
Modal expenditure |
1.110.539.436 |
17.38 |
|
4 |
Social assistance expenditure |
11.982.788.735 |
61.06 |
|
TOTAL |
44.299.867.460 |
Source: Documents of the Ministry of Education, Culture, Research and Technology Year 2022
The Net Enrollment Rate (APM) is the percentage of children in a specific school-age group who are enrolled in the appropriate level of education for their age compared to the total number of children in that school-age group. The Net Enrollment Rate (APM) is the percentage of students with ages related to their respective levels of education from the total population in the same age group. The Net Enrollment Rate (APM) indicates the school participation of the school-age population at a particular level of education. Like APK, the Net Enrollment Rate (APM) is also an indicator of the absorption capacity of the school-age population at each level of education. Compared to APK, APM is a better absorption indicator because APM considers the population's participation in the standard age group at the corresponding level of education.
The Net Enrollment Rate (APM) for a particular level of education is obtained by dividing the number of enrolled students or school-age population at that level of education by the population of the age group associated with that school level—the number of students/population in age group an attending education level h in year t. The data required to calculate APM are the number of the school-age population currently enrolled at a specific level of education and the number of population in the school-age group associated with that level of education.
The provision of education services in Deli Serdang Regency, as seen from the indicators of Gross Enrollment Rate (APK) and Net Enrollment Rate (APM) from 2017 to 2021, shows that the APK for Elementary School (SD) and Junior High School (SMP) is relatively high, still above 100. However, the APM for Elementary School is above 90, and the APM for Junior High School is relatively moderate, below 80. Except for the year 2019, where the APM for Junior High School experienced an increase reaching 88.61. Please refer to the following Tables 16-20.
Table 16. APM and APK for Deli Serdang Regency year 2017
|
Type Level |
Number of Population by Age Group |
Total Number of Students |
Number of Students by Age Group |
APK |
APM |
|
Kindergarten |
137.685 |
110.05 |
110.05 |
79.93 |
0 |
|
Elementary |
221.937 |
246.017 |
211.255 |
110.85 |
95.19 |
|
Junior high school |
96.397 |
103.631 |
77.07 |
107.5 |
79.95 |
|
Senior high school |
96.843 |
83.384 |
58.411 |
86.1 |
60.32 |
Source: Deli Serdang District Education Office, 2023
Table 17. APM and APK of Deli Serdang Regency year 2018
|
Type Level |
Number of Population by Age Group |
Total Number of Students |
Number of Students by Age Group |
APK |
APM |
|
Kindergarten |
136.288 |
43.746 |
43.746 |
32.1 |
0 |
|
Elementary |
224.022 |
245.458 |
212.927 |
109.57 |
95.05 |
|
Junior high school |
94.99 |
104.778 |
76.863 |
110.3 |
80.92 |
|
Senior high school |
92.621 |
85.555 |
61.951 |
92.37 |
66.89 |
Source: Dinas Pendidikan Deli Serdang Regency, 2023
Table 18. APM and APK of Deli Serdang Regency year 2019
|
Type Level |
Number of Population by Age Group |
Total Number of Students |
Number of Students by Age Group |
APK |
APM |
|
Kindergarten |
137.685 |
24.059 |
24.059 |
17.47 |
0 |
|
Elementary |
231.322 |
247.92 |
230.197 |
107.17 |
99.51 |
|
Junior high school |
99.476 |
109.671 |
88.155 |
110.24 |
88.61 |
|
Senior high school |
93.392 |
92.748 |
75.307 |
99.31 |
80.63 |
Source: Dinas Pendidikan Deli Serdang Regency, 2023
Table 19. APM of Deli Serdang Regency year 2019
|
Type Level |
Elementary |
Junior High School |
Senior High School |
University |
|
APM |
95.03 |
70.82 |
67.81 |
17.77 |
Source: BPS-National Sosio Economic Survey 2019
Table 20. APM and APK of Deli Serdang Regency year 2020
|
Type Level |
Number of Population by Age Group |
Total Number of Students |
Number of Students by Age Group |
APK |
APM |
|
Kindergarten |
133.505 |
42.463 |
42.463 |
31.8 |
0 |
|
Elementary |
230.998 |
248.857 |
219.99 |
107.73 |
95.23 |
|
Junior high school |
106.039 |
116.948 |
81.889 |
110.28 |
77.22 |
|
Senior high school |
93.311 |
96.591 |
66.183 |
103.51 |
70.92 |
Source: BPS-National Sosio Economic Survey 2020
For comparison, the data on the Gross Enrollment Rate (APK) and Net Enrollment Rate (APM) in North Sumatra Province during 2017-2021 is presented. The APK and APM of Deli Serdang Regency are the same as the APK and APM of North Sumatra Province. The APK and APM for elementary and junior high schools are above 100, the APM for elementary schools is above 90, and the APM for junior high schools is below 80. Except for the APM in 2019, which reached 84.13. Please refer to the following Tables 21-27.
Table 21. APM and APK Deli Serdang Regency year 2021
|
Type Level |
Number of Population by Age Group |
Total Number of Students |
Number of Students by Age Group |
APK |
APM |
|
Kindergarten |
132.108 |
44.835 |
44.835 |
33.94 |
0 |
|
Elementary |
229.198 |
248.614 |
222.154 |
108.47 |
96.93 |
|
Junior high school |
108.121 |
121.151 |
83.751 |
112.05 |
77.46 |
|
Senior high school |
93.473 |
102.262 |
67.338 |
109.4 |
72.04 |
Source: BPS-National Sosio Economic Survey 2021
Table 22. APM and APK of North Sumatra year 2017
|
Type Level |
Number of Population by Age Group |
Total Number of Students |
Number of Students by Age Group |
APK |
APM |
|
Kindergarten |
1.251.800 |
957.719 |
957.719 |
76.51 |
0 |
|
Elementary |
1.766.500 |
1.910.917 |
1.635.867 |
108.18 |
92.6 |
|
Junior high school |
838.7 |
891.179 |
655.036 |
106.26 |
78.1 |
|
Senior high school |
797.8 |
772.215 |
546.792 |
96.79 |
68.54 |
Source: BPS-National Sosio Economic Survey 2017
Table 23. APM and APK of North Sumatra year 2018
|
Type Level |
Number of Population by Age Group |
Total Number of Students |
Number of Students by Age Group |
APK |
APM |
|
Kindergarten |
1.239.100 |
324,465 |
324,465 |
26,19 |
0 |
|
Elementary |
1.783.400 |
1.874.175 |
1.621.749 |
105,09 |
90,94 |
|
Junior high school |
835,2 |
883,395 |
645,394 |
105,77 |
77,27 |
|
Senior high school |
800,9 |
777,966 |
570,154 |
97,14 |
71,19 |
Source: BPS-National Sosio Economic Survey 2018
Table 24. APM and APK of North Sumatra year 2019
|
Type Level |
Number of Population by Age Group |
Total Number of Students |
Number of Students by Age Group |
APK |
APM |
|
Kindergarten |
1.251.800 |
231.024 |
231.024 |
18.46 |
0 |
|
Elementary |
1.785.400 |
1.864.579 |
1.722.728 |
104.43 |
96.49 |
|
Junior high school |
846.7 |
897.007 |
712.35 |
105.94 |
84.13 |
|
Senior high school |
810.1 |
819.246 |
657.869 |
101.13 |
81.21 |
Source: BPS-National Sosio Economic Survey 2019
Table 25. APM and APK of North Sumatra year 2020
|
Type Level |
Number of Population by Age Group |
Total Number of Students |
Number of Students by Age Group |
APK |
APM |
|
Kindergarten |
1.213.800 |
332.424 |
332.424 |
27.38 |
0 |
|
Elementary |
1.782.900 |
1.836.034 |
1.622.525 |
102.98 |
91 |
|
Junior high school |
860 |
922.084 |
654.44 |
107.21 |
76.09 |
|
Senior high school |
809.4 |
850.849 |
596.448 |
105.12 |
73.69 |
Source: BPS-National Sosio Economic Survey 2020
Table 26. APM and APK of North Sumatra year 2021
|
Type Level |
Number of Population by Age Group |
Total Number of Students |
Number of Students by Age Group |
APK |
APM |
|
Kindergarten |
1.201.100 |
333.564 |
333.564 |
27.77 |
0 |
|
Elementary |
1.769.000 |
1.797.062 |
1.600.678 |
101.59 |
90.48 |
|
Junior high school |
870.4 |
927.715 |
652.259 |
106.58 |
74.94 |
|
Senior high school |
810.8 |
860.121 |
588.056 |
106.08 |
72.53 |
Source: BPS-National Sosio Economic Survey 2021
Table 27. National APM and APK year 2017
|
Type Level |
Number of Population by Age Group |
Total Number of Students |
Number of Students by Age Group |
APK |
APM |
|
Kindergarten |
19.234.500 |
14.286.756 |
14.286.756 |
74.28 |
0 |
|
Elementary |
27.843.400 |
29.484.359 |
25.899.030 |
105.89 |
93.02 |
|
Junior high school |
13.440.400 |
13.719.808 |
10.347.675 |
102.08 |
76.99 |
|
Senior high school |
13.305.400 |
11.568.351 |
8.476.028 |
86.94 |
63.7 |
Source: BPS-National Sosio Economic Survey 2017
Table 28. National APM and APK year 2018
|
Type Level |
Number of Population by Age Group |
Total Number of Students |
Number of Students by Age Group |
APK |
APM |
|
Kindergarten |
19.214.227 |
7.464.748 |
7.464.748 |
38.85 |
0 |
|
Elementary |
28.125.600 |
29.120.793 |
25.858.831 |
103.54 |
91.94 |
|
Junior high school |
13.485.000 |
13.601.467 |
10.190.924 |
100.86 |
75.57 |
|
Senior high school |
13.359.500 |
11.830.024 |
8.969.816 |
88.55 |
67.14 |
Source: BPS-National Sosio Economic Survey 2018
Table 29. National APM and APK data for 2019
|
Type Level |
Number of Population by Age Group |
Total Number of Students |
Number of Students by Age Group |
APK |
APM |
|
Kindergarten |
19.181.901 |
6.240.599 |
6.240.599 |
32.53 |
0 |
|
Elementary |
28.339.300 |
29.329.969 |
26.322.125 |
103.5 |
92.88 |
|
Junior high school |
13.600.400 |
13.780.237 |
10.500.998 |
101.32 |
77.21 |
|
Senior high school |
13.398.700 |
12.450.655 |
9.511.615 |
92.92 |
70.99 |
Source: BPS-National Sosio Economic Survey 2019
Table 30. National APM and APK data for 2020
|
Type Level |
Number of Population by Age Group |
Total Number of Students |
Number of Students by Age Group |
APK |
APM |
|
Kindergarten |
18.976.000 |
7.622.000 |
7.622.000 |
40.16 |
0 |
|
Elementary |
28.495.700 |
29.241.826 |
26.379.619 |
102.61 |
92.57 |
|
Junior high school |
13.739.500 |
13.990.973 |
10.387.306 |
101.83 |
75.6 |
|
Senior high school |
13.414.500 |
12.815.393 |
9.213.005 |
95.53 |
68.67 |
Source: BPS-National Sosio Economic Survey 2020
Table 31. National APM and APK data for 2021
|
Type Level |
Number of Population by Age Group |
Total Number of Students |
Number of Students by Age Group |
APK |
APM |
|
Kindergarten |
18.880.700 |
7.545.119 |
7.545.119 |
39.96 |
0 |
|
Elementary |
28.619.100 |
28.829.725 |
26.282.897 |
100.74 |
91.84 |
|
Junior high school |
13.842.700 |
14.136.974 |
10.538.050 |
102.13 |
76.13 |
|
Senior high school |
13.459.400 |
13.125.333 |
9.273.640 |
97.52 |
68.9 |
Source: BPS-National Sosio Economic Survey 2021
Furthermore, for comparison, the data on the National Gross Enrollment Rate (APK) and Net Enrollment Rate (APM) in Indonesia from 2017-2021 is presented. The APK and APM of Deli Serdang Regency are close to the national APK and APM. The national APK for elementary and junior high schools is above 100, the APM for elementary schools is above 90, and the APM for junior high schools is below 80. Please refer to the following tables. The success of the Deli Serdang Regency Government in improving the Gross Enrollment Rate (APK) and Net Enrollment Rate (APM) of elementary and junior high schools is due to the support of the bureaucracy in the Deli Serdang Regency Education Office from the Regency level to the sub-Regency level and the schools themselves (Tables 28-31 above).
3.4 Perception of education services
In order to understand the public's perception of education services in Deli Serdang Regency, interviews were conducted with several informants. The informants mainly consisted of community figures, especially education figures in Deli Serdang Regency, and school principals (elementary and junior high schools). Several issues emerged from the information provided by the informants regarding education services in Deli Serdang Regency, such as building infrastructure/classrooms/furniture, school facilities, school principals/supervising teachers, teaching staff, budget, and students.
"...regarding facilities or buildings, if there are any issues, the school authorities should first document them, such as minor or major damages. This means that the school principal will report these findings to the relevant department in the infrastructure field. They will then gather data on the school's needs to serve both educational and community needs." (Heriani, Principal of SMPN 2 Kutalimbaru)
"There are no issues with our services. Everything is fine... For example, when it comes to school facilities, we will submit a request to the local government. The local government will then allocate funds through the Local Government Budget. For instance, if the school needs a computer lab, we simply submit the necessary information. Eventually, there will be Special Allocation Funds (DAK) to meet the facilities' needs of each school." (Heriani, Principal of SMPN 2 Kutalimbaru.
According to the informant, fulfilling school facilities, such as computer labs, is acceptable. The school principal can propose the school's needs. Then the Department of Education will plan the budget for the required facilities in the Local Government Budget through Special Allocation Funds (DAK). Elementary schools usually need more facilities for practical laboratories.
Overall, elementary schools are pretty good. However, in recent times, due to the ongoing impact of COVID-19, there have been some disruptions, such as the lack of face-to-face interactions, which can reduce children's interest in learning. As for non-educational aspects, I need to be made aware because it is more within the school's internal matters. In terms of facilities, elementary schools lack practice rooms and labs that support children's learning. Regarding budget, it is still relatively affordable but aligns with the available facilities." (Fachry, Management of Istiqlal Education Foundation in Deli Tua).
Meanwhile, according to the informant, facilities in private junior high schools are fine. There are no shortages, and the existing facilities can still be used.
The junior high schools are already quite good. However, due to the COVID-19 pandemic, the learning process has been less effective because students still need more interactions with their peers. By 'limited interactions,' I mean they are no longer sitting close together, and the teaching time has become longer as they split the learning into two sessions. In terms of facilities, they are adequate with no shortcomings. As for the budget, it can still be tolerated considering the available facilities. (Fachry, Management of Istiqlal Education Foundation in Deli Tua).
According to the informant, a community leader, public schools still have better facilities than private schools. They mentioned that private elementary schools use public school buildings in Deli Serdang. Similarly, the local government must continue to pay attention to Islamic boarding schools (Pondok Pesantren). Both private schools and Pondok Pesantren require local government assistance, such as building support, teaching aids, and teachers.
"Yes... it depends on the commitment of the Regional Council (DPRD) and the Regency Government. Where will education in Deli Serdang Regent go without good ethics or goodwill from the Deli Serdang Regent? It should be maximized, just like the facilities still used by public elementary schools. Private and public schools should not be treated as stepchildren and biological children. Therefore, the position of public schools, which is currently at its maximum, must also be accompanied by political will for formal schools, such as Islamic boarding schools (Pondok Pesantren). This education and training sector receives no support or allowances from the Deli Serdang Regency. Until today, those assistance programs for private schools have been completely stagnant, with a minimal budget and excessive bureaucracy. The bureaucracy is overly convoluted, making it difficult to achieve maximum or optimal results in education, especially in building facilities and teaching aids. This causes a teacher shortage in both private and public schools. Furthermore, as mentioned earlier, the budget is minimal. However, if the Regency Government or the Regional Council allocates 20%, the plantations and natural resources in Deli Serdang's assets could cover the existing education needs. They could cover all aspects of education in Deli Serdang." (Kurnia Hidayat, Community Leader).
Informant Community Leaders suggest that private schools should be allowed to utilize the land previously owned by PTPN 2 (a state-owned plantation company). The PTPN 2 should transfer the land to private schools, enabling them to receive central and regional government assistance.
"Yes, this caused the plantation lands to provide access, especially to private schools. Almost ten private schools are located in the Sunggal Regency. Today, PTPN did not release any land to be managed by private parties. Is there any goodwill from the Regency Government to recommend that private parties manage the land for educational development? Do not just side with entrepreneurs but also with education practitioners, the driving force behind education. The plantation company or PTPN should fully hand over the land. What is the benefit? The assistance process from the State or the central government can be directly channeled. Especially in Percut Sei Tuan, the Sunggal Regency, and Hamparan Perak, Labuhan Deli. Many private schools there need financial support from the central government. Why? Because they are constrained by the domicile, the land ownership, especially the PTPN lands. The principal permit should be given to private parties to manage education. Why? Almost dozens of schools could contribute to the nation's intellectual development. However, is there goodwill to grant permits to establish private schools? This is what needs to be maximized. So what happens? Good governance occurs when private parties, entrepreneurs, and the government can collaborate synergistically to advance education. The PTPN should release the land to private parties. Why? So that these assistance programs are not cut off due to domicile constraints, namely the inability to release the land. It is as if the PTPN is closing the opportunity for our schools to progress and maximize their potential. Why? So that private education management can be optimal and maximal, especially in plantation areas." (Kurnia Hidayat, Community Leader).
Program for enhancing the role of political parties and educational institutions through political education and the development of ethics and political culture, including the formulation of technical policies (work programs and policy implementation) and the consolidation of implementation (coordination) in the fields of political education, ethical culture, democracy enhancement, facilitation of government institutions, representation, and political parties, general elections/local elections, as well as political situation monitoring.
Meanwhile, the program for empowering and supervising community organizations includes formulating technical policies (policy implementation) and consolidating implementation in the empowerment and supervision of community organizations. Policy implementation includes registration of social organizations, empowerment of social organizations, evaluation and mediation of social organization disputes, and supervision of social organizations and foreign social organizations in the region. Coordination is also implemented in the fields of registration of social organizations, empowerment of social organizations, evaluation and mediation of social organization disputes, and supervision of social organizations and foreign social organizations in the region.
However, the allocation and realization of expenditures for the Department of National Unity and Politics in Deli Serdang Regency have yet to prove insufficient to address political unrest in the area. This can be seen from various reports in online media concerning protests, particularly related to education services in Deli Serdang Regency. As mentioned earlier, several mass organizations, civil society organizations, and political parties are involved in questioning education policies in Deli Serdang Regency. Some of them include the Indonesian Muslim Students Alliance (AMIN) of North Sumatra, Islamic Student Union (KMI), Khobar Cares for the People of North Sumatra, North Sumatra Anti-Corruption Student Action Front, TOPAN (National Asset Rescue Operational Team) NGO, FORAK (Anti-Corruption Forum), DPP Pujakesuma (Eko Sopianto's version). Eko Sopianto is the Chairman of the PDI Perjuangan Regional Board in Deli Serdang Regency, Sumatra, Education and Civil Servant Observing Institution (LPPA) of North Sumatra, Education Concerned Community Movement, and the People's Movement against Corruption (GERAMS).
The research findings can be summarized as follows: Firstly, the expenditure on the education sector has consistently grown over the last four years (2017-2020), highlighting the government's continued emphasis on the Basic Education sector (elementary and junior high school) as a policy priority. Second, mandatory spending on the Education sector is still primarily focused on Education Personnel (teachers) while spending on Education Infrastructure (physical/buildings) has received less attention than Education Personnel (teachers). The increase in Education Personnel (elementary and junior high school teachers) expenditure in Deli Serdang Regency is viewed as a service sector with measurable outputs, even if it is not easily visible to the public (low visibility). However, it continues to provide political incentives to the government (regional government). The provision of measurable service outputs will facilitate control and encourage higher budget allocations for the central government.
Meanwhile, observers view the increase in infrastructure spending on school buildings (elementary and junior high schools) in Deli Serdang Regency as a service sector with measurable outputs easily visible to the public (high visibility). As a result, educational infrastructure (elementary and junior high schools) remains a priority for the government. The government is working to increase funding for educational infrastructure. Measurable educational service outputs will help control and encourage larger budget allocations. The leadership of Deli Serdang Regency has effectively built power relations, which involve convincing others to work together towards a common goal. This leadership has successfully governed the region for almost 20 years after the reform, establishing a foundation of effective leadership. The leadership in Deli Serdang Regency established political relations not solely for personal interests but to promote sustainable regional development. Undoubtedly, building power relations cannot be separated from the social conditions of the people in Deli Serdang Regency, who seek a populist and charismatic leader with strong leadership qualities.
The Tambunan Family has constructed a powerful relationship model based on kinship, resulting in widespread obedience to their leadership. As a result, the Tambunan Family functions like a small kingdom, utilizing informal power in their operations. The community's emotional connection with the Tambunan Family further reinforces their political interests. This culture of subordination marks the relationship between the Tambunan Family and the community, extending to the relationship between the community and the Deli Serdang Regency Government, which the Tambunan Family leads.
[1] Crouch, H. (1982). Perkembangan Ekonomi & Modernisasi. Jakarta: Yayasan Pengkhidmatan.
[2] Delay, S., Lamb, D., Devas, N. (1995). Funding system for daerah percontohan report to the government of Indonesia, development administration group, University of Birmingham. Development Administration Group, University of Birmingham, Report to the Government of Indonesia.
[3] Devas, N., Binder, B., Davey, K., Booth, A. (1989). Keuangan Pemerintah Daerah di Indonesia. Jakarta: UI Press.
[4] Haryatmoko. (2002). Kekuasan melahirkan Anti Kekuasaan. J. Basis No 01- 02 Year Ke-51 Januari-Februari 2002.
[5] Rohdewohld, R. (1995). Public Administration in Indonesia. Melbourne: Montech Pty Ltd.
[6] Tamin, F. (1998). Reformasi dan Reorientasi Paradigma Otonomi Daerah. Makal. Semin. HMI Cab. Malang.
[7] Kuncoro, M. (2004). Otonomi dan Pembangunan Daerah. Jakarta: Penerbit Erlangga.
[8] Saragih, J.P. (2003). Desentralisasi Fiskal dan Keuangan Daerah dalam Otonomi. Jakarta: Penerbit Ghalia Indonesia.
[9] Kaho, J.R. (1997). Prospek Otonomi Daerah di Negara Republik Indonesia: Identifikasi Beberapa Faktor yang Mempengaruhi Penyelenggaraannya. Jakarta: PT Raja Grafindo Persada.
[10] Kaho, J.R. (2010). Otonomi Daerah di Negara Republik Indonesia: Identifikasi Faktor-Faktor yang Mempengaruhi Penyelenggaraan Otonomi Daerah. Jakarta: Rajawali Pers, 2010.
[11] Kaho, J.R. (2011). Prospek Otonomi Daerah di Negara Republik Indonesia, Identifikasi Beberapa Faktor yang Mempengaruhi Penyelenggaraannya. Jakarta: Raja Grafindo Persada.
[12] Darumurti, K.D., Rauta, U. (2000). Otonomi Daerah Perkembangan Pemikiran dan Pelaksanaan. Bandung: PT. Citra Aditya Bakti.
[13] Hanan, D. (2014). Menakar Presiden-sialisme Multipartai di Indonesia: Upaya Mencari Format Demokrasi yang Stabil dan Dinamis dalam Konteks Indonesia. Bandung: Mizan Media Utama.
[14] KPPOD. (2009). Sewindu Otonomi Daerah: Perspektif Ekonomi. Jakarta: Komite Pemantauan Pelaksanaan Otonomi Daerah.
[15] Alamsyah. (2011). Karakteristik Universal Pelayanan Publik: Sebuah Tinjauan Teoritik. Jurnal Borneo Administrator, 7(3): 353-371. https://doi.org/10.24258/jba.v7i3.80
[16] Rinaldi, T., Purnomo, M., Damaiyanti, D. (2007). Memerangi Korupsi di Indonesia Yang Terdesentralisasi: Studi Kasus Pananganan Korupsi Pemerintah Daerah. World Bank: Justice for the Poor Project.
[17] Wibowo, P. (2008). Mencermati dampak desentralisasi fiskal terhadap pertumbuhan ekonomi daerah. Jurnal Keuangan Publik, 5(1): 55-83.
[18] Khusaini, M. (2006). Ekonomi Publik: Desentralisasi Fiskal dan Pembangunan Daerah. Malang: BPFE Unibraw.
[19] Ladjin, N. (2008). Analisis Kemandirian Fiskal di Era Otonomi Daerah. Studi Kasus di Provinsi Sulawesi Tengah.
[20] Aslym, A. (1999). Beberapa Aspek Dalam Pelaksanaan Otonomi Daerah. Makal. Semin. Lustrum MEP–UGM Yogyak.
[21] Hirawan, B.S. (2007). Desentralisasi Fiskal Sebagai Suatu Upaya Meningkatkan Penyediaan Layanan Publik (Bagi Orang Miskin) di Indonesia. The Pidato Upacara Pengukuhan Sebagai Guru Besar Tetap Dalam Bidang Ilmu Ekonomi pada Fakultas Ekonomi Universitas Indonesia, Universitas Indonesia, Jakarta.
[22] Adisasnita, R. (2006). Pembangunan Perdesaan dan Perkotaan. Yogyakarta: Graha Ilmu.
[23] Bahl, R. (2008). Modul Tinjauan Dampak Kebijakan Desentralisasi Fiskal bagi kemampuan Keuangan dan Pertumbuhan Ekonomi Daerah. Pusat Pendidikan dan Pelatihan Kekayaan Negara dan Perimbangan Keuangan Badan Pendidikan dan Pelatihan Keuangan.
[24] Bahl, R., Linn, J.F. (1992). Urban Public Finance in Developing Countries. Oxford: Oxford University Press for the World Bank.
[25] Bird, R., Vaillancourt, F. (1998). Desentralisasi Fiskal di Negara-negara Berkembang: Tinjauan Umum, dalam Richard Bird dan Francois Vailancourt, Desentralisasi Fiskal di Negara-Negara Berkembang. Jakarta: Gramedia Pustaka Utama.
[26] Gramlich, E.M. (1993). A policymaker's guide to fiscal decentralization. National Tax Journal, 46(2): 229-235.
[27] Oates, W.E. (1993). Fiscal decentralization and economic development. National Tax Journal, 46(2): 237-243.
[28] Woller, G.M., Phillips, K. (1998). Fiscal decentralisation and LDC economic growth: An empirical investigation. The Journal of Development Studies, 34(4): 139-148.
[29] Zhang, T., Zou, H.F. (1998). Fiscal decentralization, public spending, and economic growth in China. Journal of Public Economics, 67(2): 221-240. https://doi.org/10.1016/S0047-2727(97)00057-1
[30] Lewis, B.D. (2005). Indonesian local government spending, taxing and saving: an explanation of Pre-and Post-decentralization Fiscal Outcomes. Asian Economic Journal, 19(3): 291-317. https://doi.org/10.1111/j.1467-8381.2005.00214.x
[31] Warsito. (2007). Dinamika Administrasi Publik Analisis Empiris Seputar Isu-Isu Kontemporer dalam Administrasi Publik. Yogyakarta: Pustaka Pelajar dan Program Magister Administrasi Publik UGM.
[32] Ndadari, L.W., Adi, P.H. (2008). Perilaku Asimetris Pemerintah Daerah Terhadap Transfer Pemerintah Pusat. In The 2nd National Conference UKWMS, p. 24.
[33] Dye, T.R. (1992). Understanding Public Policy. USA: Prentice-Hall, INC., Englewood Cliffs, NJ.
[34] Mainwaring, S. (1989). Institutional dilemmas of multiparty presidential democracy: The case of Brazil. In Paper for the XV International Congress of the Latin American Studies Association.
[35] Batley, R., Mcloughlin, C. (2015). The politics of public services: A service characteristics approach. World Development, 74: 275-285. https://doi.org/10.1016/j.worlddev.2015.05.018
[36] Halim, A. (2001). Manajemen Keuangan Daerah. Yogyakarta: AMP YKPN. Yogyakarta: AMP YKPN.
[37] Lijphart, A. (1984). Democracies: Patterns of Majoritarian and Consensus Government in Twenty-One Countries. London: New Haven.
[38] Badrudin, R. (2011). Ekonomika Otonomi Daerah. Yogyakarta: UPP STIM YKPN.
[39] Rochjadi, A. (2006). Tinjauan Pelaksanaan Hubungan Keuangan Pusat dan Daerah Tahun 2004-2005. Jakarta: Kementerian Keuangan.
[40] Koswara, E. (2001). Otonomi Daerah: Untuk Demokrasi dan Kemandirian Masyarakat. Jakarta: Yayasan Pariba.
[41] Kaelani, H. (2012). Metode Penelitian Kualitatif Interdisipliner Bidang Sosial, Budaya, Filsafat, Seni, Agama dan Humaniora. Yogyakarta: Penerbit Paradigma.