Rafal Ahmed Abbas Ali![]() | Teba Tariq Khaled*
| Teba Tariq Khaled*![]() | Eman Abdulhasan Mohammed
| Eman Abdulhasan Mohammed![]() | Qais S. Banyhussan
| Qais S. Banyhussan![]() | Rwayda Kh. S. Al-Hamd
| Rwayda Kh. S. Al-Hamd![]()
© 2024 The authors. This article is published by IIETA and is licensed under the CC BY 4.0 license (http://creativecommons.org/licenses/by/4.0/).
OPEN ACCESS
The geographic zone of this research is Falluja City, which is described by its overpopulation and absence of fast roadways. This zone is confronting a low level of service amid the time of overcrowding stemming from a disorganized and weak road system. This research has been conducted by suggesting the development of another street corresponding to the current one (bypass), yet with better expectations. The improvement of the road to be studied will improve the environmental aspect in addition to reducing the operating costs of vehicles. This study is planned to assess the achievability of developing a street for the bypass of the Falluja highway, environmentally and economically. This exploration depends on the speculation that the current street displays a relatively extreme situation, though the recommended roadway could be an asphaltic road pavement of top-notch condition. The traffic information was gathered utilizing a manual counting technique during seven days in the period (7:00 am-4:00 pm) to evaluate the average daily traffic (ADT) and peak hour traffic volume (PHV). Also, the number of lanes needed for LOS (C) was resolved. The development and conservation expenses of the street were likewise determined. The decrease in roadway client expenses for the current and suggested roads was assessed as a benefit. The monetary examination is conducted by equalizing the total decreased roadway costs and their benefits to the foundation year. The improvement in the roadway pavement status meant by IRI has enhanced the PCI value thusly, prompting reducing discharges within which reduces the overall discharges. The normal decrease in discharge was 1.13% because of the enhancement of pavement conditions. The accepted reduction rate for the research was assumed to be 8%. To find financial reasonability, numerous criteria were checked such as Net Present Value (NPV), Benefit-Cost Ratio (B/C), and Internal Rate of Return (IRR). For financial criteria, the results indicated that NPV was of an empowering estimation of 8761711 US$, which infers those benefits are more significant than expenses. Moreover, the B/C ratio was 1.370, contrasted with 1.0, which is encouraging. Ultimately, the determined IRR was discovered to be more prominent than the assumed value of 8% as recommended in road construction projects. The reduction in carbon monoxide (CO), carbon dioxide (CO2), nitrogen dioxides (NO2), and sulfur dioxide (SO2) are 0.367, 0.275, 0.348, and 0.339, respectively.
Internal Rate of Return, Net Present Value, economic assessment, feasibility study, Benefit-Cost Ratio, Falluja City, roadway infrastructure, traffic volume
The consideration of the costs of roadway development, conservation, and vehicle activity is significant for the recent management and planning of highway investments. At the same time, the costs of road development and maintenance tasks an outsized measure of public assets, and expenses endured by the community utilizing the roadway for the use and deterioration of vehicles remain more significant. It is essential to such an extent that highway rules consider the total costs of transportation. Consequently, measurable techniques for anticipating the costs and performance of both roads and vehicles over colossal and various roadway networks might be required [1]. Roadways are the main infrastructures that support the financial and public welfare of the community. Consequently, it is fundamental to suitably plan the roadway system so the capability and well-being of the public will be improved. The state of asphalt pavement can decay considering the impact of traffic movement and the environment. Along these lines, maintenance efforts are needed to improve the roadway status during its useful life. To conduct preservation exercises less, it is crucial to have a system dependent on accurate road status data. One of the roadway status contemplations that might be familiar with the management of the asphalt pavement status is the irregularity of pavement surface that might be stated in the International Roughness Index (IRI) estimates [2]. The subject of limiting the long-run advantages and expenses has been generally referenced in the literature. Notwithstanding, it is yet concealed plainly and exhaustively. A little arrangement is realized on issues such as what should be discounted or the choice of a rebate rate. A segment of this issue is based on the reality that followers of various strategies for discounting are frequently unsure regarding what they are expanding, or what job the rebate rate is acceptable to carry on [3].
When a country’s incomes are in some cases, insufficient, challenges corresponding to the importance of specific transport projects and the authenticity of a few potential choices appear regularly. Accordingly, it is somewhat confounded to consider all transport structure project relationships. The environmental impacts forlorn are complex and varied, considering air and noise contamination, the impact on the environment, and the living conditions of the people. The unpredictability of these considerations requires the use of complex procedures and evaluation devices [4].
The cost decrease of vehicle use, travel time, and roadway conservation has an extraordinary role in improving the sustainability of pavement through the reservation of the material sources and reducing the discharge of gases brought about by the processing of subsidiary yields [5]. Vast research efforts have recently been devoted to assessing and evaluating the assets in projects. The traditional monetary idea proposes the Net Present Value (NPV) hypothesis, using the expense of wealth depending on the imbued project hazards. The NPV premise has been reprimanded because it can't deal with the possible adaptability that emerges with project investing, producing varieties in the initial income standard [6]. The effect of dynamic pace operation on traffic-related emissions was investigated [7].
They analyzed the traffic emissions resulting from changes in vehicles' speed using a rapid discharge model combined with a roadway traffic repetition simulation. The findings revealed that while speed adjustments effectively reduced the average speed of roadway traffic, their influence on vehicle emissions remained uncertain. The simulation model indicated that repeated variations in traffic speed within the roadway system significantly mitigated the impact of reduced average speed on emissions [7]. Routinely, the characterization and need of roadway segments for maintenance exercises in numerous developing nations depend completely on the experience and choice of the highway designers and rehabilitation staff. However, as a result of the mediation and compound associations of the impacts involved in asphalt pavement deteriorating, this technique is inadequate, prone to errors, and may lead to unsuitably arranged maintenance activities. It is discouraging to see that most roadways in these countries are of reduced status and a considerable lot of them are risky and cause monetary exhaustion [8-10].
Locally, few examinations identified with environmental and economic evaluation have been accomplished. Certain research considered the enhancement of the unpaved roadways by developing another roadway over the former one which has an awful status [11]. while research [12] dealt with the construction of a new roadway that has a superior surface status. The environmental and economic assessment related to boosting and enlarging the poor surface status is accomplished [10].
This study aimed to assess the environmental and economic viability of constructing the Falluja bypass roadway. Its purpose was to provide decision-makers with a thorough evaluation to determine whether developing an alternate roadway is appropriate. The study considered all factors impacting the overall project costs. Specifically, it focused on evaluating the economic feasibility to guide decision-makers in making informed choices that align with financial realities and yield positive outcomes.
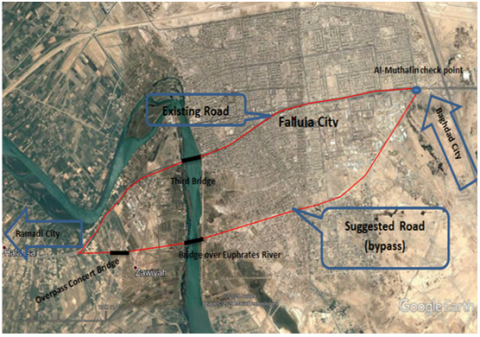
Falluja is a major city in Anbar territory close to Baghdad city. This city is about 60 km to the northwest of Baghdad. The approximate population of Falluja City is about (338272) people in 2014. A high populace density region and the absence of high-speed roadways describe the geographical zone of the study area. The roadway system in the chosen study region is of an ineffective traffic stream because of the extremely restricted alternatives for the drivers to arrive at the objective destination. The roadway pavement status of this road is presently demonstrated by cracks, ruts, potholes, and depressions, causing the bad characteristics of riding. Road pavement performance has been progressed subjectively frequently for the roadway in the inquiry, leading to recurrent improvised and costly maintenance actions. The principal roadway in the study area intervenes in Falluja city with a length of 7.8 km. As indicated by the certain traffic and geometric attributes study in the region, the roadway comprises 6 paths for both ways that work with a service level (LOS F). The proposed bypass route is 8.0 km long with a bridge across the Euphrates River. The roadways above and the intersection can be seen in Figure 1.
Figure 1. The suggested route of the roadway in the study region
As referenced already, the investigation region is confronting an unfavorable service level through the congestion of traffic coming about because of an ineffective roadway network. Therefore, traffic research has been conducted by recommending the building of an alternative roadway corresponding to the current one, however, with higher requirements. The fundamental point of the current study is to assess the economy evaluated as Net Present Value (NPV) Benefit-Cost Ratio (B/C) and Internal Rate of Return (IRR). The environmental feasibility of developing the Falluja bypass roadway (recommended road), the International Roughness Index (IRI), and the Pavement Condition Index (PCI) are two of these markers. Furthermore, the commitment of this research is to provide a suggestion judgment for the decision-makers to construct or not. This research depends on the assumption that the current roadway has a severe status, though, the proposed one is with decent conditions. In this study, the B/C ratio and other economic parameters will be evaluated. The IRI index is used to compare current and proposed road conditions.
Asphalt pavement status assessment should be directed regularly to characterize the present behaviour of pavement and forecast the forthcoming behaviour, regardless of whether the roadway pavement has fulfilled its four fundamental roles, which are: to convey viable service level, to provide security, and has a fundamental capacity to bear the loads from traffic movement and the impact of the environment [13].
The inconsistency of the roadway pavement is the most regularly used status feature to assess pavement status quantitatively. The irregularity information of the roadway pavement is relatively easy to acquire, well associated with viable vehicle usage expenses, and the most related status feature in roadway functional status estimation in the long term [14]. The IRI is known as the connection between the accumulation of the ordinary vertical traffic of the vehicles (mm) and the travelled distance by the same vehicle during the measuring process (m). Table 1 shows the fundamentals of pavement status depending on the IRI values of roadway pavement [2].
Table 1. The fundamentals of pavement status depend on IRI values [2]
|
IRI Estimation |
Pavement Status |
|
IRI<4 |
Good |
|
4 ≤IRI≤8 |
Fair |
|
8≤IRI≤12 |
Bad |
|
IRI>12 |
Poor |
A significant challenge for roadway engineers is to provide information for the planning and design of a particular transportation network or to check the viability of a current transportation network. These data apply affordable and exact design guidelines and achieve the network's objective of conveying productive and safe transportation to individuals and cargo. This matter may be a critical piece of many studies [15]. To decide the roadway status impediments, data out and about the roadway surface under examination were assembled during the daytime (7:00 am-4:00 pm) for 7 continuous days to determine the peak hour volume (PHV), which is the design hourly volume (DHV) in the investigation and the computations have been accomplished, and to acquire a complete representation of traffic and pavement status under the ambient climatic status. The traffic data survey was arranged into two primary classifications: vehicles which are denoted as passenger cars (PC) and minibusses which have the equivalent characteristic of (PC) in consideration of vehicle operation costs (VOCs), and heavy vehicles (HV). The peak hour volume on this road was (2856) veh./hr which indicated the hourly design volume (DHV). The survey data of traffic showed that the traffic was classified into 65% passenger cars, 5% minibusses, and 30% heavy trucks. Besides, the main types of heavy vehicles in the study area were Type 3-S2 and Type 3 with 10% and 20%, separately. Truck Type 3 embodies the medium vehicles (Mv), while truck Type 3-S2 is accepted as a large truck (Lt). The gathered data were analyzed, and the assessed target year traffic volume was set up utilizing a growth rate of 3% (the growth rate calculation, computed by taking the current population size and subtracting the previous population size according to the Iraqi highway design manual) with an analysis time of 22 years, 20 years as a design life, and 2 years as a construction period. The required number of lanes was identified as per the Highway Capacity Manual (HCM) methods (TRB, 2000). Six paths for the two directions are proper to arrive at a (C) service level. The suggested roadway is delegated as A6/33 with a 3.75m path width as indicated by the necessities of the Iraqi determinations [16-18]. The suggested roadway incorporates a bridge that needs to be built over the Euphrates River with two overpasses. The average daily traffic (ADT) is calculated consistent with Eq. (1) and annual average daily traffic (AADT) is determined by using Eq. (2) [19].
$\mathrm{ADT}=\frac{\mathrm{DHV}}{\mathrm{K}}$ (1)
AADT $=$ ADT $\times 365$ (2)
As expressed [20], and after the achievement of the surveillance study, the current roadway status is poor. The characteristics of this roadway are shown in Table 2.
Table 2. The characteristics of the current roadway with unit costs [20]
|
|
IRI [m/km] |
Average IRI Influence Speed [km/h] |
Fuel Consumption [l/km] |
Tire Life [1000km] |
Oil Consumption [lx1000km] |
Fuel Cost [US\$/l] |
Tire Cost [US\$/Tire] |
Oil Cost [US\$/l] |
The Average Number of Tires/Vehicle |
|
Passenger car |
6 |
65 |
0.079 |
27.8 |
2.45 |
0.35 |
30 |
5 |
4 |
|
Medium truck |
6 |
50 |
0.179 |
27.8 |
3.97 |
0.2 |
200 |
3 |
8 |
|
Large truck |
6 |
40 |
0.217 |
27.8 |
6.05 |
0.2 |
200 |
3 |
16 |
Table 3. The attributes of the suggested roadway with unit costs [20]
|
|
IRI [m/km] |
Average IRI Influence Speed [km/h] |
Fuel Consumption [l/km] |
Tire Life [1000km] |
Oil Consumption [lx1000km] |
Fuel Cost [US\$/l] |
Tire Cost [US\$/Tire] |
Oil Cost [US\$/l] |
The Average Number of Tires/Vehicle |
|
Passenger car |
4 |
100 |
0.075 |
40.7 |
2.15 |
0.35 |
30 |
5 |
4 |
|
Medium truck |
4 |
80 |
0.143 |
40.7 |
3.67 |
0.2 |
200 |
3 |
8 |
|
Large truck |
4 |
60 |
0.16 |
40.7 |
5.75 |
0.2 |
200 |
3 |
16 |
Notwithstanding the referenced units of expenses of the usage of vehicles, conservation expense for passenger cars can be expressed as 30% of the value of a vehicle with 250,000 km lifetime and about 500,000 km lifetime for heavy vehicles. Also, the accepted vehicle expenses are 10,000 US\$ for passenger cars and 50,000 US\$ for heavy trucks. The central point of this study is to assess the financial viability of the proposed roadway by computing the advantages coming from the client’s expense savings (for example, the variances in expenses between the current and the proposed roadway status) and the expenses needed to build the recommended roadway. As expressed [20], the sort of recommended roadway pavement that could be delegated as a decent pavement status with a low International Roughness Index (IRI), has appeared in Table 3. Considering this sort of roadway status, the vehicle conservation expenses are accepted to be equivalent to 15% of the vehicle cost with similar vehicle costs expressed above [21, 22].
The financial practicality investigations of roadway projects comprise contrasting their expenses with their incomes (advantages). It was found that the mileage done per year by the vehicle, and the roughness of the road directly affect both the said parameters. Further, the cost of replacement and vehicle age are some other parameters that can be used to fine-tune the results for vehicle operating costs. Another aspect is the road terrain (rise and fall, curvature, etc.) has a major effect on VOC, which is reflected in the above results. Its purpose ought to be clear for the decrease rate to be utilized practically. It is prescribed that a particular project may provide greater net advantages than other decrease rates. This technique helps in merging distinctive suggested procedures for computing the decrease rate [3, 23].
6.1 Costs
6.1.1 Construction considerations
Schoon [24] states that the principal roadway development expenses are earthworks, bridges, land acquisition, paving works, and drainage systems. For bridges and roadways, the costs comprise initial development costs in which the overall expenses include planning, design, and engineering work. Maintenance is another kind of cost that is devoured amid the service life of a specific roadway [24]. In this study, the sort of recommended roadway is intended to be A6/33. Moreover, the embankment profundity containing asphalt pavement and sub-base courses is decided to be 1.5 m. The overall development expenses are calculated as shown in Table 4. The whole road conservation cost is thought to be 0.8% of the overall development cost [25]. This statement depends on the experiences of certain current roadways having similar characteristics [26].
Table 4. The expected expenses of the suggested roadway
|
|
Road Development |
Bridge |
Design |
Total |
|
Cost (US\$) |
13,333,333 |
10,833,333 |
500,000 |
24,666,666 |
6.1.2 Roadway user expenses
The roadway user expenses include vehicle operational costs (VOCs), which might be increased with low service levels (for example, terrible roadway condition, poor or absence of maintenance, and so on) and traveling time costs (TTC) devoured on the travelers and cargo during the origin to a destination trip.
a) Vehicle operational costs (VOCs)
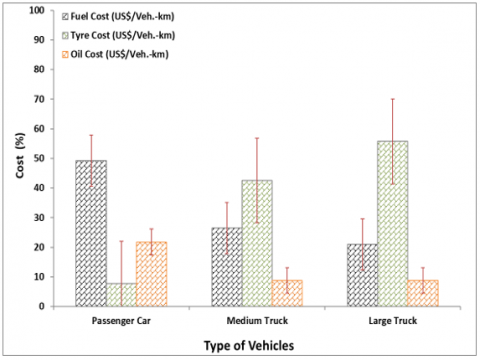
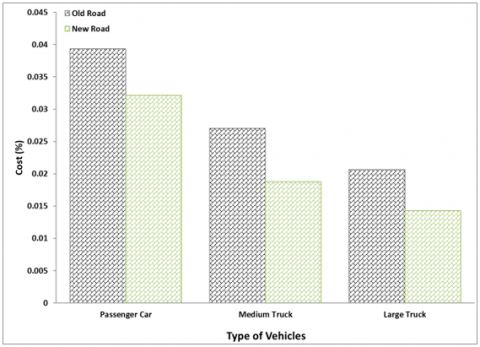
Normally, the main assessed VOCs are tire, fuel, and lubricant expenses. It must be specified that these expenses do not consider all the issues that are typically comprised of the vehicle operational expenses, just those believed to be the most recognized ones by the client. Fuel utilization is generally believed to be an essential component of VOC that is influenced by some features such as roadway status, vehicle characteristics, driving quality, and traffic volume. Since the fuel unit cost in a nation such as Iraq is currently moderate, the related expenses are not predominant as in different circumstances. However, this status might be abruptly adjusted later as indicated by the policy of roadway charging of the users. The overall expenses per kilometer for the present and proposed roadways for a wide range of surveyed vehicles have appeared in Table 5. The average total expenses for the current roadway (ATCE) were reduced because of boosting the roadway status as embodied by the suggested roadway. The total vehicle expenses average is reduced from 0.087 (US\$/vehicle-km) for the present roadway to 0.065 (US\$/vehicle-km) for the suggested roadway. This decrease has been utilized later as an advantage.
The rise in tire expenses compared with fuel and oil expenses for operational expenses is shown in Figure 2. It can be seen that the tire expenses are 7% for passenger car type and 56% for heavy trucks as a fraction of VOC. The VOCs of the current and proposed roadways are shown in Figure 3. This figure displays that the VOCs in the current roadway are greater than that of the proposed one. The reduction in average vehicle operational costs will be significant and have implications for these findings for the feasibility analysis due to the reduction in the annual expenses of the costs of vehicles compared to the expenses in the case of the road in the current situation.
b) Travelling time costs (TTC)
Usually, roadway advancements may impact the escalating in speed, consequently, leading to significant time efficiency for the drivers and travellers who are utilizing the current roadways. This expense saving could be revolved regarding the expenses of driving an additional distance to save time [26]. However, in this investigation, the travelling time expense of the traveller is thought to be 1.2752 US\$/hour-passenger and 0.0184 US\$/hour-ton for cargo [18]. Moreover, the average occupancy rate of vehicles (VOR) in a passenger car should be two people, seven people for small buses versus 1.5 people for heavy trucks. The travelling time needed for driving on the present and proposed roadways could be decided by utilization Eq. (3).
Travel time (hour) $=\frac{\text { road length }(\mathrm{km})}{\text { speed }\left(\frac{\mathrm{km}}{\text { hour }}\right)}$ (3)
Table 5. The supposed vehicle operational expenses per kilometer
|
Fuel Cost (US\$/km) |
Tire Cost (US\$/km) |
Oil Cost (US\$/km) |
Vehicle Maintenance Cost (US\$/km) |
Total Costs (US\$/km) |
Vehicle % |
US\$/Vehicle-km |
|
|
|
The Existing Road |
||||||
|
Passenger car |
0.02765 |
0.004316547 |
0.01225 |
0.012 |
0.056216547 |
70 |
0.03935158 |
|
Medium truck |
0.0358 |
0.057553957 |
0.01191 |
0.03 |
0.135263957 |
20 |
0.027052791 |
|
Large truck |
0.0434 |
0.115107914 |
0.01815 |
0.03 |
0.206657914 |
10 |
0.020665791 |
|
∑Costs |
0.087* |
||||||
|
The Suggested Road |
|||||||
|
Passenger car |
0.02625 |
0.002948403 |
0.01075 |
0.006 |
0.045948403 |
70 |
0.032163882 |
|
Medium truck |
0.0286 |
0.039312039 |
0.01101 |
0.015 |
0.093922039 |
20 |
0.018784408 |
|
Large truck |
0.032 |
0.078624079 |
0.01725 |
0.015 |
0.142874079 |
10 |
0.014287408 |
|
∑Costs |
0.065** |
||||||
|
* The average total costs of the existing road (ATCE) ** The average total costs of the new road (ATCN) *** The percentage of vehicles 70% of passenger cars including 65% PC and 5% of minibus |
|||||||
Figure 2. The expenses of the vehicle operational features for different vehicle types
Figure 3. The vehicle operational expenses of the current and proposed roadways for different vehicle types
Table 6. The average travelling time expenses of the present roadway
|
Average IRI Influence Speed [km/h] |
Travel Time (h) |
Person Per Vehicle |
Ton Per Vehicle** |
Travel Time Costs (US\$/Vehicle) |
Vehicle % |
Travel Time Costs (US\$/Vehicle) |
|
|
|
The Existing Road |
|
|
|
|
|
|
|
Passenger car |
65 |
0.12 |
2 |
0 |
0.306048 |
65 |
0.1989312 |
|
Mini Bus |
65 |
0.12 |
7 |
0 |
1.071168 |
5 |
0.0535584 |
|
Medium truck |
50 |
0.156 |
1.5 |
27 |
0.3758976 |
20 |
0.0751795 |
|
Large truck |
40 |
0.195 |
1.5 |
47 |
0.541632 |
5 |
0.0270816 |
|
∑Costs |
0.35475072 |
||||||
|
|
The Suggested Road |
|
|
|
|
|
|
|
Passenger car |
100 |
0.0800 |
2 |
0 |
0.204032 |
65 |
0.1326208 |
|
Mini Bus |
100 |
0.0800 |
7 |
0 |
0.714112 |
5 |
0.0357056 |
|
Medium truck |
80 |
0.1000 |
1.5 |
27 |
0.24096 |
20 |
0.0481920 |
|
Large truck |
60 |
0.1333 |
1.5 |
47 |
0.370346667 |
10 |
0.03703466 |
|
∑Costs |
0.25355306 |
||||||
|
** Legal total weight permitted on a vehicle in normal process in Iraq SCRB [15] |
|||||||
Table 6 clarifies the average travelling time expenses of the current and proposed roadways, separately, considering the travellers and cargo that are conveyed. The travelling time expenses of the existing roadway are significantly reduced due to the reduction in the time spent travelling by raising the travelling speed that is accomplished by boosting the roadway status. The outcomes expressed that the travelling time expenses were 0.354 US\$/vehicle for the existing roadway contrasted with 0.253 US\$/vehicle for the proposed roadway. Consequently, the advantages obtained from travelling time expense saving could be combined with the advantages of vehicle operational expenses, which were resolved earlier. The savings in vehicle operational costs are summed to the savings in travel time, and then compared to road construction costs.
6.2 Salvage value
Additional advantages that might be associated with the monetary examinations are the salvage value of constructions that might be utilized for parts with a generally long life. The residual value of culverts and bridges after the design life's end of the roadway ought to be taken as an advantage. The design life of steel, concrete, and combined bridges is approximately 80 years other than 50 years for concrete culverts, which is considered more than the planned life of the asphalt pavement (approximately 20 years). Thus, 60% and 75% of the culverts and bridge development expenses might be accepted as salvage value.
The vehicle operational expenses saving alongside the travelling time expenses (TTC) are moved into advantages. This procedure is as per the following:
7.1 The advantages because of VOCs saving
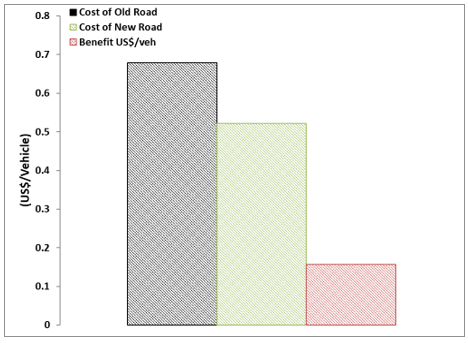
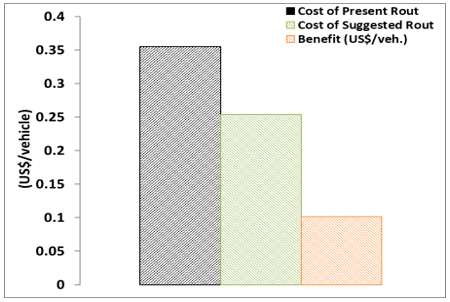
Fuel utilization is generally believed to be an essential component of VOC that is influenced by some features such as roadway status, vehicle characteristics, driving quality, and traffic volume. The advantages in vehicle operational expenses coming about because of the advancement of the present roadway conditions are presented in Figure 4. The overall VOCs of the current roadway with 7.8 km long is 0.679 US\$/vehicle, while the overall VOCs of the proposed roadway with an 8.0 km long is 0.521 US\$/vehicle. In this way, the advantage of VOCs was 0.157 US\$/vehicle.
Figure 4. The advantages resulting from VOC saving between the current and proposed roadways
7.2 The advantages because of TTC saving
The upgrade in asphalt pavement status leads to a smoother surface for the roadway, faster vehicle movement and, thus, shorter trip time. The saving in travelling time expenses, for both travellers and cargo, could be conveyed to advantages. The average overall advantage as a saving in TTC was 0.10119 US\$/vehicle, as may be found in Figure 5. The overall advantage of saving in vehicle operational expenses and savings in travelling time expenses are gathered to be 0.25819 (US\$/vehicle). This advantage is incorporated when the monetary viability is arranged. The magnitude of these savings e.g., VOC and TTC will be used in economic feasibility and positively impact for construction of the proposed bypass when the results of B/C or other economic parameters be more than the minimum limits.
Figure 5. The advantages resulting from travelling time expense saving between the current and proposed roadways
After conducting a reduction rate, the monetary investigation is accomplished by adjusting the decreased overall expenses of the roadway and their benefits to the base year. Generally, the reduction rate is assumed to be 8% for roadway projects [27].
Some financial standards should be set for the determination of whether the project is financially efficient or not. These standards are evaluated as follows:
(1) Net Present Value (NPV): It is the differentiation between the number of decreased advantages and expenses. The bigger the distinction, the worthier the venture is.
(2) Benefit-Cost Ratio (B/C): It is known as the quotient of diminished advantages and expenses. The project is viewed as more reasonable if the B/C is more than (1.0). It could be as a means that helps to decide on transportation foundations [4].
(3) Internal Rate of Return (IRR): It is known as the amount of the reduction percent at which the decreased expenses and advantages are equivalent. The bigger the differentiation from the less interesting rate of return, the worthier the project is.
The present worth (PW) of advantages or expenses in the future is reduced. The PW procedure incorporates discounting all future entireties to the current time. The rebate rate is accepted in this investigation as 8%. The PW could be calculated as per Eq. (4):
$P=F\left[\frac{1}{(1+i)^n}\right]$ (4)
The average annual traffic Eq. (2) and the traffic in the future by utilizing a 3% rate of growth are established to acquire the overall annual advantages that can be saved by decreasing the vehicle operational and travelling time expenses. Moreover, roadway development expenses are resolved in two years. The amount of the reduced current worth of future advantages and expenses at various debate rates were obtained separately as appeared in Tables 7-8. The financial investigation is achieved by adjusting the advantages and expenses with a specific reduction rate of (8% for roadway projects) through financial components (IRR, NPV, and B/C ratio). The results exhibit that NPV was of a promising value of 8761711 US\$, which shows that the advantages are more significant than the expenses. Besides, the B/C ratio was 1.370 contrasted with 1.0. In conclusion, the IRR is situated between a decreasing percentage of 10% and 15%, with an estimation of 12.35% which is more prominent than the recommended value in the roadway projects (8%). Table 9 exhibits the financial criteria to determine the viability of developing a proposed roadway. The economic feasibility positively impacts the construction of the proposed bypass when the results of B/C or other economic parameters are more than the minimum limits.
Table 7. The reduced advantages with different reduction rates
|
Year |
Future Traffic (Vehicle/Year) |
Total Benefits (US\$) |
DR* 8% |
DR 10% |
DR 15% |
DR20% |
DR25% |
|
0 |
10424400 |
0 |
0 |
0 |
0 |
0 |
0 |
|
1 |
10737132 |
0 |
0 |
0 |
0 |
0 |
0 |
|
2 |
11059246 |
0 |
0 |
0 |
0 |
0 |
0 |
|
3 |
11391023 |
2941048 |
2334699 |
2209653 |
1933787 |
1701996 |
1505817 |
|
4 |
11732754 |
3029280 |
2226611 |
2069039 |
1732001 |
1460880 |
1240793 |
|
5 |
12084737 |
3120158 |
2123527 |
1937373 |
1551270 |
1253922 |
1022413 |
|
6 |
12447279 |
3213763 |
2025216 |
1814085 |
1389398 |
1076283 |
842469 |
|
7 |
12820697 |
3310176 |
1931456 |
1698644 |
1244418 |
923809 |
694194 |
|
8 |
13205318 |
3409481 |
1842037 |
1590548 |
1114565 |
792936 |
572016 |
|
9 |
13601478 |
3511765 |
1756757 |
1489331 |
998263 |
680604 |
471341 |
|
10 |
14009522 |
3617118 |
1675426 |
1394556 |
894096 |
584185 |
388385 |
|
11 |
14429808 |
3725632 |
1597860 |
1305811 |
800799 |
501425 |
320029 |
|
12 |
14862702 |
3837401 |
1523885 |
1222714 |
717238 |
430390 |
263704 |
|
13 |
15308583 |
3952523 |
1453335 |
1144905 |
642395 |
369418 |
217292 |
|
14 |
15767840 |
4071099 |
1386051 |
1072048 |
575363 |
317084 |
179049 |
|
15 |
16240876 |
4193232 |
1321881 |
1003826 |
515325 |
272164 |
147536 |
|
16 |
16728102 |
4319029 |
1260683 |
939946 |
461552 |
233607 |
121570 |
|
17 |
17229945 |
4448599 |
1202318 |
880132 |
413390 |
200513 |
100174 |
|
18 |
17746843 |
4582057 |
1146655 |
824123 |
370254 |
172107 |
82543 |
|
19 |
18279248 |
4719519 |
1093570 |
771679 |
331619 |
147725 |
68015 |
|
20 |
18827626 |
4861105 |
1042941 |
722572 |
297015 |
126797 |
56045 |
|
21 |
19392455 |
5006938 |
994657 |
676590 |
266022 |
108834 |
46181 |
|
22 |
19974228 |
5157146 |
948608 |
633535 |
238263 |
93416 |
38053 |
|
|
SV**=0.75 Bridge |
1494517 |
998124 |
375380 |
147176 |
59952 |
|
|
|
Total Disc. Benefits= |
32382689 |
26399235 |
16862413 |
11595270 |
8437572 |
|
*DR: discount Rate, ** SV: Salvage value
Table 8. The reduced expenses with various reduction rates
|
Year |
Total Costs |
DR 8% |
DR 10% |
DR 15% |
DR20% |
DR 25% |
|
0 |
0 |
0 |
0 |
0 |
0 |
0 |
|
1 |
12333333 |
11419753 |
11212121 |
10724638 |
10277778 |
9866667 |
|
2 |
12333333 |
10573845 |
10192837 |
9325772 |
8564815 |
7893333 |
|
3 |
193333 |
153474 |
145254 |
127120 |
111883 |
98987 |
|
4 |
193333 |
142106 |
132049 |
110539 |
93236 |
79189 |
|
5 |
193333 |
131579 |
120045 |
96121 |
77696 |
63351 |
|
6 |
193333 |
121833 |
109132 |
83583 |
64747 |
50681 |
|
7 |
193333 |
112808 |
99211 |
72681 |
53956 |
40545 |
|
8 |
193333 |
104452 |
90191 |
63201 |
44963 |
32436 |
|
9 |
193333 |
96715 |
81992 |
54957 |
37469 |
25949 |
|
10 |
193333 |
89551 |
74538 |
47789 |
31224 |
20759 |
|
11 |
193333 |
82917 |
67762 |
41556 |
26020 |
16607 |
|
12 |
193333 |
76775 |
61602 |
36135 |
21684 |
13286 |
|
13 |
193333 |
71088 |
56002 |
31422 |
18070 |
10629 |
|
14 |
193333 |
65822 |
50911 |
27324 |
15058 |
8503 |
|
15 |
193333 |
60947 |
46282 |
23760 |
12548 |
6802 |
|
16 |
193333 |
56432 |
42075 |
20661 |
10457 |
5442 |
|
17 |
193333 |
52252 |
38250 |
17966 |
8714 |
4353 |
|
18 |
193333 |
48381 |
34773 |
15622 |
7262 |
3483 |
|
19 |
193333 |
44798 |
31612 |
13585 |
6052 |
2786 |
|
20 |
193333 |
41479 |
28738 |
11813 |
5043 |
2229 |
|
21 |
193333 |
38407 |
26125 |
10272 |
4202 |
1783 |
|
22 |
193333 |
35562 |
23750 |
8932 |
3502 |
1427 |
|
Total Discount Costs |
23620978 |
22765253 |
20965447 |
19496379 |
18249227 |
|
Table 9. The financial consideration values of the current research
|
Economic Features |
Value |
|
NPV [8%] (US\$)= |
8761711 |
|
B/C Ratio [8%]= |
1.370 |
|
IRR (%)= |
12.35 |
Another issue that should be considered within the feasibility investigations of asphalt pavement projects is the increased fuel combustion and air quality at various levels, which has been taken into great consideration by an analyst. Because the adverse impact of SO2 and NOx has become clear, strategies have been conducted endeavoring to reverse the cycle. Lately, mindfulness returned to society’s health influences with regards to the urban characteristics of air because fine molecule discharges from roadway traffic movement are presently suspected to be the noteworthy, contaminated segment of an intricate mixture given the efficient decrease of the former causes (CO, SO2, NOx, and Pb) [28]. Besides, health effects are continually obtained in new epidemiological investigations at low-encompassing considerations [7, 29, 30].
Several asphalt pavement status indicators could be accomplished and utilized to oversee pavement management assessment. The International Roughness Index (IRI) and Pavement Condition Index (PCI) are two of these markers. The IRI is generally gotten using particular apparatus that shows the surface evenness of the road section pavement depending on validated computer calculations, while the PCI depends on a specific rating of the number of distresses in asphalt pavement. Each indicator could be computed from the other [31]. To determine the equivalent Pavement Condition Index (PCI), Eq. (5) can be employed [31, 32].
$\log (\mathrm{PCI})=2-0.43 \log (\mathrm{IRI})$ (5)
Presently, the current roadway condition is awful with an IRI value of about 14 m/km versus 4 m/km IRI value for the proposed roadway. By employing Eq. (5), the anticipated PCI might be about 46.28 and 55 for the existing and proposed roadways, respectively. Contingent upon the pavement conditions of the existing and proposed roadways, certain vehicle discharges such as carbon monoxide (CO), carbon dioxide (CO2), nitrogen dioxides (NO2), and sulfur dioxide (SO2) are estimated using Eqs. (6)-(9) underneath [33], which are depending on the PCI values.
CO Emission $\left(\frac{\frac{\mathrm{g}}{\mathrm{km}}}{\mathrm{hr}}\right)=0.1564(\mathrm{PCI})^2-24.655(\mathrm{PCI})+21747$ (6)
$\mathrm{NO}_2$ Emission $\left(\frac{\frac{\mathrm{g}}{\mathrm{km}}}{\mathrm{hr}}\right)=0.0025(\mathrm{PCI})^2-0.4451(\mathrm{PCI})+495.81$ (7)
$\mathrm{SO}_2$ Emission $\left(\frac{\frac{\mathrm{g}}{\mathrm{km}}}{\mathrm{hr}}\right)=0.00003(\mathrm{PCI})^2-0.0047(\mathrm{PCI})+4.4169$ (8)
$\mathrm{CO}_2$ Emission $\left(\frac{\frac{\mathrm{g}}{\mathrm{km}}}{\mathrm{hr}}\right)=9.4609(\mathrm{PCI})^2-1573.6(\mathrm{PCI})+200000$ (9)
The improvement in the roadway pavement status meant by IRI has enhanced the PCI value determined by Eq. (5), thusly, prompted reduced discharges, agreeing to the deed that emanations per kilometer could be reduced by increasing the driving speed [7, 34]. The vehicle discharge of the existing and proposed roadways that has a decent condition, which reduces the overall discharges are clear is presented in Table 10. The normal decrease in discharge was 1.13% because of the enhancement of pavement conditions. The emission reductions are meaningful, due to the units of these values (g/km/hour), thus, they impact the overall feasibility assessment with respect to the environmental aspect. Referring to the purpose and objectives of the study, the environmental aspect has been studied, and the results showed a decrease in emissions from vehicle exhausts [34, 35].
Table 10. The estimated discharges of vehicles for the existing and proposed roadways
|
Old Road |
New Road |
Reduction % |
|
|
CO (g/km/hour) |
20939.95013 |
20863.085 |
0.367074063 |
|
NO2 (g/km/hour) |
480.565368 |
478.892 |
0.348208196 |
|
SO2 (g/km/hour) |
4.263639152 |
4.24915 |
0.339830635 |
|
CO2 (g/km/hour) |
1947437.511 |
1942071.223 |
0.275556386 |
The analysis successfully conducted, the framework set forth here in this paper can be further explored and the results may shed light on a new and better framework combining transportation and environmental modeling to better address the environmental aspects of transportation.
The sensitivity is expressed as the present variation in at least one parameter which might replace a choice among project alternatives or converse a choice about the financial feasibility of a specific project. The sensitivity investigation was employed to explore what happens to a particular project's practicality after the improvement of the estimated values of study parameters.
10.1 The discount rate effect
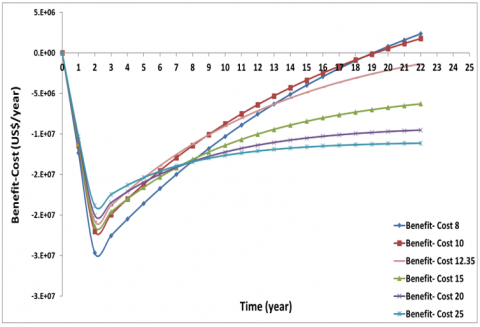
The IRR approach is the principal technique that used the rate of return for actualizing the financial examination. This technique determines the rate of interest that counterparts the value of roadway development project money passage to the corresponding value of money losses. The resulting pace of revenue is indicated as the Internal Rate of Return (IRR). The Internal Rate of Return (IRR) is sometimes alluded to as the breakeven loan rate. The impact of various estimations of the reduction rate (for example, 8% to 25%) on the balancing between advantages and expenses is shown in Figure 6. The positive estimation of reduction aggregated net income alludes to the worthy project. Contingent upon the IRR choice standard, if the Internal Rate of Return (IRR) is more noteworthy than MARR, then this project is financially viable.
Figure 6. The influence of the reduction rate on the retrieved advantages of the research project
10.2 The impact of traffic growth factor and development expenses
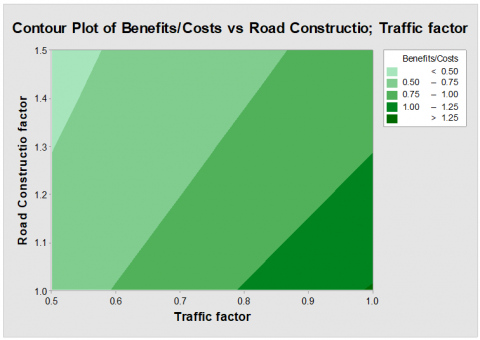
Figure 7 embodies the viable region (where B/C is greater than 1), which means that the project is viable. The B/C was in the limit of (1-1.25) contingent upon the increase or reduction in the growth rate of traffic against the adjustment in restoration expenses. Finding the sensitivity of the project will put in front of the decision-makers a clear and correct vision in the event that there are any variables that arise in the future without taking them into account in the analysis stage.
Figure 7. The impact of the reduced growth rate of traffic and increased rebuilding expenses on the B/C ratio
In the current investigation, endeavours were focused on assessing the financial suitability of developing a suggested roadway over a current one with a terrible status. The accompanying conclusions were extracted from the examination of outcomes:
(1) The roadway user expenses were drastically reduced because of the development of the roadway status. Concerning VOC, it was decreased from (0.679 US\$/vehicle) to (0.521 US\$/vehicle) for existing and proposed roadways, respectively.
(2) Regarding travel time expenses, a comparative pattern was seen, where the outcomes expressed that the travelling time expenses were 0.354 US\$/vehicle and 0.253 US\$/vehicle for the existing and proposed roadways, respectively.
(3) The overall saving (decrease) in the vehicle operating expenses and travelling time expenses was 0.25819 US\$/vehicle, which is believed to be an advantage.
(4) For the financial criteria, the results indicated that NPV was of an empowering estimation of 8761711 US\$, which infers those benefits are more significant than expenses. Moreover, the B/C ratio was 1.370, contrasted with 1.0, which is an encouraging worth.
(5) From the discharge values in Eqs. (6)-(9), it can be inferred that the emanations might be controlled not only by the speed of vehicles but also by the status of the pavement itself. Thus, some vehicle discharges like Carbon dioxide (CO2), Carbon monoxide (CO), Sulphur dioxide (SO2), and nitrogen dioxides (NO2) were diminished because of the significance of pavement status, which boosts the smoothness and empowers speeding up and driving comfort.
(6) Consistent with the sensitivity investigation, several factors such as traffic volume in the future, roadway construction expenses, and reduction rate were evaluated. It was presumed that if the assessed traffic is to be contrarily calculated as 80%, the proposed project will still be valuable with all others remaining constant. Additionally, regardless of whether the roadway construction expenses increased to 130% and with no progressions in different factors, the project stays suitable.
(7) Strategic Environmental Assessment (SEA) requires a paradigm shift in the planning process, where environmental and economic aspects are integrated right from the outset. It emphasizes the inclusion of sustainability criteria at every stage, starting from policy design and extending down to individual project levels. By incorporating these considerations proactively, SEA aims to ensure a holistic and balanced approach to development that accounts for both environmental and economic impacts.
(8) The findings of this study hold relevance for other developing nations that share similar climatic conditions, soil characteristics, and traffic situations. The transferability of these results allows other countries to draw insights and apply similar approaches in their planning and decision-making processes, promoting sustainable development practices across different regions.
The authors would like to thank Mustansiriyah University, College of Engineering, Highway and Transportation Engineering Department (https://uomustansiriyah.edu.iq) for their support in completing all paper requirements.
|
ADT |
Average Daily Traffic |
|
AADT |
Annual Average Daily Traffic |
|
K |
30th Highest Hourly Factor |
|
DHV |
Hourly Design Traffic Volume |
|
P |
Decreased Present Value of Expenses Benefits |
|
F |
Future Expenses or Advantages Values |
|
n |
No. of Years from the Base Year |
|
i |
Rebate Rate |
|
IRI |
International Roughness Index |
|
PCI |
Asphalt Pavement Condition Index |
[1] Archondo-Callao, R.S., Faiz, A. (1994). Estimating vehicle operating costs. World Bank Technical Paper Number 234.
[2] Arianto, T., Suprapto, M. (2018). Pavement condition assessment using IRI from Roadroid and surface distress index method on national road in Sumenep Regency. In IOP Conference Series: Materials Science and Engineering, 333(1): 012091. https://doi.org/10.1088/1757-899X/333/1/012091
[3] Burgess, D.F., Zerbe, R.O. (2011). Appropriate discounting for benefit-cost analysis. Journal of Benefit-Cost Analysis, 2(2): 1-20. https://doi.org/10.2202/2152-2812.1065
[4] Damart, S., Roy, B. (2009). The uses of cost-benefit analysis in public transportation decision-making in France. Transport Policy, 16(4): 200-212. https://doi.org/10.1016/j.tranpol.2009.06.002
[5] Epstein, M.J., Buhovac, A.R. (2014). Making Sustainability Work: Best Practices in Managing and Measuring Corporate Social, Environmental, and Economic Impacts. San Francisco (CA, US): Berrett-Koehler Publishers. http://doi.org/10.4324/9781351276443
[6] De Reyck, B., Degraeve, Z., Vandenborre, R. (2008). Project options valuation with net present value and decision tree analysis. European Journal of Operational Research, 184(1): 341-355. https://doi.org/10.1016/j.ejor.2006.07.047
[7] Panis, L.I., Broekx, S., Liu, R. (2006). Modelling instantaneous traffic emission and the influence of traffic speed limits. Science of the Total Environment, 371(1-3): 270-285. https://doi.org/10.1016/j.scitotenv.2006.08.017
[8] Owolabi, A.O., Sadiq, O.M., Abiola, O.S. (2012). Development of performance models for a typical flexible road pavement in Nigeria. International Journal for Traffic and Transport Engineering, 2(3): 178-184. http://dx.doi.org/10.7708/ijtte.2012.2(3).02
[9] Aboud, G.M., Jassem, N.H., Khaled, T.T., Al-Hamd, R.K.S. (2019). Assessment and development of traffic operation for al-maghrib intersection. In the International Conference Technological Trends in Engineering and Medical Sciences (ICTTEMS), Baghdad, Iraq.
[10] Kadhim, A.J., Banyhussan, Q.S., Jameel, A.K. (2020). Cost-effectiveness analysis of a road improvement proposal based on sustainability indicators: Case study al-nebai-baghdad highway. Periodicals of Engineering and Natural Sciences, 8(2): 916-932.
[11] Banyhussan, Q., Kadhim, A.J., Al-Dahawi, A. (2018). Enhancement of pavement condition and its impact on pavement sustainability: Environmental and economic assessments. Civil and Environmental Research, 10(2): 12-23.
[12] Banyhussan, Q.S., Tayh, S.A., Mosa, A.M. (2019). Economic and environmental assessments for constructing new roads: Case study of al-muthanna highway in Baghdad city. In AWAM International Conference on Civil Engineering. Springer, Cham, pp. 525-546. https://doi.org/10.1007/978-3-030-32816-0_36
[13] Bennett, C.R., De Solminihac, H., Chamorro, A. (2006). Data collection technologies for road management. The World Bank, Washington, DC., Transportation Note No. 30 TRANSPORT NOTES.
[14] Roberts, J.D., Martin, T.C. (1998). Pavement performance monitoring for network management and life-cycle costing. In Proceedings 4th International Conference on Managing Pavements, Durban, South Africa.
[15] Anderson, I., Bauer, K.M., Collins, J.M., Fitzpatrick, K., Green, P., Harwood, D.W., Roger, K., Raymond A.K., Kelly, D.P., Brian, P., Omer, T., Wooldridge, M.D. (2000). Alternative design consistency rating methods for two-lane rural highways (No. FHWA-RD-99-172). United States. Federal Highway Administration. https://rosap.ntl.bts.gov/view/dot/14744.
[16] SCRB. (2005). Highway Design Manual. 2nd edition. Ministry of Construction & Housing, Iraq.
[17] British Standard. (1980). Steel, concrete and composite bridges. BS5400, Code of Practice for Fatigue, Part 10: 2-40.
[18] Highway Capacity Manual. (2000). Transportation research board. National Research Council, Washington, DC, 113.
[19] Garber, N.J., Hoel, L.A. (2014). Traffic and Highway Engineering. Cengage Learning.
[20] ITMP. (2005). Iraqi transportation master plan; A joint between Iraqi Government and Italian Government, phase 2, Transport Modeling, Baghdad, State Corporation for Roads and Bridges.
[21] Purdy, J.E., Wiegmann, J.D. (1987). Vehicle maintenance: Cost relationship and estimating methodology, Transportation Research Record, No. 1140.
[22] Mohammed, A.A., Jasim, O.A. (2014). Traffic flow analysis for intersection using computer simulation Aasidra software: A case study in Bangi Malaysia. Tikrit Journal of Engineering Sciences, 21(3): 10-25. https://doi.org/10.25130/tjes.21.3.02
[23] Humoody, M.A., Younis, N.A. (2022). Congestion identification for multilane highway by vehicle lane change as driver behavior. Tikrit Journal of Engineering Sciences, 29(1): 46-59. https://doi.org/10.25130/tjes.29.1.5
[24] Schoon, J.G. (2000). Geometric Design Projects for Highways. ASCE Press.
[25] AASHTO. (1987). AASHTO Maintenance Manual, American Association of state Highway and Transportation Officials. Washington, D.C.
[26] Litman, T. (2009). Transportation cost and benefit analysis. Victoria Transport Policy Institute, 31: 1-19.
[27] Zhuang, J., Liang, Z., Lin, T., De Guzman, F. (2007). Theory and practice in the choice of social discount rate for cost-benefit analysis: A survey. ERD Working Paper Series, No. 94.
[28] Hoek, G., Brunekreef, B., Goldbohm, S., Fischer, P., van den Brandt, P.A. (2002). Association between mortality and indicators of traffic-related air pollution in the Netherlands: A cohort study. The Lancet, 360(9341): 1203-1209. https://doi.org/10.1016/S0140-6736(02)11280-3
[29] Pope Iii, C.A., Burnett, R.T., Thun, M.J., Calle, E.E., Krewski, D., Ito, K., Thurston, G.D. (2002). Lung cancer, cardiopulmonary mortality, and long-term exposure to fine particulate air pollution. Jama, 287(9): 1132-1141. https://doi:10. 1 001/jama.287.9.1132
[30] Alkaissi, Z.A. (2023). Effect of signal coordination on the traffic operation of urban corridor. Tikrit Journal of Engineering Sciences, 30(1): 12-24. https://doi.org/10.25130/tjes.30.1.2
[31] Arhin, S.A., Williams, L.N., Ribbiso, A., Anderson, M.F. (2015). Predicting pavement condition index using international roughness index in a dense urban area. Journal of Civil Engineering Research, 5(1): 10-17. https://doi.org/10.5923/j.jce.2015 0501.02
[32] Alkaissi, A.J.K.Z.A., Khaled, T.T. (2020). Travel speed prediction model for urban arterial road and traffic management. Journal of Green Engineering, 10: 13536-13548.
[33] Setyawan, A., Kusdiantoro, I. (2015). The effect of pavement condition on vehicle speeds and motor vehicles emissions. Procedia Engineering, 125: 424-430. https://doi.org/10.1016/j.proeng.2015.11.111
[34] Riegg Cellini, S., Edwin Kee, J. (2015). Cost‐effectiveness and cost‐benefit analysis. In Handbook of Practical Program Evaluation. Fourth Edition, Chapter Twenty-Four, pp. 636-672. https://doi.org/10.1002/9781119171386.ch24
[35] Gillies, J.A., Etyemezian, V., Kuhns, H., Nikolic, D., Gillette, D.A. (2005). Effect of vehicle characteristics on unpaved road dust emissions. Atmospheric Environment, 39(13): 2341-2347. https://doi.org/10.1016/j.atmosenv.2004.05.064