Rico*![]() | Rahim Darma
| Rahim Darma![]() | Darmawan Salman
| Darmawan Salman![]() | Mahyuddin
| Mahyuddin![]()
© 2024 The authors. This article is published by IIETA and is licensed under the CC BY 4.0 license (http://creativecommons.org/licenses/by/4.0/).
OPEN ACCESS
The performance of agribusiness actors is measured to evaluate the efficiency of the Arabica coffee agribusiness system. This study aims to analyze the effect of the performance of agribusiness actors (Department of Agriculture, Companies, Coffeeshops, Micro, Small, and Medium Enterprises, Agromechanical Industry, Agrochemical Industry, Cooperatives, Collecting Traders, Agricultural Extension, Farmer Groups, Farmers) on the performance of subsystems (Upstream, Farming, Downstream, Marketing, and Supporting) of Arabica coffee agribusiness. This study used a descriptive qualitative and quantitative approach. The data analysis technique uses Smart PLS 3.0 software, Structural Equation Model - Partial Least Square (SEM-PLS) analysis. The analysis was carried out partially because indicators intersected or were interrelated between actors and agribusiness subsystems. The results showed that there were variables that had a significant and positive effect, including the performance of the Agriculture Office on the Upstream and Supporting Subsystems; Companies on farming, downstream, and marketing subsystems; Coffeeshops on downstream and marketing; MSMEs on marketing; Cooperatives on support; Farmers on upstream, agriculture, and marketing. In addition, some variables have an insignificant and negative effect, namely the performance of the company to the supporting subsystem, Agromechanics and agrochemicals to upstream; Cooperatives to marketing, Collecting Traders to marketing, Extension to supporting; Farmer groups to farming and supporting subsystems. The research conclusion shows that 11 variables have a significant and positive effect, while the remaining nine have a negative and insignificant impact. Arabica coffee agribusiness performance can be improved through policy support that favors the country's mainstay commodities such as arabica coffee.
actors, agribusiness system, Arabica coffee, regulation, Structural Equation Model - Partial Least Square (SEM-PLS)
Coffee is one of the plantation commodities in Indonesia that has a high economic value among other plantation crops and plays an essential role as a source of foreign exchange [1]. Among all other species, arabica coffee and robusta coffee are widely used for economic and commercial purposes. Arabica coffee accounts for 75-80% of total coffee production worldwide. Total world coffee production, exports, and consumption from 2006 to 2015 represent the Arabica coffee plant species. Coffee is produced in about 80 countries in the world. In 2016, around 59% of Indonesia's coffee was exported, making the stability of Indonesia's coffee trade highly dependent on world market conditions. Moreover, many countries are now making various international agreements on free trade, quota systems, single markets, and primary production. This condition requires Indonesia to improve its export performance and open new cooperation opportunities to compete with other countries in the international market [2].
Indonesian coffee plantations cover approximately 1.24 million hectares, 933 hectares of robusta plantations, and 307 hectares of arabica plantations. More than 90 percent of the total plantation is cultivated by small-scale farmers (Nasution, 2018). The development of coffee productivity for the period 2001-2022 by type shows that although arabica coffee only has a share of less than 21% in terms of area, the productivity of arabica coffee tends to be higher than that of robusta coffee. Arabica coffee productivity averaged 797.02 kg/ha, while robusta coffee productivity was 721.28 kg/ha. Regarding growth, Arabica coffee productivity experienced a higher average increase of 2.97% yearly, while Robusta coffee productivity only increased by 1.67% annually.
Indonesia's arabica coffee production centers are located in 4 Provinces with a total share of 81.88% or total average production in 2018-2022 of 169.12 thousand tons. Arabica coffee is dominant in 2 provinces, namely Aceh and North Sumatra, with a share of 32.02% and 31.98% or an average production of 66.13 thousand tons and 66.05 thousand tons of ground arabica coffee. The other largest arabica coffee-producing provinces are South Sulawesi and West Sumatra, each with an average production (per year in the last five years) of 25.34 thousand tons and 11.60 thousand tons or a share of 12.27% and 5.62% of Arabica coffee production in Indonesia. At the same time, other provinces contributed 18.12% [3].
North Toraja Regency is one of the Arabica coffee-producing regions in South Sulawesi. Arabica coffee in North Toraja Regency originated from the Dutch Government, which opened a 300-hectare coffee plantation on Sulawesi Island and named the coffee Kalosi Celebes Coffee. Then, in 1976, the company PT Toarco (Toraja Arabica Coffee) Jaya produced Arabica coffee in the North Toraja region, so Toraja coffee became famous in the world coffee market. However, after tracing, the name Kalosi comes from the name of the area in the mountainous region of Enrekang Regency. According to Key Coffee, researchers brought in by PT. Toarco Jaya concluded that coffee from Toraja and Enrekang have the same flavor and character. This is because the topology of the region is very suitable for coffee plant fertility. In 1977, PT. Toarco Jaya registered Toraja Arabica Coffee as an international trademark and began exporting coffee. The amount of coffee production in North Toraja Regency is presented in the following table.
Table 1. Total coffee production in North Toraja Regency 2017-2019
|
Year |
Total production (tons) |
|||
|
Arabica Coffee |
Growth rate (%) |
Robusta Coffee |
Growth rate (%) |
|
|
2017 |
2.596 |
|
557 |
|
|
2018 |
3.962 |
52,6 |
687,5 |
23,4 |
|
2019 |
4.873 |
23 |
765,4 |
11,33 |
|
Average |
3.810 |
37,8 |
670 |
17,36 |
Source: North Toraja Agriculture and Trade Office, 2019.
Table 1 shows that coffee production in North Toraja Regency from 2017 to 2019 has increased for Arabica and Robusta coffee. The production volume of Arabica coffee is much greater than that of Robusta coffee. Arabica coffee increased by 37.8 percent per year, while Robusta coffee increased by 17.36 percent. The level of Arabica coffee production that is much greater than Robusta coffee indicates a massive potential for Arabica coffee in the North Toraja Regency. There are 18,178 ha of Arabica coffee plantations in Toraja, 5,174 ha of which are immature.
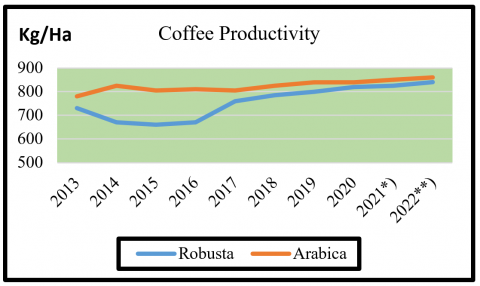
Figure 1. Development of Indonesia's coffee productivity by coffee type, 2013-2022 [3]
Based on Figure 1, arabica coffee productivity in Indonesia is higher than robusta coffee productivity in 2013 – 2022. If these crops receive optimal intervention to reach a minimum production potential of 1,243 kg/ha/year or a maximum potential of 1,798 kg/ha/year (based on typical and USDA production estimation results). In that case, this area in the next two years has the potential to increase production by 7,000-9,000 tons of Arabica coffee per year. In addition, there is still 42,038 ha of land available in North Toraja, which, in terms of soil and agro climate, has the potential to grow Arabica coffee as one of Indonesia's specialty coffees [4].
Coffee is one of the most popular commodities for farmers in North Toraja Regency and serves as the main or additional source of income for the farming community. The majority of farmers carry out agricultural activities in rural areas. Generally, farming activities are still small-scale or called smallholder plantation businesses. This is because the business still needs access to capital, the technology is simple, and information needs improvement.
In the effort to develop coffee agribusiness in addition to subsystems that support agribusiness, many other factors must be considered in addition to the many opportunities and challenges faced. Opportunities and challenges can be seen from ample land, human resources such as labor, local and regional markets within and outside the province, international markets, local government support, and connecting facilities and other supporting institutions. The problem of agribusiness competitiveness is inseparable from the condition of human resources, who act as actors in running a system. The quality of human resources is more decisive than other factors, such as natural resources. This aligns with the study of Saragih [5] opinion that the agribusiness system is not about commodities but the people involved.
The performance of agribusiness actors is a whole concept, starting from the pre-production system (upstream), production system (cultivation/on-farm), and post-production system (downstream). The performance of stakeholders in the agricultural sector is measured to see how well the Arabica coffee farming system is doing so that underperformance can be corrected so that it will affect the success of farm businesses in the coffee farming sector. The performance of the agribusiness subsystem in its implementation cannot be separated from the influence of the Performance of Arabica coffee agribusiness actors. Therefore, it is interesting to study more deeply the impact of the performance of agribusiness actors on the performance of each subsystem that plays a role in the Arabica coffee agribusiness.
Some previous research studies that discuss the performance of arabica coffee agribusiness, namely Saragih [5], Describe how arabica coffee production has been implemented in Simalungun District and the regional revenue it produces. This will demonstrate how to boost income and coffee output, and it is necessary to increase land cultivation. In addition, domestic prices are not significant in production, but international prices have a considerable effect. Martauli and Siahaan [6] examined the impact of entrepreneurial characteristics on the performance of arabica coffee farming in Karo Regency, showing that the characteristic variables that have a positive effect are experience, desire to do business, perception, and courage to take risks. The most dominant entrepreneurial characteristic is the desire to do business; overall, it is vital. Gichichi et al. [7] discuss the effect of market conditions on the performance of micro agribusiness and smallholder coffee farmers in Kenya, showing that market conditions contribute to the expansion of the agribusiness sector in Kenya. The study recommends that county governments encourage small-scale coffee agribusinesses to form agricultural cooperatives or join existing cooperatives to ensure coffee agribusiness products reach the market at reasonable prices to increase income and eliminate exploitative intermediaries who profit at the expense of smallholder farmers.
Juniasih et al. [8] discussed the effect of social capital on the Performance of coffee-based agribusiness SMEs in Tabanan Regency, Bali Province. The combined analysis results show that social capital consisting of trust, norms, and networks on the Performance of coffee-based agribusiness SMEs has a positive and significant effect on the Performance of coffee-based agribusiness SMEs in Tabanan Regency. There needs to be a strengthening of social capital from SMEs and government officials for the business world to develop together with other money to achieve business success. Saragih and Harmain [9] discussed the factors affecting the entrepreneurial performance of arabica coffee farmers in Dolog Masagal District, Simalungun Regency, North Sumatra Province. The results showed that internal factors (farmer age, education, experience, number of family members, family motivation, and work culture) had a positive and significant effect on the entrepreneurial Performance of Arabica coffee farmers. In contrast, external factors (government support, community support, access to production facilities, and climatic conditions) had a positive and insignificant effect on the entrepreneurial Performance of Arabica coffee farmers.
Other related research on factors affecting arabica coffee agribusiness is Putri et al. [10] on the performance of arabica coffee production factors in Gumanti Valley, Solok Regency, West Sumatra, Siahaan and Martauli [11] on the effect of entrepreneurial behavior on the performance of arabica coffee farms in Karo Regency, Kurniawan, et al., [12] on factors affecting the production of arabica coffee farms in Donowarih Village, Karangploso District. Revadiana and Lucyana [13] discuss the determinants of coffee business success (case study at PT. SML, West Java). Based on the description of previous research, most of it concerns the performance of farming and coffee production factors from an economic and social point of view.
There have been no findings that discuss the influence of the performance of agribusiness actors on the performance of the Arabica coffee agribusiness subsystem specifically, so this research is interesting to study by knowing the effect of the performance of agribusiness actors on the performance of the Arabica coffee agribusiness subsystem so that it can be the focus of the development of each Arabica coffee agribusiness subsystem in North Toraja Regency. This study aimed to analyze the effect of agribusiness actors' performance on the performance of arabica coffee agribusiness subsystems.
2.1 Research design
This research was conducted in North Toraja Regency, the center of Arabica coffee production, from October 2021 - March 2022. A descriptive qualitative and quantitative approach was adopted in this study. The data used in this study are secondary data published by the Central Statistics Agency (BPS), other relevant government agencies, and primary data obtained directly from respondents. The data collection techniques used are surveys and interviews.
And documentation in the form of in-depth interview guidelines for respondents. Respondents in this study included Arabica coffee agribusiness actors in North Toraja Regency in each of the upstream, farming, downstream, marketing, and supporting subsystems. The number of respondents was 7-10 people each from agribusiness actors.
Respondents in this study also involved agribusiness actors, namely the Department of Agriculture, companies, coffee shops, MSMEs, the aeromechanical industry, the agrochemical industry, cooperatives, intermediary traders, and agricultural extension workers. Arabica coffee farmers in North Toraja Regency, so the total population is 1,248 people. While determining the sample in this study using the random sampling method with the Slovin formula:
$\frac{n=N}{1+N(e)^2}$
Description:
n: Study sample
N: Study population
e: Margin of error (10%)
Based on the calculations using the Slovin formula, this study was obtained; namely, 93 samples of farmers spread across 41 farmer groups. The following population and sample numbers can be seen in Table 2 as follows:
Table 2. Population and sample size of farmer groups and coffee farmers in North Toraja Regency
|
District |
Population |
Sample |
||
|
Farmer Group |
Farmers |
Farmer Group |
Farmers |
|
|
Baruppu |
6 |
128 |
3 |
10 |
|
Buntao |
25 |
427 |
14 |
32 |
|
Buntu Pepasan |
4 |
58 |
2 |
4 |
|
Dende Piongan Napo |
8 |
173 |
5 |
13 |
|
Kapala Pitu |
2 |
23 |
1 |
2 |
|
Nanggala |
6 |
191 |
3 |
14 |
|
Rindingalo |
5 |
10 |
3 |
1 |
|
Sa Dan |
9 |
175 |
5 |
13 |
|
Sesean Suloara |
3 |
40 |
2 |
3 |
|
Sopai |
3 |
23 |
2 |
2 |
|
Total |
71 |
1248 |
41 |
93 |
Source: Simluhtan, 2021.
Based on the results of calculations using the Slovin formula, the sample of farmer groups and farmers taken was 93 people.
2.2 Location and time of research
The location to conduct this research is North Toraja Regency, considering that this regency has a high production of Arabic coffee. This research will be conducted from October 2021 - March 2022.
2.3 Sampling and data collection techniques
The survey collects data or information on a large population using a small sample. This method is also carried out by directly observing a process that is running or taking place. This survey aims to see the performance of coffee agribusiness actors in North Toraja Regency. The sampling technique used simple random sampling, where all populations can be used as respondents.
Research using the survey method must use the help of a questionnaire as a guide so that interviews are more organized and directed. Discussions are one of the techniques used to collect research data. The interview is a two-way communication to obtain information from related respondents. An interview is a face-to-face conversation between the interviewer and the interviewee, where the interviewer asks directly about an object under study that has been previously designed. During the interview process, the author will ask several questions about the performance indicators of coffee agribusiness actors in North Toraja Regency and record the information presented by informants, which will then be used as material for writing research reports. Questions were given to respondents, namely, the role of each agribusiness actor in each agribusiness subsystem and the influence of the performance of agribusiness actors on each subsystem.
2.4 Data analysis
2.4.1 Quantitative analysis
Quantitative analysis in this study aims to measure variables using a scale (1 - 4). The variables and indicators used describe the state of the research location and are adjusted to previous research. The following is the measurement of variables based on the interval.
Table 3. Variables, indicators, and measurement of study
|
Variables |
Indicators |
Source |
Measurement |
|
Agriculture Office (X1) |
|
[14] |
1: Disagree 2: Disagree 3: Agree 4: Strongly Agree |
|
Company (X2) |
|
[15, 16] |
1: Disagree 2: Disagree 3: Agree 4: Strongly Agree |
|
Coffeeshop (X3) |
|
[17] |
1: Disagree 2: Disagree 3: Agree 4: Strongly Agree |
|
MSMES (X4) |
|
[17] |
1: Disagree 2: Disagree 3: Agree 4: Strongly Agree |
|
Agromechanical Industry (X5) |
|
[15, 16] |
1: Disagree 2: Disagree 3: Agree 4: Strongly Agree |
|
Agrochemical Industry (X6) |
|
[15, 16] |
1: Disagree 2: Disagree 3: Agree 4: Strongly Agree |
|
Cooperative (X7) |
|
[18] |
1: Disagree 2: Disagree 3: Agree 4: Strongly Agree |
|
Collecting traders (X8) |
|
[18] |
1: Disagree 2: Disagree 3: Agree 4: Strongly Agree |
|
Agricultural Extension (X9) |
|
[19] |
1: Disagree 2: Disagree 3: Agree 4: Strongly Agree |
|
Farmer Group (X10) |
|
[20] |
1: Disagree 2: Disagree 3: Agree 4: Strongly Agree |
|
Farmers (X11) |
|
[21] |
1: Disagree 2: Disagree 3: Agree 4: Strongly Agree |
|
Upstream Subsystem (Y1) |
|
[22] |
1: Disagree 2: Disagree 3: Agree 4: Strongly Agree |
|
Farming subsystem (Y2) |
|
[22] |
1: Disagree 2: Disagree 3: Agree 4: Strongly Agree |
|
Downstream Subsystem (Y3) |
|
[22] |
1: Disagree 2: Disagree 3: Agree 4: Strongly Agree |
|
Marketing Subsystem (Y4) |
|
[22] |
1: Disagree 2: Disagree 3: Agree 4: Strongly Agree |
|
Support Subsystem (Y5) |
|
[22] |
1: Disagree 2: Disagree 3: Agree 4: Strongly Agree |
Source: Literature Review
Based on Table 3, the questionnaire that has been given to respondents, each respondent is given four questions for each indicator with measurements: 1 (Disagree), 2 (Disagree), 3 (Agree), and 4 (Strongly Agree). Then, the Sturges Formula can be made as follows to find out the majority of respondents' answers to each item.
class interval $(c)=\left(\frac{X_n-X_1}{k}\right)=\frac{(16-4)}{3}=4$
Description:
c: class interval
k: number of classes
Xn: highest score value
X1: lowest score value
Table 4. Interpretation of respondents' average answers
|
Average Interval |
Statement |
Value |
|
4 - 8 |
Low |
1 |
|
9 - 12 |
Medium |
2 |
|
13 - 16 |
High |
3 |
Source: Sturges Formula
Based on Table 4, every indicator that has a value of 4-8 can be said to be low statement so it is given a value of 1, while indicators that have a value of 9-12 are categorized as medium statement and given a value of 2. Indicators that have a value of 13-16 are categorized as high statement and given a value of 3.
2.4.2 Structural equation modelling analysis
This study uses data from respondents processed using the Structural Equation Model-Partial Least Square (SEM-PLS) analysis tool using Smart PLS 3.0 software. The choice for data processing using SEM-PLS is expected to show the influence caused between the latent variables tested to determine the presence or absence and the size of the force between variables. The outer reflective model is evaluated based on three criteria: convergent validity, discriminant validity, and composite reliability.
2.4.3 Outer model evaluation
Evaluation of the reflective Outer Model is carried out in first order. Evaluation of indicators on each first-order construct uses three criteria: convergent validity, discriminant validity, and composite reliability. The requirements and standardization of outer model evaluation are as follows:
a) Convergent Validity
The criteria for the outer model state that convergent validity is seen from the loading factor value of each indicator; the value must be > 0.7, and if the value is less than that, it must be discarded and re-analyzed with Smart PLS 3.0. However, for research in the early stages of developing a measurement scale, a loading value of 0.5 to 0.6 is considered sufficient.
b) Discriminant Validity
Discriminant validity is reflected based on the cross-loading of measures with constructs. Suppose the correlation of the construct with the measurement items is more significant than the measures of the other constructs. In that case, the latent constructs predict the actions in their block better than those in the others. Another method of measuring this is to compare the square root of each construct's average variance extracted (AVE) value. Suppose the honest root value of the AVE of each construct is greater than the correlation value between the construct and other constructs in the model. In that case, it is said to have an excellent discriminant validity value. It is recommended that the AVE value should be greater than 0.5.
c) Composite Reliability
The composite reliability value reflects the reliability value of an indicator. Research on a variable is said to be sufficiently reliable if the variable has a combined reliability value greater than 0.7; if the value is less, then the indicator cannot be used in research.
2.4.4 Inner model evaluation
In assessing the model with PLS, we can start by looking at the R-square for each dependent latent variable. The interpretation will be the same as the interpretation in regression. Changes in the R-square value can be used to assess the effect of certain independent latent variables on the dependent latent variable and whether it is having a substantive impact. The SEM method consists of 2 types of variables: latent variables and manifest variables. The following are latent variables and manifest variables in this research model. The research design in this SEM consists of 16 latent variables and 67 manifest variables.
The model of the influence of the performance of agribusiness actors on the performance of the arabica coffee agribusiness subsystem in North Toraja Regency was conducted through SEM modeling using the SmartPLS (SEM-PLS) program. The outer model can be evaluated by Looking at the measurement validity (Convergent Validity) value. Convergent Validity is the correlation between the indicator score and the construct score. Testing convergent validity uses the outer loading value. An indicator is declared to meet convergent validity in a suitable category if the value of each indicator external loading > 0.7. This value shows the percentage of constructs able to explain the variation in the indicator [23].
Table 5. Cronbach's Alpha, composite reliability, average variance extracted (AVE) values
|
Variables |
Cronbach's Alpha |
Composite Reliability |
Average Variance Extracted (AVE) |
|
X1 |
0,815 |
0,891 |
0,733 |
|
X2 |
0,885 |
0,929 |
0,814 |
|
X3 |
0,876 |
0,915 |
0,730 |
|
X4 |
0,949 |
0,961 |
0,831 |
|
X5 |
0,775 |
0,868 |
0,687 |
|
X6 |
0,880 |
0,915 |
0,729 |
|
X7 |
0,861 |
0,855 |
0,747 |
|
X8 |
0,752 |
0,873 |
0,776 |
|
X9 |
1,000 |
1,000 |
1,000 |
|
X10 |
0,721 |
0,803 |
0,672 |
|
X11 |
0,844 |
0,889 |
0,616 |
|
Y1 |
0,891 |
0,925 |
0,756 |
|
Y2 |
0,782 |
0,855 |
0,599 |
|
Y3 |
0,857 |
0,901 |
0,696 |
|
Y4 |
0,826 |
0,885 |
0,661 |
|
Y5 |
0,778 |
0,869 |
0,699 |
Source: Processed research data, 2023.
Table 6. Outer loading value
|
Latent Variable |
Manifest Variable |
Outer Loading Value |
|
X1 Performance of the Department of Agriculture |
X1.1 Ability to be a facilitator |
0.919 |
|
X1.3 Ability to be a regulator |
0.729 |
|
|
X1.4 Ability to be a catalyst |
0.908 |
|
|
X2 Company Performance |
X2.1 Total Production |
0.945 |
|
X2.3 Market Demand |
0.839 |
|
|
X2.5 Resource utilization efficiency |
0.920 |
|
|
X3 Coffeeshop Performance |
X3.1 Capital |
0.844 |
|
X3.2 Facilities |
0.899 |
|
|
X3.4 Access to production facilities |
0.821 |
|
|
X3.5 Government support |
0.853 |
|
|
X4 MSME performance |
X4.1 Capital |
0.890 |
|
X4.2 Facilities |
0.960 |
|
|
X4.4 Access to production facilities |
0.962 |
|
|
X4.5 Government support |
0.849 |
|
|
X4.6 Market conditions |
0.890 |
|
|
X5 Agromechanic Industry Performance |
X5.3 Market demand |
0.815 |
|
X5.4 Price policy |
0.844 |
|
|
X5.5 Efficiency of resource use |
0.827 |
|
|
X6 Agrochemical Industry Performance |
X6.1 Production quantity |
0.933 |
|
X6.3 Market Demand |
0.888 |
|
|
X6.4 Pricing Policy |
0.768 |
|
|
X6.5 Efficiency of resource use |
0.817 |
|
|
X7 Cooperative Performance |
X7.1 Participation |
0.864 |
|
X7.3 Ability to Innovate |
0.864 |
|
|
X8 Performance ofCollecting Traders |
X8.1 Ability to distribute products |
0.968 |
|
X8.2 Ability to provide market information |
0.784 |
|
|
X9 Agricultural Extension Performance |
X9.2 Competence of Extension Workers |
1.000 |
|
X10 Farmer Group Performance |
X10.1 Group Characteristics |
0.760 |
|
X10.2 Group Dynamics |
0.760 |
|
|
X11 Farmer Performance |
X11.1 Farmer Competence |
0.820 |
|
X11.2 Land |
0.778 |
|
|
X11.3 Interaction with extension workers |
0.729 |
|
|
X11.4 Means of production |
0.862 |
|
|
X11.5 Involvement in Farmer Groups |
0.728 |
|
|
Y1 Upstream Subsystem Performance |
Y1.1 Provision of production facilities under the needs of farmers |
0.933 |
|
|
||
|
Y1.2 Access to means of production |
0.797 |
|
|
Y1.3 Quality of production facilities used |
0.924 |
|
|
Y1.4 Affordable price of production facilities |
0.815 |
|
|
Y2 Farming Subsystem Performance |
Y2.1 Farm management according to good cultivation methods |
0.738 |
|
Y2.2 Application of appropriate technology |
0.887 |
|
|
Y2.3 Farmer competence related to farm management |
0.798 |
|
|
Y2.4 Farm productivity |
0.759 |
|
|
Y3 Downstream Subsystem Performance |
Y3.1 use of equipment |
0.834 |
|
Y3.2 Storage, sorting, and grading process |
0.866 |
|
|
Y3.3 Packaging |
0.792 |
|
|
Y3.4 Job security and safety |
0.843 |
|
|
Y4 Marketing Subsystem Performance |
Y4.1 Market for Arabica coffee products |
0.709 |
|
Y4.2 Pricing for Business Actors |
0.799 |
|
|
Y4.3 Access to Partnerships |
0.814 |
|
|
Y4.4 access to market information |
0.916 |
|
|
Y5 Performance of Support Subsystems |
Y5.1 Government favoritism in arabica coffee development |
0.897 |
|
|
||
|
Y5.2 Counselling and training available to improve Arabica coffee production |
0.788 |
|
|
Y5.3 access to financial institutions available |
0.801 |
Source: Processed primary data, 2023.
In addition to the validity assessment, this study also measured the data's reliability (Discriminant Validity) to assess the consistency of the questions used in the research questionnaire. The reliability test is the main criterion in research. The validity test shows whether the research results are acceptable with specific criteria. Validity can be assessed statistically, namely convergent and discriminant validity [24]. Substantial truth and reliability values have Cronbach's Alpha output or composite reliability value of each variable above 0.7 (> 0.7).
Table 5 shows the value of the eleven latent variables X1 to X11 (successively named: Performance of the Department of Agriculture, company performance, coffeeshop performance, MSME performance, agromechanical industry performance, agrochemical industry performance, cooperative performance, intermediary trader performance, agricultural extension agent performance, farmer group performance, and farmer performance) have AVE values higher than 0.5, which means that the validity assessment has been met for the model. The value of Cronbach's alpha and composite reliability is also presented in Table 5, where the value is in the range of 0.7 - 1; this reinforces that the model used can be said to pass the validity and reliability tests as the initial stage of SEM statistical data processing. The following is the outer loading value of each indicator on the research variables.
After running data based on variables synthesized from several literature searches of articles on online databases that were used as references for the preparation of questionnaire questions, it was found that there were at least 16 latent variables and 68 manifest variables. Based on Table 6, some manifest variables show values below 0.7, so they are considered invalid, or these factors are considered not to affect latent variables.
The outer loading value in Table 5 shows several factors that have a value below 0.7, namely 15 manifest variables, namely X1.2 Ability to be a dynamic (0.563); X2.2 Profit (0.697); X2.4 Pricing Policy (0.470); X3.3 Promotion (0.531); X3.6 Market Conditions (0.544); X4.3 Promotion (0.312); X5.1 Profit (0.649); X5.2 Profit (0.640); X6.2 Profit (0.203);
X7.2 Commitment (0.657); X8.3 Ability to provide capital loans (0.592); X8.4 Ability to do sorting and grading (0.679); X9.1 Extension worker characteristics (0.683); X9.3 Extension worker motivation (0.042); and Extension worker independence (0.280).
This study only focuses on manifest variables that have values above 0.7 so that the expected results are optimized. Therefore, we decided to eliminate the uninfluential variables and then rerun the data based on the influential variables only in the first running data, where the results will be presented in Figure 2.
The output of the outer loading test in Table 6 shows that all variables have a value above 0.7 (53 manifest variables), indicating that the research indicators have been they are statistically accepted for SEM model research and additional analysis. Variables that have been declared valid and reliable will be used as a statistical measurement tool to see the real influence between the two variables (dependent and independent variables).
3.1 SEM-PLS model evaluation
The structural model can be evaluated by interpreting the analysis results based on the R-squared value on the dependent variable (Y1, Y2, Y3, Y4, Y5). R-square is the coefficient of determination of endogenous variables, where the higher the R-square value indicates that the model used is the better a structural research model.
Table 7 shows the R-square value on endogenous variables, namely upstream, farming, downstream, marketing, and supporting subsystems, respectively, 0.270, 0.573, 0.488, 0.516, and 0.220. The upstream subsystem variable (Y1) has an R-square value of 0.270; this means that the contribution of influence on exogenous variables is 27.0% to the indigenous variable Y1, but there is still influence from other variables of 0.730 or 73.3% that have not been tested in this research model. The R-square of the farming subsystem variable (Y2) is 0.573; this shows that there are still other external factors of 0.427 that have not been included in this research model. The implications of these results contribute 57.3% to the model, but there are still 42.7% that still need to be tested.
Table 7. R-Square
|
Variables |
R-Square |
|
Y1 (Upstream Subsystem Performance) |
0.270 |
|
Y2 (Farming Subsystem Performance) |
0.573 |
|
Y3 (Downstream Subsystem Performance) |
0.488 |
|
Y4 (Marketing Subsystem Performance) |
0.516 |
|
Y5 (Supporting Subsystem Performance) |
0.220 |
Source: Processed primary data, 2023.
The downstream subsystem (Y3) has an R-square value of 0.488; this means that variable Y2 contributes to the model at 0.488, with external factors not calculated at 0.512. So, there is a 48.8% influence on the subsystem, while the other 51.2% is still unmeasured in the study. The impact for the marketing subsystem (Y4) is 0.516, meaning there are other factors 0.484 outside the model. Furthermore, the R-square value of the supporting subsystem (0.220) indicates the influence of exogenous variables of 22.0% on the model; other factors of 78.0% are not measured in this study.
3.2 Hypothesis testing results
The hypothesis in the SEM-PLS model is tested based on the T Statistic value, P-value, and original sample value resulting from the calculation of the value of the independent variable (exogenous) and the dependent variable (endogenous) to see the decision that can be taken whether the hypothesis has a significant effect or not on the research model built.
Based on the results of SEM analysis, the relationship of agribusiness actors to the arabica coffee agribusiness subsystem in North Toraja Regency can be described as follows. Agribusiness actors who influence the upstream subsystem are the providers of production facilities. However, the study's results differ from the earlier theory by Harianti et al. [25] that the agribusiness actors that influence the upstream subsystem are the agrochemical, agromechanical, and Agriculture offices. The study results suggest that farmers are influential agribusiness actors in the subsystem. Meanwhile, agribusiness actors that influence the farming subsystem are companies and farmers. This is following the opinion of Syifa et al. [26] that farmers and companies play an essential role in the farming subsystem. In the downstream subsystem, the performance of companies and coffee shops as processors of arabica coffee produced by farmers. This follows the opinion of Hotden et al. [27] that the relationship between the company and the downstream subsystem is continuous and mutually beneficial.
Agribusiness actors who influence the marketing subsystem are agribusiness actors who play a role in marketing production: companies, small businesses, farmers, and cooperatives [28]. However, there are differences in the study results; namely, cooperatives' performance does not affect the marketing subsystem. This is because cooperatives in North Toraja Regency have yet to run optimally in marketing Arabica coffee production. Meanwhile, the performance of agribusiness actors that affect the supporting subsystem are the Agriculture Office and cooperatives. By the opinion of Jamil et al. [29], cooperatives perform the role of guidance, counseling, and assistance to farmers. The Agriculture Office also does this by distributing aid to Arab coffee farmers.
I. The effect of the Performance of the Department of Agriculture on the performance of the upstream subsystem
The calculated path coefficient in Table 8 indicates a positive direction of influence, but the original sample value is small at 0.052. The T-Statistic value of 0.346 shows a value smaller than the T-Table value of 1.98, meaning that this indicator has no significant effect, also supported by a P-Value of 0.730, meaning that the agricultural service indicator has no significant impact on the performance of the upstream subsystem because the value is above 0.05. Therefore, the farm service does not significantly influence the performance of the Arabica coffee chain in the upstream subsystem. The Performance of the Department of Agriculture is considered insignificant or tends to be passive because some of the Department of Agriculture's programs related to the Provision of production facilities are deemed insufficient, and some need to follow the needs of farmers. This is different from Najamuddin's research [30], which states that the Performance of the Agriculture Office in terms of productivity, accountability, responsiveness, and service quality in West Aceh Regency in increasing farmer productivity is considered quite good. This is influenced by cultural and leadership factors shown by leaders to employees through attitudes, and exemplary and high work ethics can affect the apparatus's behavior and provide motivation to provide services to the service user community.
Figure 2 shows the agribusiness actors involved in the Arabica coffee agribusiness subsystem in North Toraja Regency. Each subsystem is supported by one or more actors. The actors involved in the upstream subsystem are, department of agriculture, agromechanics industry, agrochemical industry and farmers. Meanwhile, agribusiness actors involved in the farming subsystem are company, farmer groups and also farmers. For the downstream subsystem, the actors involved are the company and the coffee shop. Agribusiness actors involved in the marketing subsystem are companies, coffee shops, MSMEs, cooperatives, gatherers and farmers. In the supporting subsystem, the actors involved are, agriculture office, company, agricultural extension workers, cooperative and farmer group. the effect of performance of agribusiness actors on the performance of Arabica coffee agribusiness subsystems in North Toraja Regency can be seen in the following Table 8.
Figure 2. Outer model of the effect of performance of agribusiness actors on the performance of Arabica coffee agribusiness subsystems in North Toraja Regency
Table 8. Path Coefficient value
|
No. |
Variables |
Original Sample |
Sample Mean |
Standard Deviation |
T Statistic |
P Value |
|
1. |
Performance of the Department of Agriculture > Upstream Subsystem Performance |
0.052 |
0.064 |
0.149 |
0.346 |
0.730 |
|
2. |
Performance of the Agriculture Office > Performance of Supporting Subsystems |
0.255 |
0.258 |
0.125 |
2.034 |
0.043 |
|
3. |
Company Performance > Farm Subsystem Performance |
0.185 |
0.188 |
0.078 |
2.383 |
0.018 |
|
4. |
Company Performance > Downstream Subsystem Performance |
0.280 |
0.286 |
0.080 |
3.497 |
0.001 |
|
5. |
Company Performance > Marketing Subsystem Performance |
0.152 |
0.149 |
0.066 |
2.152 |
0.022 |
|
6. |
Company Performance > Support Subsystem Performance |
-0.083 |
-0.082 |
0.111 |
0.742 |
0.458 |
|
7. |
Coffeeshop Performance > Downstream Subsystem Performance |
0.187 |
0.190 |
0.094 |
1.994 |
0.047 |
|
8. |
Coffeeshop Performance > Marketing Subsystem Performance |
0.173 |
0.068 |
0.200 |
2.363 |
0.016 |
|
9. |
MSME Performance > Marketing Subsystem Performance |
0.441 |
0.440 |
0.086 |
5.119 |
0.000 |
|
10. |
Performance of the Agromechanics Industry > Upstream Subsystem Performance |
0.164 |
0.168 |
0.094 |
1.755 |
0.080 |
|
11. |
Agrochemical Industry Performance > Upstream Subsystem Performance |
-0.063 |
-0.012 |
0.127 |
0.495 |
0.621 |
|
12. |
Cooperative Performance > Marketing Subsystem Performance |
0.097 |
0.098 |
0.088 |
1.098 |
0.273 |
|
13. |
Cooperative Performance > Support Subsystem Performance |
0.266 |
0.282 |
0.112 |
2.383 |
0.018 |
|
14. |
Gatherer Performance > Marketing Subsystem Performance |
0.045 |
0.054 |
0.101 |
0.439 |
0.661 |
|
15. |
Performance of Agricultural Extension Workers > Performance of Support Subsystems |
-0.010 |
-0.019 |
0.102 |
0.098 |
0.922 |
|
16. |
Farmer Group Performance > Farming Subsystem Performance |
0.128 |
0.133 |
0.097 |
1.311 |
0.190 |
|
17. |
Farmer Group Performance > Supporting Subsystem Performance. |
0.105 |
0.108 |
0.129 |
0.813 |
0.417 |
|
18. |
Farmer Performance > Upstream Subsystem Performance |
0.454 |
0.432 |
0.140 |
3.245 |
0.001 |
|
19. |
Farmer Performance > Farming Subsystem Performance |
0.577 |
0.577 |
0.080 |
7.194 |
0.000 |
|
20. |
Farmer Performance > Marketing Subsystem Performance |
0.527 |
0.533 |
0.236 |
2.235 |
0.026 |
Source: Processed primary data, 2023.
II. The influence of the Performance of the Department of Agriculture on the performance of the supporting subsystems
The direction of influence can be seen from the coefficient value in Table 8; the original sample value is 0.255. this illustrates that the effect given is positive. When viewed from the P-value of 0.043, the value is lower than 0.05 (significant tolerance limit) and supported by the T-Statistic value of 2.034, which is greater than the T-Table value of 1.98, it can be said that this factor has a positive and significant influence. The agriculture office is more of a supporting institution for Arabica coffee agribusiness. In the supporting subsystem, the Agriculture Office is a facilitator in the development of farmers and other agribusiness actors, in addition to the regulations carried out to support the sustainability and compatibility between the parties involved in the Arabica coffee agribusiness system. This is in line with the opinion of Wiwing et al. [31], which states that the Agriculture Office in Bima Regency has carried out the role of facilitator, where the government helps farming communities get good production results. The government has assisted in the form of seeds, fertilizers, and medicines to eradicate plant pests. In addition, the government has provided field schools to make it easier for farming communities to learn about good farming and for farmer groups to gain Access to the Agriculture Office.
III. Effect of Company performance on farming subsystem performance
The original sample value obtained is 0.185, indicating that the direction of the factor effect is positive. To see the significance of the factors tested, the resulting P-value is 0.018 (significant <0.05), and the T-Statistic value is 2.383 (T-Table > 1.98). This means that company performance significantly affects the performance of the farming subsystem. Companies pay more attention to the state of the farming sector to maintain the production of their raw materials (arabica coffee). This is supported by the opinion of Arfiyanto and Purnama [32] that the stability of the company's raw material production must be maintained to fulfill customer orders. If the supply of raw materials is on time and can meet the buyer's demand quickly, it will affect the smooth production process and become hampered.
IV. Effect of Company performance on downstream subsystem performance
The significant value of the company's performance factor on the performance of institutions contained in the downstream subsystem can be seen from the P-value of 0.001, which is smaller than 0.05. At the same time, the T-statistic value of 3.497 is also more significant than the T-Table of 1.98, so it can be concluded that the independent variable significantly influences the dependent variable. The original sample shows a value of 0.280, indicating that the direction of the effect is positive, although the matter is relatively small. The company does not provide much intervention in the downstream subsystem sector but is also part of the downstream subsystem actors.
V. Effect of Company performance on marketing subsystem performance
The influence of company performance towards the positive direction, with an original sample value of 0.152, indicates that this factor positively influences the performance of the marketing subsystem. Then, it has a T-Statistic value of 2.152, more significant than the T-table of 1.98. Meanwhile, the tested factor has a significant influence when viewed from acquiring a P-value of 0.022. Company performance has a positive and considerable effect on the performance of the marketing subsystem; this happens because the company also has a vital role as one of the actors in the marketing subsystem. This follows the opinion of Asmarantaka et al. [33] that marketing agricultural products involves the company. According to Jamil et al. [29], the business is one of the service channels for carrying out transactions with prospective buyers.
VI. The effect of Company performance on the performance of supporting subsystems
The original sample value is negative -0.083, which indicates that the direction of influence is antagonistic towards the support subsystem, based on the values in Table 8 above. The results also show a T-statistic value of 0.742 (smaller than the T-Table of 1.9) and a P-value of 0.458 > 0.05, demonstrating that they do not match the criteria. So, the company's performance does not significantly influence the performance of the supporting subsystem; this is because the company does not have a role in the supporting subsystem, only more so in the role as a marketing institution. The company's transport facilities are not used to transport agricultural products in North Toraja Regency because of the difficult access to the location of the plantation area. This needs to follow Aliansyah et al. [34] that companies provide supporting facilities and infrastructure if the community needs assistance. This is related to the company's social responsibility towards the society.
VII. Effect of Coffeeshop performance on downstream subsystem performance
The original sample value based on Table 8 is positive, namely 0.187; this means that the influence given is positive. The P-value of 0.047 is less than 0.05, and the T- Statistic of 1.994 is slightly more significant than the T-Table of 1.98, thus indicating that this factor has a significant influence. In addition, the performance of the coffee shop has a favorable effect on the performance of the downstream subsystem because they are the actors that provide input in the form of processing coffee beans into a coffee powder ready to be served to consumers.
VIII. Effect of Coffeeshop performance on marketing subsystem performance
Table 8 describes the original sample value of 0.173; this shows a positive influence. Meanwhile, in terms of significance, it can be seen from the acquisition of a P-value of 0.016, which is smaller than 0.05, so that it is said that this factor has a significant influence, also indicated by the T-statistic value of 2.363, which is greater than the T-Table of 1.98. This suggests that the coffee shop is an actor acting as the most effective Arabica coffee marketing institution. Coffeeshop is a place that is often sought after by coffee lovers and has even become their lifestyle. This is related to the opinion of Nurdianah [35], the increasingly high lifestyle that is rampant, especially among young people; nowadays, many people think that visiting a coffee shop will complement a person's lifestyle and increase their existence for visitors.
IX. Effect of MSME performance on marketing subsystem performance
The original sample value is 0.441, indicating a positive influence on the performance of the marketing subsystem, based on the path coefficient in Table 8. Then, when viewed from significance, the T-Statistic value of 5.119 is greater than the T-Table of 1.98; this means that it has a significant effect, supported by a P-value of 0.000, which is smaller than the value of 0.05. Thus, MSMEs have a role as marketing institutions for Arabica coffee products. Kedai Kopi is one of the MSMEs, which is a popular place ranging from
Teenagers to adults enjoy coffee gatherings with colleagues and peers. This is in line with the opinion of Kurniawan and Ridlo [36] that people, especially the younger generation today, generally prefer to drink coffee with various variations served in coffee shops.
X. Effect of Agromechanics Industry Performance on Upstream Subsystem Performance
The Performance of the Agromechanics Industry positively influences the performance of the upstream subsystem because Table 8 shows the original sample value of 0.164. In contrast, the interpretation of the results for testing the effect seen from comparing the T-Statistic value of 1.755 is smaller than the T-Table of 1.98. The P-value of 0.080 is greater than 0.05; this means there is no significant effect. The agromechanis industry needs to provide meaningful input on the Arabica coffee commodity because the topography of the coffee plantation area tends to be at an altitude which makes it difficult for this industry to access in helping smallholder coffee plantations.
XI. Effect of Agrochemical Industry performance on upstream subsystem performance
The original sample value in Table 8 shows a negative direction of influence with a path coefficient value of -0.063. Significance is seen from the calculation of the T-Statistic value of 0.495, which is compared to the T-Table value of 1.98; based on this comparison, it indicates no significant effect, then the results are supported by the calculation of the P-Value of 0.621, which is also more potent than the significance value of 0.05. This describes that the performance of the agrochemical industry plays a minor role in the production process of Arabica coffee, where the actors are providers of production inputs. Still, smallholder farmers tend to be traditional and have minimal capital, so they rely only on cheap or free production inputs provided by the government through the Agriculture Office.
XII. Effect of Cooperative Performance on Marketing Subsystem Performance
Based on the calculation of the original sample value of 0.097, this indicates that the direction of the influence of cooperative performance is positive on the performance of the marketing subsystem. The P-value of 0.273 is higher than 0.05, and the T-statistic value of 1.098 is not greater than the T-Table value of 1.98, so it can be interpreted that there is no significant effect. Thus, the role of cooperatives in the marketing subsystem is insignificant because they (cooperatives) only provide post-harvest processing assistance. However, sometimes, sales of ordinary products are made in minimal quantities.
XIII. Effect of Cooperative Performance on Supporting Subsystem Performance
Table 8 presents the results of calculating the original sample value; this factor has a coefficient value of 0.266, which means the element has a positive influence. The significance assessment is seen from the acquisition of the T-statistic value of 2.383 compared to the T-table of 1.98 and the P-value of 0.018, which is smaller than the value of 0.05, indicating a significant influence. So, the cooperative's performance on the supporting subsystem's performance has a positive and considerable effect. Cooperatives in North Toraja have a role as training service providers for farmers and farmer groups that will provide additional knowledge. This will support the performance of other actors or institutions, such as agricultural extension workers who mainly convey non-formal education knowledge in Arabica coffee farming. This is related to the opinion of Kansrini et al. [37] that the role of cooperatives as training business partners, capital facilitators, and motivators in empowering coffee farmers. Budiningsih et al. [38] use farmer cooperatives as a form of organization to facilitate the process of assisting farmers.
XIV. The influence of the Performance of the Gatherers on the performance of the marketing subsystem
The original sample value in Table 8 shows a value of 0.045, so it can be interpreted that there is a positive influence. The P-value of 0.661 is more significant than 0.05. At the same time, the T-Statistic value of 0.439 is smaller than the T-Table value of 1.98, which describes no significant effect of the performance of the collecting traders on the performance of the marketing subsystem. Arabica coffee collector traders encounter obstacles when many marketing chain models are formed; the cause is that companies and cooperatives can also enter the chain that is present as a competitor for collector traders. This is supported by Nasution's [39] opinion that obstacles tend to occur for new collectors because of the strong bonds of cooperation between old collectors or with exporting or importing companies.
XV. Effect of Agricultural Extension performance on the performance of supporting subsystems
Based on the table above, it can be seen that the original sample value is -0.010, indicating that there is a negative effect. Regarding variable significance, the T-statistic value of 0.098 is smaller than the T-Table 1.98, and the P-value of 0.922 is greater than 0.05, indicating no significant effect. So, the performance of agricultural extension workers has a negative and insignificant influence. This is because extension workers in North Toraja Regency have a reasonably large area between one sub-district and another, causing extension workers' access to farmers/growers to be far away, and the intensity of visits to farmer groups is also low. This is related to Hutapea's [40] opinion that two factors influence the performance of extension workers: internal and external. Internal factors include education, age, motivation, training, and tenure. In contrast, external factors include the availability of infrastructure, reward system, working area distance, number of fostered villages, level of farmer participation, and coaching and supervision support.
XVI. Effect of Farmer Group performance on farming subsystem performance
The original sample value is 0.128, meaning there is a positive influence. The significance based on the P-value of 0.190, which is greater than 0.05, and the T- Statistic value of 1.311, which is smaller than the T-Table of 1.98, can be interpreted that there is no significant influence. In other words, farmer group performance positively influences the performance of the farming subsystem but is not substantial. This is because farmer groups only sometimes hold group meetings because they are far apart, and their access (farmers) is mainly traveled by foot.
XVII. The influence of Farmer Group performance on the performance of supporting subsystems
Based on Table 8, the original sample value is 0.105, so it can be interpreted that there is a positive influence. In terms of significance value, it is seen from the P-Value of 0.417, which is greater than 0.05, implies no significant effect; the results of this analysis are also reinforced by the T-Statistic value of 0.813, which is smaller than the Table 1.98. This is due to the role of farmer groups that still need to improve in supporting Arabica coffee production in terms of technical cultivation because farmer group members still apply agricultural systems that tend to be traditional. In addition, Hermanto et al. [41] believe that the low performance of farmer groups is due to the lack of role of farmer group administrators, inactive group members, incomplete and dysfunctional organizational structures, and lack of guidance from extension officers.
XVIII. Effect of Farmer performance on upstream subsystem performance
The original sample value can describe the direction of the effect produced by the statistical test; the initial sample value is 0.454 based on Table 8, so there is a positive effect. In addition, there is a significant effect based on the T-statistic value of 3.245, greater than the T-Table 1.98, and the P-value of 0.001 is smaller than 0.05. Based on these results, it indicates a positive and significant influence. Farmers are the leading actors in providing raw materials for Arabica coffee. Sunanto et al. [42] Farmers, as the main actors of Arabica coffee farming, have an influential role in making decisions on implementing Arabica coffee farming activities. Farmers should receive special attention from all related institutions because the position of farmers is very crucial in terms of Arabica coffee production.
XIX. Effect of Farmer performance on farming subsystem performance
Table 8 shows the original sample value of 0.577, meaning a positive influence exists. While the significance of P-Value 0.000 is smaller than 0.05, and the importance of T-Statistic 7.194 is much greater than T-Table 1.98, it can be interpreted that there is a significant influence. So, from these results, there is a positive and significant influence between farmer performance and the performance of the farming subsystem. These results provide good information that the company is very aware of the importance of paying attention to farmers. The company will only be able to produce coffee powder with Arabica coffee farmers' support, which provides and ensures the availability of raw materials. It is recommended that all institutions in the Arabica coffee agribusiness chain realize the same thing by paying attention to farmers in terms of inputs and cultivation aspects and price protection at the farm level.
XX. Effect of Farmer performance on marketing subsystem performance
The original sample value has a role in determining the direction of influence of a test factor; in Table 8, the path coefficient value is 0.527, which illustrates a positive impact. The significance value also provides an interpretation that a significant effect is seen from the P-value of 0.026, more diminutive than 0.05, and the T-statistic value of 2.235, more potent than the T-Table of 1.98. So, a significant favorable influence exists between farmer performance and marketing subsystem performance. The company in question is a multinational company engaged in post-harvest handling and marketing of Arabica coffee products, so the company plays a critical role as a marketing institution. This company has much treatment in terms of increasing the added value of arabica coffee; besides that, they have also traded internationally to gain profits for their own company and help introduce North Toraja arabica coffee to coffee lovers worldwide.
Based on the results and discussion, there are 11 positive and significant variables, while the other nine have a negative and insignificant effect. The positive and significant variables are the performance of the Agriculture Office on the performance of the supporting subsystem (influenced by the Ability to become a facilitator, regulator and catalyst), the performance of the company on the performance of the farming, downstream and marketing subsystems (influenced by profit, marketing and efficient use of resources), the version of Coffee shops on the performance of downstream and marketing subsystems (influenced by capital facilities, (influenced by capital facilities, access to production facilities and government support), MSME performance on downstream subsystem performance (influenced by capital facilities, access to production facilities and government support and market condition factors in MSMEs), cooperative performance on supporting subsystem performance, farmer performance on 3 subsystems, namely upstream, farming and marketing subsystems (farmer competence, land, Interaction with extension workers, production facilities and Involvement in farmer groups).
The variables that are negative and insignificant are the performance of the agriculture office on the performance of the upstream subsystem, the performance of the company on the performance of the supporting subsystem, the performance of the agromechanical industry on the performance of the upstream subsystem, the performance of the agrochemical industry on the performance of the upstream subsystem, the performance of intermediary traders on the performance of the marketing subsystem, the performance of farmer groups on farming and supporting subsystems, and the implementation of cooperatives on the performance of the marketing subsystem. The variable is insignificant because, based on the P-value greater than 0.05, the T-statistic value is smaller than the T-Table 1.98.
Agribusiness actors with multiple roles cause other actors to have a decreased performance, but actors who take on various parts can obtain maximum profits. Companies carry out the movement of Arabic coffee actors with a strategic role because they have sufficient capital resilience to get a lot of profits. Meanwhile, actors who have low capital can only obtain profits that are also low. Due to overlapping or similar signs, only a portion of the study was completed. The analysis procedure was carried out partially for each actor indicator to produce good analysis accuracy. Therefore, the analysis was carried out separately to avoid high error (unreliability). The limitation of this research is the number of samples used; if a study like this uses a more extensive selection, the findings will provide an accurate picture of the research location. On the other hand, the research had obstacles in collecting data and information because, at the same time, the Toraja tribe organized a year-end traditional event (annual formal party), but we quickly adapted to it.
The performance of Arabica coffee agribusiness in North Toraja Regency can be improved by paying attention to the factors that influence this performance. To assess and evaluate the effectiveness of regional agribusiness subsystems, future researchers should look more closely at the variables affecting the actors' performance in the entire coffee agribusiness subsystem in North Toraja Regency. In addition, existing regulations are expected to be compatible between one agribusiness subsystem and other agribusiness subsystems so that existing rules can benefit not only one subsystem but all subsystems as a whole as an Arabica coffee agribusiness system.
[1] dos Santos, É.M., de Macedo, L.M., Tundisi, L.L., Ataide, J.A., Camargo, G.A., Alves, R.C., Oliveira, M.B.P.P., Mazzola, P.G. (2021). Coffee by-products in topical formulations: A review. Trends in Food Science and Technology, 111: 280-291. https://doi.org/10.1016/j.tifs.2021.02.064
[2] Nasution, B.B. (2018). Export News: Indonesian Specialty Coffee. Ministry of Trade of the Republic of Indonesia.
[3] Centre for Agricultural Data and Information Systems. (2022). Coffee Plantation Commodity Outlook. Secretariat General of the Ministry of Agriculture.
[4] Limbongan, L., Tanan, A., Malamassam, D., Pasulu, I., Sampelawang, P., Palelleng, S., Rantetana, M., Karundeng, S., Rantelembang, Y.G. (2018). Development of Arabica coffee (coffea arabica) innovation system to support Toraja tourism development. Proceedings of the National Seminar on Tourism Based on Research and Technology Tana Toraja.
[5] Saragih, J.R. (2010). Arabica coffee production performance and forecast of its contribution to the regional income of simalungun regency. Journal of Vision, 18(1): 98-112.
[6] Martauli, E.D., Siahaan, L.M. (2019). The effect of entrepreneurial characteristics on the performance of arabica coffee farms in Karo Regency. Journal of Agribusiness Science, 3(1): 16-23.
[7] Gichichi, M.S., Mukulu, E., Odhiambo, R. (2019). Influence of market conditions and performance of coffee smallholders' micro and small agribusinesses in Murang'a County, Kenya. Journal of Strategic Management, 3(1): 50-68.
[8] Juniasih, I.A.K., Windia, I.W., Ambarawati, I.G.A.A., Darmawan, D.P. (2019). The effects of social capital on performance of coffee-based agribusiness SMEs in Tabanan Regency, Bali Province, Indonesia. International Journal of Social Sciences and Humanities Invention, 6(6): 5513-5520. https://doi.org/10.18535/ijsshi/v6i6.05
[9] Saragih, J.R., Harmain, U. (2021). Factors affecting the entrepreneurial performance of Arabica coffee farmers in Dolog Masagal District, Simalungun Regency, North Sumatra Province. Journal of Regional and Rural Development Planning, 5(2): 101-109. http://doi.org/10.29244/jp2wd.2021.5.2.101-109
[10] Putri, A., Paloma, C., Zakir, Z. (2018). Performance of Arabica coffee (Coffea arabica L.) production factors in Gumanti Valley, Solok Regency, West Sumatra. Journal of Agroindustry Technology and Management. https://doi.org/10.21776/ub.industria.2018.007.03.7
[11] Siahaan, L.M., Martauli, E.D. (2019). The effect of entrepreneurial behaviour on the performance of Arabica coffee farms in Karo Regency. SNHRP-II: National Seminar on Research and Service Results, Second, 2019. UNIPA Surabaya.
[12] Kurniawan, T., Khoiriyah, N., Machfudz, M. (2023). Factors affecting Arabica coffee farm production (Coffea Arabica) in Donowarih Village, Karangploso District. Journal of Social Economics and Agribusiness, 1(2).
[13] Revadiana, R.A., Lucyana, T. (2021). Determinants of coffee business success (case study at Pt. Sml, West Java). Journal of Agricultural Economics and Agribusiness (JEPA), 5(1): 16-26. https://doi.org/10.21776/ub.jepa.2021.005.01.02
[14] Ahmar, M., Anwar, P. (2016). The role of government in empowering rice farmers in Parumpanai Village, Wasuponda District, East Luwu Regency.
[15] Abdoellah, S., Hartatri, D.F.S. (2021). Analisis Kinerja dan Prospek Komoditas Kopi. Plantation Analysis and Opinion, 2(2): 2-7.
[16] Saputera, D. (2021). Analysis of performance and prospects of Indonesian coffee commodities in domestic and international markets. Journal of Business, Economics, and Science, 1(2): 87-95. https://doi.org/10.33197/bes.vol1.iss2.2021.826
[17] Dhaneswara. (2010). Analysis of Factors Affecting Coffee Shop Profits in Surakarta. Economics Diponegoro University. Semarang.
[18] Anisa, P., Rudi P., Dedi, S. (2020). Structure, behaviour, and performance of red cayenne pepper marketing in Cigalontang District. Journal Agribusiness System Scientific, 1(1).
[19] Dali, I., Fietje S.O., Anneke, K.R., Judy, M.T. (2017). Relationship between field agricultural extension worker performance and the success of beef cattle farmers in Kwandang District, North Gorontalo Regency. Zootek Journal, 37(2): 403-414. https://doi.org/10.35792/zot.37.2.2017.16266
[20] Fadhilah, M., Dini, R. (2021). Income analysis of mangosteen farmers in Simpang Sugiran Village, Guguak District, Limapuluh Kota Regency. Journal of Agribusiness-Informed Scientific Society Thinking, 7(1): 796-804. http://doi.org/10.25157/ma.v7i1.4790
[21] Malta. (2012). Competence of maize farmers in farming on Peatland (Case of Maize farmers on Peatland in Limbung Village, Pontianak Regency, West Kalimantan). Bumi Lestari Journal of Environment, 11(1).
[22] Aji, N., Trisna I.N., Lucyana T. (2020). Analisis Kinerja Sistem Agribisnis Paprika di Kabupaten Bandung Barat. Jurnal Ekonomi Pertanian dan Agribisnis (JEPA), 4(4): 827-837. https://doi.org/10.21776/ub.jepa.2020.004.04.12
[23] Jogiyanto. (2008). Information Systems Research Methodology. Yogyakarta: ANDI Publisher.
[24] Abdillah, W., Hartono, J. (2015). Partial Least Square (PLS) Alternative Structural Equation Modeling (SEM) in Business Research. Yogyakarta: ANDI Publisher.
[25] Harianti, Rosmalah, S., Nurmaya. (2023). Study of upstream agribusiness system and marketing of vegetables in Konda District, South Konawe Regency. Agrisurya, 2(1): 25-31. https://doi.org/10.51454/agrisurya.v2i1.255
[26] Syifa, H., Saidah, Z., Noor, T.I., Djuwendah, E. (2021). The relationship between hybrid corn agribusiness subsystems in Maja District. Journal of Agribusiness Minded Scientific Society, 7(1): 550-563. https://doi.org/10.25157/ma.v7i1.4718
[27] Hotden, L., Nainggolan, Aritonang, J. (2017). Analysis of Cassava Agribusiness Subsystem Integration at Pancur Batu Sub-district Deli Serdang Regency. Agrium, 20(3): 204.
[28] Wahyuningsih, S. (2017). Agribusiness development viewed from institutionalization. MEDIAGRO, 3(1): 9-20. http://doi.org/10.31942/mediagro.v3i1.537
[29] Jamil, M., Budi, S., Indriana, D. (2022). The role of cooperatives in developing cocoa agribusiness systems (Case study: Bireuen cocoa plantation cooperative). AGRIFO Journal, 7(1). https://doi.org/10.29103/ag.v7i1.11613
[30] Najamuddin. (2018). Performance of the agriculture and livestock service office in efforts to increase farmer productivity in West Aceh District. Journal of Public Policy, 4(2): 11-22. https://doi.org/10.35308/jpp.v4i2.1043
[31] Wiwing, A., Razak, A.R., Parawangi, A. (2021). The role of the agriculture office in the farmer welfare improvement program in Bima Regency, West Nusa Tenggara. Journal of Scientific Studies of Public Administration Students (KIMAP), 2(3): 924-937.
[32] Arfiayanto, Purnama, N. (2022). Implementation of raw material control to achieve the production target of PT Kaltim Prima Coal in 2021-2022. Journal of Management Selectivity, (3): 205-213.
[33] Asmarantaka, R., Winandi, J., Atmakusuma, Y.N., Muflikh, dan Rosiana, N. (2017). The concept of agribusiness marketing: An economic and management approach. Indonesian Agribusiness Journal, 5(2): 151-172. https://doi.org/10.29244/jai.2017.5.2.151-172
[34] Aliansyah, Jamal, M., Linggi, R.T. (2018). The role of PT harapan sawit sejahterah in improving community empowerment in Modang Village, Kuaro District, Paser Regency. Journal of Government Science, 6(3): 1155-1168.
[35] Nurdianah, I. (2019). Analysis of the influence of market orientation, product innovation, and entrepreneurial orientation on competitive advantage and marketing performance (study on cafe in Semarang). Diponegoro University.
[36] Kurniawan, A., Ridlo, M.R. (2010). Consumptive behaviour of adolescent coffee shop connoisseurs. Journal of Sociology DILEMMA, 32(1): 9-22.
[37] Kansrini, Y., Zulfiyanti, A., Mulyani, P.W., Pirmansyah, D. (2020). The role of cooperatives in empowering coffee farmers in Mandailing Natal Regency. JOSETA: Journal of Socio-Economics on Tropical Agriculture, 2(2). https//doi.org/10.25077/joseta.v2i2.241
[38] Budiningsih, E., Hardjanto, Hero, Y. (2019). Analyzing the role of cooperatives in community forest management in Kebumen. Journal of Natural Resources and Environmental Management, 9(2): 327-336. http://doi.org/ 10.29244/jpsl.9.2.327-336
[39] Nasution, A.H., Ratna, W., Asmarantara, Lukman M.B. (2015). Gambir marketing efficiency in Lima Puluh Kota District, West Sumatra. Scientific Bulletin of Litbang Perdagangan, 9(2): 221-240. https://doi.org/10.30908/bilp.v9i2.9
[40] Hutapea, T.M. (2012). Analysis of Strategies to Improve the Performance of Agricultural Extension Workers in Serdang Bedagai Regency. USU. Medan.
[41] Hermanto, S., Fachrista, I.A., Zikril. (2010). Principal report: Integrated cattle development in Central Bangka Regency. Agricultural Research and Development Agency, Ministry of Agriculture, and Central Bangka District Government.
[42] Sunanto, Salim, Abdul, W.R. (2019). Analysis of agreement to increase Arabica coffee productivity in regional development in North Toraja Regency. Jurnal Sosial Ekonomi Pertanian, 15(1): 42-55. https://doi.org/10.20956/jsep.v15i1.6369