Isabella Maria Lami![]() | Francesca Abastante
| Francesca Abastante![]() | Beatrice Mecca*
| Beatrice Mecca*![]() | Elena Todella
| Elena Todella![]()
© 2024 The authors. This article is published by IIETA and is licensed under the CC BY 4.0 license (http://creativecommons.org/licenses/by/4.0/).
OPEN ACCESS
Is it possible to visualize in an immediate and powerful way the indicators that measure the sustainability of cities? While the final answer is rather positive, the process of getting there is quite complex and dense with difficulties as illustrated in this paper. The 2030 Agenda and the Sustainable Development Goals (SDGs) constitute a fundamental apparatus for measuring and observing Countries based on specific analysis systems, but without an integration with spatial analysis tools as Geographic Information Systems (GIS). Although the potential of the latter in capturing efforts toward sustainable development is recognized by the United Nations (UN), their use in analyzing systems is limited considering data operability issues in terms of spatial and temporal accuracy and proprietary diffusion modes. This paper aims at bridging the gap between urban sustainability analysis and GIS tools, testing the integration of SDG11 indicators and GIS within the Italian context. The research here investigates the applicability and potential of such integration by considering the target 11.1 and 11.3 by focusing on a case study, the City of Turin (Piedmont, Italy). In operational terms, this paper implements an open access WebGIS database providing new spatialized sub-indicators based on the use of open data at the local urban scale.
SDG11 indicators, Geographic Information Systems (GIS), spatial analysis, sustainable development measure
The 2030 Agenda and the Sustainable Development Goals (SDGs) constitute an existing apparatus for measuring and observing countries based on a specific system that runs into operational problems: current statistical indicators of Sustainable Development (SD) are typically nonspatial and assume a spatial homogeneity related to the scale adopted [1, 2].
This aspect is closely linked to the paradigm shift in the “measurement of sustainability” introduced by the SDGs, with obvious implications with respect to the political and technical dimensions of the phenomena [3-5] underline, the SDGs conveyed a methodological shift towards “governance by numbers”, bringing data into the policy discourse with significant consequences for the types of knowledge required. Until the SDGs, many global development agendas had been mainly qualitative statements concerning social and political priorities [5]. Indeed, in the past, global governance efforts have mainly been based on top-down regulations and market-based approaches [6].
The adoption of the SDGs and quantitative measurement has brought implications on the type of knowledge, thus on how things are conceptualised, and on policy choices, leading to different development norms [5]. As Biermann et al. [7] report, the policy impact of the SDGs still appears to be on a discursive level, but their adoption has fostered mutual learning by governments on strategies and policies to be implemented in the perspective of sustainable development.
Although there is still progress and research to be done in this area for concrete changes at the normative and institutional level [7], the SDGs as a policy tool for governance present themselves as effective in supporting the generation of norms and the communication of urgent priorities [5].
In this context, with the adoption of the “language of numbers”, policy evaluation was intended to be not only about what is included on policy agendas but also about how to measure it and how quickly changes in the desired direction would be achieved.
In measuring sustainability, the spatial aspect also takes on a relevant dimension: urban phenomena are complex and tied to specific contexts and locations, as emphasized also by the epidemiological crisis of COVID-19 [8]. The need to employ spatial analysis tools arises from the necessity to enhance the understanding of the urban environment at a deeper and more specific level, consequently facilitating local decision-making processes [9].
This study fits in this context and focuses on SDG11: “make cities and human settlements inclusive, safe, resilient and sustainable” [10]. Specifically, this paper aims to show one way of bridging the gap between urban sustainability indicators and spatial analysis tools by testing the hypothesis of integrating a selection of SDG11 indicators and Geographic Information Systems (GIS). The integration of statistical and geospatial information can be an essential tool to support governments and local stakeholders in public policy making [9] by explicating the role of statistical and geo-referenced data as an engine for SD that can monitor and predict trends [11].
This paper illustrates one of the results of the national research “QUICHE. Which measurements for which policies? Towards Sustainable Development Goal 11”. The general aim of QUICHE was operatively pursued by providing the public sector with new spatialized indicators, organized in a database, to support the construction and evaluation of sustainable urban policies, through the implementation of a spatial freely available WebGIS database. So, if the first phase of the research involved the proposal of new indicators for SDG11 targets 11.1 and 11.3 [12], this second phase was aimed at spatializing them with respect to a specific case study, the City of Turin (Italy), to reflect on the potential usability of these tools for Public Administration (PA) decision support. The choice of Turin as a case study was particularly stimulating, both because of its size, among the most populous on a national scale, and because of the importance the city itself attaches to aspects of sustainability and livability within the framework of 2030 Agenda [13].
It is important to underline that QUICHE was conceived during the first lockdown related to the spread of the COVID-19 pandemic and was strongly influenced by it. Thus, the research conveyed in this paper moved from a critical reflection on practices in the pursuit of SDG11 in relation to the pandemic propagation and the need to live with it indefinitely. Starting from this premise, three research questions emerged:
(1) What phenomena do we need to look at when we talk about urban sustainability and how do we measure them?
(2) How to localize and spatialize SDG11 indicators from a data-driven operational perspective?
Hence the choice of three SDG11 indicators specifically was derived (11.1.1- “Proportion of urban population living in slums, informal settlements or inadequate housing”; 11.3.1- “Ratio of land consumption rate to population growth rate”, and 11.3.2- “Proportion of cities with a direct participation structure of civil society in urban planning and management that operate regularly and democratically”) not because spatialization reasoning was avulsed for the others, but because at that moment they seemed the most urgent to address. Now that the pandemic emergency is over, it seems possible to affirm that the path outlined for those indicators can also be adapted to other SDG11 targets, which could be a future development of the research.
The paper is structured as follows. Section 2 frames the theoretical background considering the broader perspective of the localization processes of the 2030 Agenda, underlining the role of spatial analysis in measuring SDG11 progress and the data-driven operability issues affecting systems at the local level. Section 3 describes the method used to conduct the research. Section 4 identifies specific data-driven operability issues limiting the analysis and spatialization of indicators and Section 5 presents the procedure used for elaborate data. Section 6 presents and discusses the spatial maps for indicator 11.1.1, 11.3.1 and 11.3.2. Lastly, Section 7 summarizes the conclusions and the future developments.
Localization of the SDGs refers to “the process of defining, implementing and monitoring strategies at the local level” [14].
In the Italian context, this process is proceeding slowly. At the national level, the National Strategy for Sustainable Development (NSSD) provides guidelines for the pursuit of environmental, social and economic sustainability goals [15], based on which each region is called to provide a Regional Strategy for Sustainable Development (RSSD). However, the shift from regional to local territorial scales runs into operational problems [16] related to data availability, accessibility and readability with the result that the NSSD and RSSDs fail to find implementation in spatial government tools [15, 17].
In this panorama, GIS are recognized as tools with high potential at the ability to create “geographic design frameworks” to support the resolution of complex problems [18, 19] and by increasing data generation at the local spatial scale facilitating the integration of conventional statistical processes [9].
Indicators for analyzing SD synthesize information from different spatial components into a single one [20] transforming them into measurable elements using specific data [21, 22]. Within the processes of localization of the SDGs indicators, it is necessary to collect such data at a local level, also paying attention to the necessary spatial component for a stable understanding of the phenomena [16]. Indeed, producing usable and extractable information from the data can be challenging if the geo-referenceable components of the latter are not taken into account: the existence of a large and heterogeneous volume of data can return “a desert of information” [23]. This condition of considerable heterogeneity is particularly evident at the local scale of the territory [22] and especially in Italy, hindering processes of spatial analysis due to certain specificities:
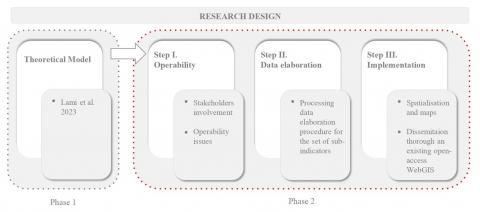
The project QUICHE has been developed according to two phases: i) phase 1 related to the definition of the theoretical model used for the SDG11 indicators implementation; ii) phase 2 concerning the operationalization and application of the set of indicators to the city of Turin, as a case study. We report below a summary of phase 1 (for more information please refer to studies [12, 26]) and the specific steps of phase 2 (Figure 1), addressed in this paper.
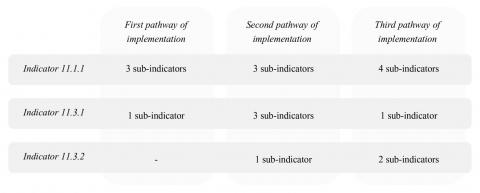
Phase 1. The first phase of the research involved the definition of a theoretical model, consisting of three steps-state-of-the-art analysis, indicator review, and implementation. The theoretical model aimed at proposing a new set of sub-indicators for measuring SDG11 targets 11.1 (with respect to indicator 11.1.1) and 11.3 (with respect to indicators 11.3.1 and 11.3.2). These were identified based on three pathways of implementation, responding to the shortcomings detected in the existing framework (localization, spatialization, and coordination) since they: i) provide a spatialization of sub-indicators, whether existing or new (all the pathways); ii) address the issue of coordination, looking for those existing and measured sub-indicators that are not currently part of the SDG11 framework (the second pathway); and iii) tackle the challenge of localization, proposing new sub-indicators as much as possible at a small scale (all the pathways).
Figure 1. Overall design of the research
Figure 2. Overview of the proposed sub-indicators for indicator 11.1.1 and 11.3.1 [12]
The new set proposed by study [12] consists of 18 sub-indicators, as shown in Figure 2.
Phase 2. The phase of operationalization pursues the goal of integrating spatial analysis tools within urban analysis. Indeed, it considers the localization to the urban scale of existing data observed at the regional level and the spatialization of the sub-indicators proposed in the previous phase. Such sub-indicators are structured within a spatialized database through GIS tools, considering the City of Turin as a case study.
Phase 2 is articulated into 3 steps, namely:
The first action has a theoretical relevance providing an in-depth literature analysis to identify gaps in terms of the actual use of indicators. The second and third actions are related to the case study in exam and are concerned with a survey of existing open access databases at the local level as well as an interaction with local PAs and territorial actors to understand whether the identified gaps were relevant to the case study.
4.1 Literature analysis
Considering the data-driven operability issues of the SDGs indicators, a literature analysis through scientific articles allowed us to underline the main gaps within the analysis, monitoring and localization processes.
The first action concerning the literature search involves the identification of relevant articles on the Scopus database. The query was initiated according to the formulation “monitoring SDG” OR “localizing SDG” AND “GIS” OR “Geographic Information Systems” AND “sustainable development goal”, in a time-frame 2015-2022, to consider the literature published after the 2030 Agenda formulation. The result of this phase brought the identification of 29 references, then evaluated according to their potential relevance for the research, leading to 7 references [30-36].
The data-driven operability gaps identified are:
4.2 Survey of existing open access databases
Once the main operability gaps had been identified on a theoretical level through the literature review, an empirical analysis was conducted to underline such gaps in the real context. Accordingly, the survey involves the exploration of the existing open access databases at the local level of the case study of Turin. This direct investigation confirmed the three gaps identified, underlining available usable data at the local urban scale only for one sub-indicator related to indicator 11.1.1, and 2 sub-indicators related to 11.3.1. Moreover, although available, such data do not report usable spatial and georeferenced information, or they are not updated and need further elaborations. Concerning the other sub-indicators, it is noted that the current data are reported at the spatial scale of the Piedmont Region or Census Area (ACE, Italian acronym). Hence the need for supplementary elaboration in spatial and temporal terms.
4.3 Interaction with local PAs
Further specific evidence on the relevance of the operability gaps to the case study was obtained through an interaction with local PAs and territorial actors. More precisely, the meetings carried out have been:
These meetings allowed, on the one hand, to confirm the specific data-driven operational issues that limit the measurement and the spatialization of SDG11 indicators from the PAs. On the other hand, the territorial agencies, entities and institutes managing territorial data, allowed us to validate and complete the state-of-the-art picture on the available open access data for the case study, considering the local spatial scale, the temporal updating, and the existence of a georeferencing.
Since the state of the art showed the availability of most data on scales larger than the local urban scale and the non-existence of already spatialized information, the district was taken as the unit of analysis. The only exception to this scale is the indicator “Housing market trends” for the analysis of which the so-called OMI zone was chosen.
The choice of the unit of analysis was also influenced by the practices adopted by the WebGIS platform “Metropolitan Geographies” [27] itself, into which the proposed spatialized database is fed. As already mentioned in Section 3, the use of an existing database avoids further duplication and inhomogeneity between sources.
In operative terms, during the application to the case study, the spatialization of the proposed database of the 9 selected sub-indicators depended on dealing with and solving the three gaps identified in the literature analysis (availability of data, inhomogeneity of the databases, heterogeneity of spatial and temporal scale of the available data, mentioned in the above paragraph), by applying data reprocessing procedures (Tables 1-3). These procedures led to differentiate two cases:
To properly measure the indicator 11.1.1, a total of 4 sub-indicators were localized and then spatialized. The regional-scale sub-indicator “Overcrowding rate” was replaced with the sub-indicator “Square meters per occupant in occupied dwellings” produced by ISTAT [42] at the local urban scale. Indeed, the identification of this sub-indicator as a proxy was due to the need to adapt the representation of the crowding phenomenon at the local scale with information that adequately captured the issue by not being too biased. The proxy contains more detailed information than the regional-scale sub-indicator, identifying the average area of space in square meters available to each occupant of the dwelling. Also, even if currently updated to 2011, it results in an already spatialized base for the purpose of any further implementation that considers updated data.
Data processing involved the joint use of open-source statistical and geospatial data, combined in an integrated dataset at the District-level unit of analysis, for a comprehensive and interconnected view of the information.
For indicator 11.3.1, 3 sub-indicators were spatialized. Data processing followed the same logic as above, thus combining open source statistical and geospatial information, in this case updated to 2020. Furthermore, in data processing for all 3 sub-indicators it was possible to proceed with a disaggregation of already existing data on an urban scale, reporting them to the district analysis unit. The disaggregation process took place directly within the GIS environment based on the manipulation of statistical and geospatial information already existing at the urban scale, contained in the regional open-access spatialized database of the Territorial Reference Database of the Piedmont Institutions [43].
For indicator 11.3.2, 2 sub-indicators were spatialized. The data was processed by aggregating both open and proprietary statistical information through a database provided by Urban Lab Torino, updated to 2021. Since the data were already provided at the district analysis unit, a disaggregation process was not required. The procedure consisted of an update of the proprietary information using data from open sources, which were directly collected, systematized in statistical terms, and aggregated in geospatial information for spatialization.
Table 1. Data processing of the sub-indicators related to indicator 11.1.1- “Proportion of urban population living in slums, informal settlements or inadequate housing”
|
Sub-Indicator |
Unit of Measure |
Existing Scale |
Standardized Scale |
Unit of Analysis |
Elaboration |
|
Population living in households with noise from neighbors or from the street |
[%] |
Regional |
Urban |
District |
Joint use of open source statistical and geospatial data aggregated into a single information updated to 2020 |
|
Overcrowding rate |
[sqm/ab] |
Regional |
Urban |
District |
Replaced using the existing sub-indicator “Square meters per occupant in occupied dwellings” as proxy. Although this sub-indicator reports an update to 2011, it returns statistical information on urban scale and moreover, it does not only identify crowding in general terms but the average surface area in square meters available to each occupant |
|
Potential for residential use |
[%] |
Urban |
Urban |
District |
Adding geospatial information to existing census statistical data updated to 2011. Although this sub-indicator reports an update to 2011, it collects usable data on urban scale |
|
Housing market trends |
[%] |
Urban |
Urban |
OMI |
Joint use of open source statistical and geospatial data aggregated into a single information updated to 2020 |
Table 2. Data processing of the sub-indicators related to indicator 11.3.1 “Ratio of land consumption rate to population growth rate”
|
Sub-Indicator |
Unit of Measure |
Existing Scale |
Standardized Scale |
Unit of Analysis |
Elaboration |
|
Soil sealing from artificial land cover per capita |
[sqm/ab] |
Regional and Urban |
Urban |
District |
Disaggregation of existing data to larger scales and joint use of open source statistical and geospatial data aggregated into a single information updated to 2020 |
|
Increase per year of land consumed compared to the previous period |
[ha] |
Regional and Urban |
Urban |
District |
Disaggregation of existing data to larger scales and joint use of open source statistical and geospatial data aggregated into a single information updated to 2020 |
|
Edge density |
[m/sqm] |
Urban |
Urban |
District |
Disaggregation of existing data to larger scales and joint use of open source statistical and geospatial data aggregated into a single information updated to 2020 |
Table 3. Data processing of the sub-indicators related to indicator 11.3.2 “Proportion of cities with a direct participation structure of civil society in urban planning and management that operate regularly and democratically”
|
Sub-Indicator |
Unit of Measure |
Existing Scale |
Standardized Scale |
Unit of Analysis |
Elaboration |
|
Percentage of proposal of Cooperation Agreements accepted |
[%] |
Urban |
Urban |
District |
Joint use of open source and proprietary statistical and geospatial data aggregated into a single information updated to 2021 |
|
Timing of Cooperation Agreements |
[%] |
Urban |
Urban |
District |
Joint use of open source and proprietary statistical and geospatial data aggregated into a single information updated to 2021 |
Concerning the application of the research to the case study, the process involved, as presented in section 4.3, a series of meetings with PAs, agencies, spatial entities and institutes collaborating with PAs. These meetings, in addition to validating and completing the state of the art picture on the open access data available for the case study, made it possible to be aware of the existence of numerous databases containing large volumes of spatial territorial data. Consequently, it was decided to feed the existing platform “Metropolitan Geographies” [27] of Urban Lab Torino, with the idea of conveying data into a platform already active and available to the City of Turin, in a perspective of circularity and sustainability of information. The platform is available to everyone for different purposes: PAs can use it to get a snapshot of the territory on which to base decisions; citizens, institutional and non-institutional bodies can use it to find out how the city is performing on certain issues and thus notice the conditions.
Moving into the details of the maps and data, we observe that the platform “Metropolitan Geographies” [27] makes it possible to query with reference to the sub-indicator measure both at the level of the urban scale of the city of Turin and at the unit of the districts, returning specific and aggregated data through graphs and/or numerical restitution. Also, it allows the reference map to be modified according to the observed sub-indicators (e.g., geographic territory, OpenStreetMap, topographic), in order to return a clear investigation of the phenomena represented.
Within this section for indicator 11.1.1, 11.3.1 and 11.3.2, the information spatialized in the platform is shown. It is worth highlighting that the maps can offer two types of information:
(1) the sub-indicators report insights for the public sector on a phenomenon in their individual reading by comparing the data of the specific sub-indicator among the districts or by comparing the latter with those of the city of Turin. The spatialization of sub-indicators proves to be useful in identifying and visualizing a specific aspect and making it easily comparable between areas of a city;
(2) the sub-indicators provide insights for the public sector on more than one phenomenon, through the cross-reading of data. This is the case of the sub-indicator “Housing Market Trends”, for which an individual reading does not convey additional information to those already provided by other existing databases (i.e., Internal Revenue Service). Instead, the cross-reading of the data on “Housing Market Trends” with those collected on other sub-indicators allows one to understand their potential relationships and influences, favoring the support of decision-making processes towards effective and sustainable solutions.
The maps’ narrative provided in sections 6.1 and 6.2 follows this differentiation by highlighting, through examples of data reading, how GIS allows a rapid visualization of spatial issues and problems. The information that the maps provide is of two types: (i) when the map refers to the entire city, a number, relating to the average value of the phenomenon, and an overview of the trend of the phenomenon shown by the different gradients of color in the various districts, i.e. at increasing values, the color gradient becomes increasingly darker; (ii) when the map refers to a specific district, a number, relating to the value of the phenomenon in that area, and the same color that already refers to that district in the general map.
6.1 Individual reading
6.1.1 Indicator 11.1.1
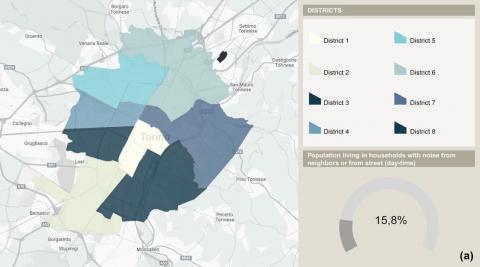
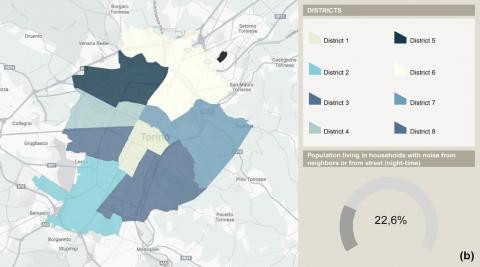
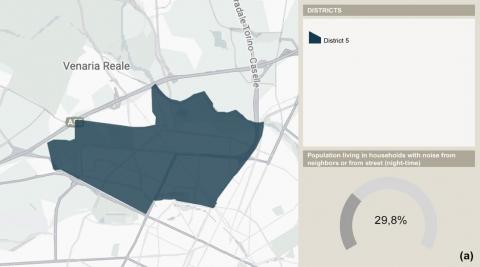
Population living in households with noise from neighbors or from street. The sub-indicator quantifies the percentage of the resident population exposed to noise compared to the limits defined by the Acoustic Classification Plan (PCA, Italian acronym) of Turin. The PCA, in line with national regulations [44], establishes maximum noise parameters, respectively, during day-time (06:00-22:00) and night-time (22:00-06:00) hours by dividing the territory into 6 classes according to land use: (i) protected areas (50dBA-40dBA); (ii) predominantly residential areas (55dBA-45dBA); (iii) mixed areas (60dBA-50dBA); (iv) areas of intense activity (65dBA-55dBA); (v) predominantly industrial areas (70dBA-60dBA); and (vi) exclusively industrial areas (70dBA). Regardless of the prevailing land use of the areas examined, the calculation and spatialization of the sub-indicator take the values of Class II (55dBA-45dBA) as benchmarks which are considered the limits for people leaving it. The sub-indicator aims to provide an innovative reading of acoustic issues hitherto unseen within current spatial government tools. Such a reading sets out to relate the territory and its uses to the population living there. The sub-indicator takes on social as well as environmental significance by highlighting the percentage of people suffering from noise-related problems regardless of whether they live in predominantly residential areas (II) or in other areas (Figure 3 (a) and Figure 3 (b)).
Figure 3. Sub-indicator “Population living in households with noise from neighbors or from street”: day-time period at the urban scale (map a); night-time period at the urban scale (map b)
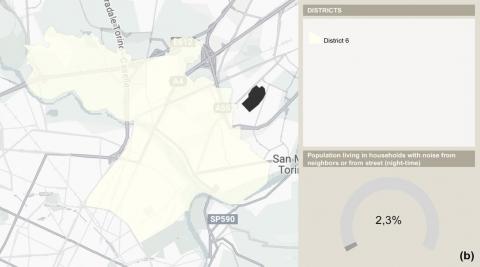
Regarding the sub-indicator “Population living in households with noise from neighbors or the street”, several queries are possible within the “Metropolitan Geographies” platform. First, it is possible to see the situation of the entire city of Turin by distinguishing between day-time and night-time hours. This distinction is fundamental since it follows regulatory indications that provide different acceptability thresholds at different times. As can be seen from Figure 3 (a) and Figure 3 (b), Turin shows discomfort situations for residents in both day-time and night-time (15.8% and 22.6% respectively). This type of query may be of interest to different types of stakeholders (PAs or citizens) to understand the current situation of the city in terms of noise discomfort experienced by residents and consequently be better situated to orient policies and strategies for improvement on a large scale. Second, it is possible to observe the situation of each individual district and, consequently, make comparative reasoning. As an example, Figure 4 (a) and Figure 4 (b) show the situation at night-time for districts 5 and 6 which are both depicted as mixed areas by the PCA. However, the comparison provided in “Metropolitan Geographies” shows that districts 5 and 6 have opposite rates of noise discomfort experienced by residents within the city: 29.8% and 2.6% respectively. Therefore, it is not possible to define common improvement intervention solutions between the 2 districts and it is necessary to intervene separately. Spatialization of the sub-indicator “Population living in households with noise from neighbors or from the street” can thus on the one hand support decision-making through effective communication of the noise phenomenon but also contribute to the identification of a social dimension of the phenomenon itself that, if integrated with the environmental reading of noise issues brought by the PCA can certainly support strategic and sustainable decision-making.
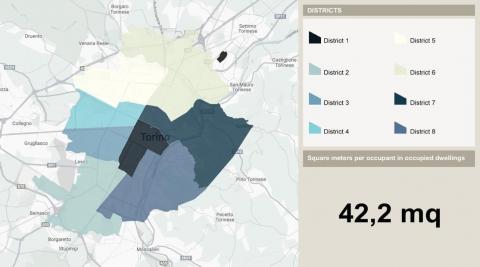
Square meters per occupant in occupied dwellings. This sub-indicator identifies the average area available to each resident within dwellings measured in square meters and is used within ISTAT’s dissemination system called “8milaCensus” [42]. Although similar to its predecessor “Overcrowding Rate”, the “Square meters per occupant in occupied dwellings” sub-indicator is a proxy that has several advantages. First, the definition of the concept of overcrowding rate is not homogeneous at the European level [45, 46] and therefore lends to vague and potentially biased interpretations of the phenomenon given the difficulty of measurement. This is not the case for the sub-indicator “Square meters per occupant in occupied dwellings” being expressed in square meters, a quantity recognized and accepted as a suitable parameter for measuring phenomena relevant to the housing market. Second, this sub-indicator naturally contains within itself a spatial significance and is therefore easy to read and update (Figure 5).
Figure 4. Sub-indicator “Population living in households with noise from neighbors or from street”: night-time period within the District 5 (map b); night-time period within the District 6 (map c)
Figure 5. Sub-indicator “Square meters per occupant in occupied dwellings”: urban scale
Figure 6. Sub-indicator “Potential for residential use”: urban scale
Also, for the “Square meters per occupant in occupied dwellings” sub-indicator, the “Metropolitan Geographies” platform allows multiple queries at the city and district scale. Figure 4 (a) shows how, on average, Turin’s inhabitants have 42.2 sqm available inside their dwellings, a value that is much higher than the housing and sanitation suitability limits that set 14 sqm per inhabitant as the minimum limit of habitability [47]. This type of query also makes it possible to see where the city ranks in relation to other Italian or European cities and thus understand whether policies for housing improvement are appropriate, possible or necessary.
Querying by individual districts, on the other hand, goes in the direction of supporting local strategies such as, for example, the Social Inclusion Plan (PIS, in the Italian acronym) promoted by the Turin PA and aimed at co-designing strategies to combat material deprivation and social marginalization [48]. The PIS, although defined in 2018, took on strategic importance during the period of the COVID-19 pandemic, which brought out strongly problematic housing situations and new needs [49] also in terms of residences’ size. Having a sub-indicator expressed in square meters can therefore be an effective and supportive tool for PAs in identifying the most problematic areas of the city [50] in terms of overcrowding or, on the contrary, highlight the underutilization of certain properties. In the latter case, if they are properties belonging to public affordable housing bodies, one could rethink a redistribution of space, new housing surfaces, new criteria for allocating houses. This type of spatialized sub-indicator does not have the ambition to define a phenomenon as much as to effectively communicate it according to the most classic use of visualization tools such as helping stakeholders to ‘‘get on the same page’’ [51] and to have a collective insight [52] about issues. In this sense, such spatialized sub-indicator can be supportive in decision-making processes involving experts and citizens with different skills, needs and sensitivities but who are all part of the same co-design strategy.
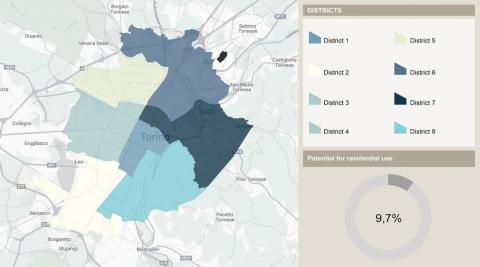
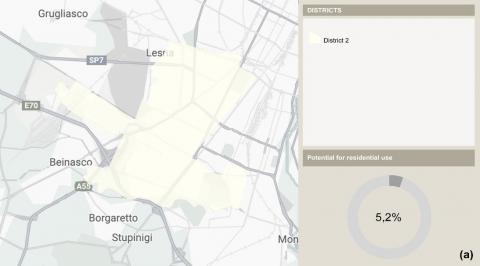
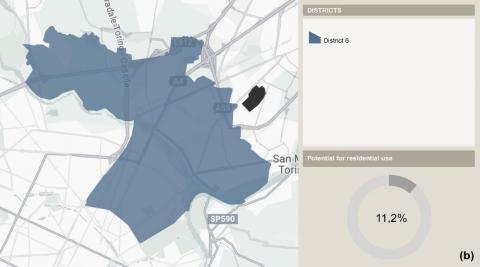
Potential for residential use. This sub-indicator, currently used within the “8milaCensus” database [40], returns the percentage share of unoccupied dwellings in relation to the total number of dwellings in the area under consideration. This sub-indicator is closely related to the previous “Square meters per occupant in occupied dwellings” sub-indicator and is its flip side. If in fact the sub-indicator “Square meters per occupant in occupied dwellings” aims to highlight a phenomenon of overcrowding, the sub-indicator “Potential for residential use” is aimed at identifying underutilized residential spaces. The issue of abandoned or unused architectural heritage is one of the main problems of contemporary cities and at the same time a significant resource for SD [53]. This view of unused buildings as a source of community resilience for PA policies [54] emerged during the pandemic period of COVID-19 when such buildings became a resource for temporary reversible adaptations of urban space and the enhancement of neighborhood facilities [55].
It is important to emphasize that the “Potential for residential use” sub-indicator is innovative for Turin’s policies since the current spatial government instruments deal with the issue of unused real-estate stock in general terms without delving into the types of such stock, except for brownfields. This attitude of untimely knowledge of the territory sometimes leads to the waste of huge financial resources and/or the establishment of inappropriate housing policies.
From Figure 6, the city of Turin has little housing potential (9,7%), which indicates how difficult it is to draw on the available stock in situations of housing emergency or vulnerability.
However, looking at several districts reveals very different situations. If district 2 for example has almost no housing potential (Figure 7 (a)), the same cannot be said for district 6 (11,2%) (Figure 7 (b)). This information becomes significant and interesting for the PA if read, for example, in superimposition on the Urban Recovery Plan (PRU in the Italian acronym) of which district 6 was the subject. The PRU provided for real estate and social interventions in co-design with the residents of the area, which could have taken on greater social sustainability value if observed from the perspective of the “Potential for residential use” sub-indicator. Currently, this spatialized sub-indicator could be useful in the activation of Neighborhood Contracts, PA tools aimed at urban and building redevelopment with priority attention to social and residents’ aspects. In this sense, the choice on which areas Neighborhood Contracts should be activated can be guided not only by housing distress but also by the residential potential that the area itself can offer.
Figure 7. Sub-indicator “Potential for residential use”: within District 2 (map a) and District 6 (map b)
In this context, the spatialization of underutilized residential buildings and the visualization of the areas of the city most affected by this phenomenon goes in the direction of rapid and efficient integration and communication of diverse information. Accordingly, the PA is supported in: i) establishing housing emergency plans; ii) knowing the areas of the city where it is possible to settle affordable housing complexes through the practice of adaptive reuse [56]; iii) identifying financial incentives to private actors to promote the practice of reusing disused buildings and decrease land consumption; and iv) defining new tools and strategies for the territory.
6.1.2 Indicator 11.3.1
In this section, we show the spatialization and comment on the sub-indicators “Increase per year of land consumed compared to the previous period”, “Soil sealing from artificial land cover per capita”, and “Edge density”. Data for the three sub-indicators of 11.3.1 target are collected at the urban scale by the Piedmont Region (BDTRE). However, the present research takes a step forward by disaggregating and spatializing the data at the district scale so as to better contribute to the definition of urban policies and strategies which must necessarily consider the specificities of different portions of the territory from the perspective of sustainability. Unlike the sub-indicators illustrated so far, the three sub-indicators pertaining to 11.3.1 all go in the direction of defining the same phenomenon related to urban land consumption looking at it from different perspectives. This phenomenon is recognized as one of the main causes of the deterioration of ecosystem balances, flood risk and climate change in general terms, and it is therefore necessary for PAs to be able to identify concrete actions that can contain it [57-60].
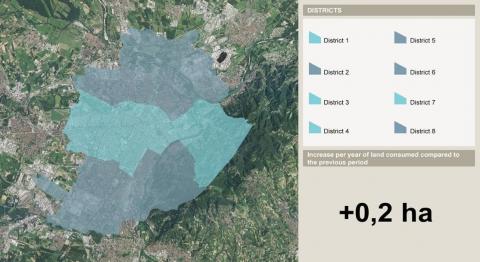
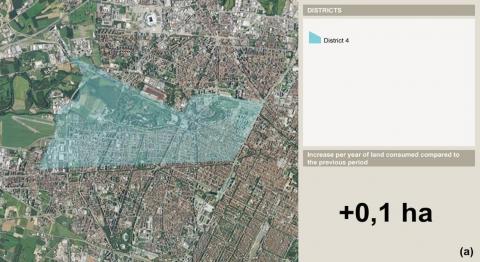
Increase per year of land consumed compared to the previous period. This sub-indicator (Figure 8) aims to show the difference of urban land consumed in hectares in 2019-2020 and the land consumed in 2019 from data collected by ISPRA [61, 62]. Unlike ISPRA data that return a net value of land consumption in percentage terms, this sub-indicator is diachronic. Thus, the innovation lies in the possibility of observing densification trends within the urban area over a given period in line with the perspective taken by current strategies.
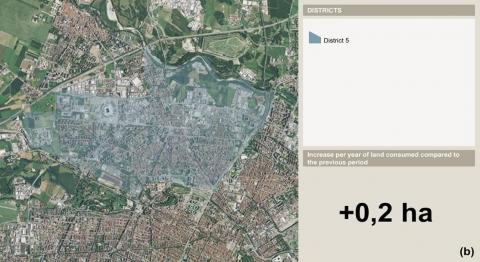
As shown in Figure 8, the city of Turin saw an increase in land consumption of 0,2 hectares during the reference period. In this case, the map shows only two colors, as the values recorded for some districts are the same. The same trend can be observed in all districts with some notable differences. For example, Districts 4 and 5 show different levels of urban land consumption growth (0,1 hectares and 0,2 hectares respectively) despite having a similar urban tissue and being adjacent. Therefore, the ability to observe this spatialized sub-indicator allows us to understand which districts show unfavorable urban land consumption trends. Through spatialization it is also possible to develop integrated reasoning that helps to quickly understand the possible causes for such consumption in particular areas and therefore be better situated in future decision-making processes. Taking districts 4 and 5 as examples (Figure 9 (a) and Figure 9 (b)), it emerges how they have very different sizes and densities of the built environment. District 4 is small, characterized by the presence of a river and therefore subject to hydrogeological buffer strips that naturally contain the possibility of further land consumption. In contrast, District 5 is large, not subject to hydrogeological risk, and has a lower built density than the previous one extending toward undeveloped areas. By spatializing this sub-indicator, it is therefore possible to state that District 5 should be given attention by the PA within land-use government tools and urban SD strategies to achieve the global and European goals of zero net land consumption by 2050 [63].
Figure 8. Sub-indicator “Increase per year of land consumer compared to the previous period”: urban scale
Figure 9. Sub-indicator “Increase per year of land consumer compared to the previous period”: within the District 4 (map a) and the District 5 (map b)
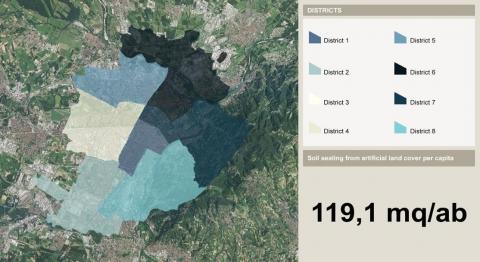
Soil sealing from artificial land cover per capita. This sub-indicator (Figure 10) quantifies the area per capita occupied by artificial land cover resulting in total or partial soil sealing. This sub-indicator was calculated using the ratio of the district’s impervious area in square meters to the district's total population. In line with the analyses carried out by ARPA [64], the artificial cover considered includes permanent buildings and infrastructure and does not take into account temporary structures. The sub-indicator “Soil sealing from artificial land cover per capita” is complementary to the previous “Increase per year of land consumed compared to the previous period” providing a reading of the urban land consumption phenomenon in social terms and impact on the quality of life. Intense soil sealing, in fact, has strong negative consequences on the balance of ecosystems [60] and consequently affects the well-being of individuals in terms of increased chances of spreading infection diseases [65], increased stress, decreased emotional well-being, increased sense of insecurity as well as decreased chances of social cohesion and interaction [66].
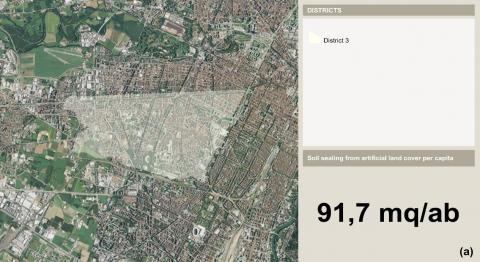
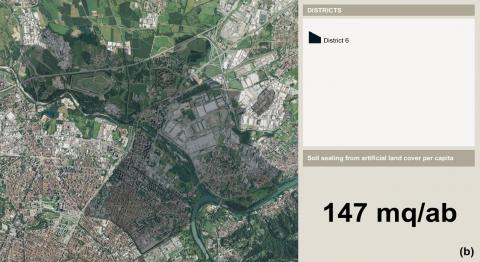
Figure 10 shows that the ratio of “Soil sealing from artificial land cover per capita” is 119,1 sqm/inhab considering the whole city of Turin. In general terms, this is a good performance compared to the same ratio calculated for the entire Piedmont Region (300 sqm/inhab- [64]). However, significant differences emerge by observing the data for each district. Looking, for example, at districts 3 (Figure 11 (a)) and 6 (Figure 11 (b)) we note how these have a ratio 91.7 and 147 sqm/inhab respectively placing district 6 as the worst in the city. Looking at the spatialized data it is possible to notice that this district is characterized by the presence of industrial warehouses, manufacturing areas and a major landfill. Similarly to the previous one, the possibility of visualizing the sub-indicator “Soil sealing from artificial land cover per capita” spatialized would allow the immediate reading of different phenomena and the consequent conduct of faster decision-making processes capable of relating causes and effects.
Figure 10. Sub-indicator “Soil sealing from artificial land cover per capita”: urban scale
Figure 11. Sub-indicator “Soil sealing from artificial land cover per capita”: within District 3 (map a) and District 6 (map b)
In general terms then, the spatialized “Soil sealing from artificial land cover per capita” sub-indicator can support PA on the one hand in monitoring urban sprawl and the resulting soil sealing and loss of green areas, and on the other hand in empirically identifying possible causes of an unfavorable situation. Monitoring the urban land in these terms is relevant both in a general world scenario of increasing urban land consumption and in an Italian scenario where an increasing trend of consumed soil per capita has been recently recorded [64]. Supporting PAs in identifying the most sealed areas of the city can facilitate targeted action to limit transformations with negative impacts on soil consumption and encourage interventions to return green spaces to the city. This is crucial for the green transition and SD of cities, given the UN and European targets of zero net land consumption by 2050 [67].
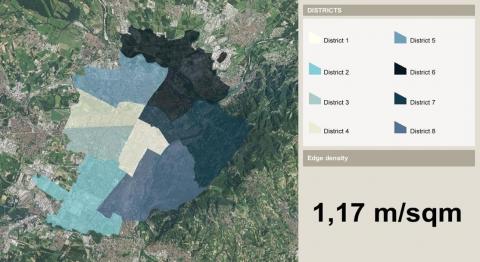
Edge density. This sub-indicator aims to describe the fragmentation of the urban tissue in terms of the density of the built landscape. In line with the literature [68, 69], the “Edge density” was calculated as the ratio of the total sum of the perimeters of polygons of built-up areas to their area. In this view, the higher the value of the sub-indicator, the greater the fragmentation of the urban tissue while low values correspond to dense landscapes dominated by a few large patches in terms of built-up areas. The “Edge density” is considered one of the most important sub-indicators in the measurement of land consumption [69] as it can provide indications regarding the forms of urbanization and settlement typology of a city, allowing analysis with respect to the ways in which the phenomena of urban sprawl and dispersion occur.
Current land-use policies measure the “Edge density” with reference to the municipal scale thus going to observe how the city grows outward in a diffuse way causing a possible loss of boundaries between urban and rural [68]. Loss of such boundaries is an important driver of ecological change [70] being the cause of destruction of natural environments and loss of key animal species.
The sub-indicator presented in this research takes a leap in scale by going to measure the “Edge density” for each district in the city of Turin and then analyzing the urban form at the edges of the districts.
As shown in Figure 12, the city of Turin has an overall low edge density value (1.17m/sqm). In fact, Turin is a dense city in which the major urban land problems lie in the intensive land use and not so much in its dispersion and fragmentation [69], which occurs mainly at the boundaries of the municipality where Turin encounters other small-medium and/or rural realities.
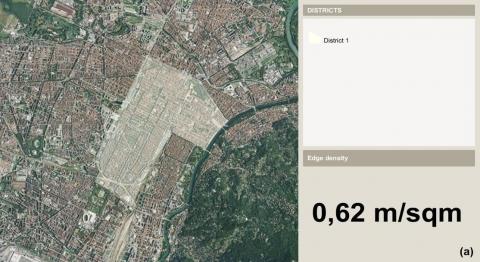
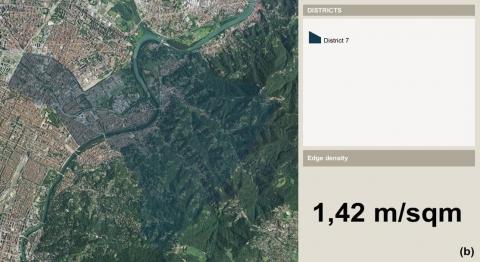
Comparing the central district 1 (0.62m/sqm) (Figure 13 (a)) with the marginal district 7 (1.42m/sqm) (Figure 13 (b)) shows a significant disparity in the performance of this sub-indicator. Theoretically, the “edge density” could be read oppositely between the interior and exterior of the city. It could be argued that if the interior of the city is already urbanized and partly compromised, land-use governance tools could lean toward further urbanization of the central areas (within the limits of saturation) justified by the nature of the urban economy [71]. This could contain the phenomenon of urban sprawl [72] and the impairment of natural ecosystems at the outer boundaries of the city.
Looking at Figure 12, however, it is possible to see how this theoretically grounded reasoning cannot be valid for the city of Turin. Indeed, not only District 1 has a very low “edge density” but it is visible how the area is close to saturation. Beyond the historic protected area of the Royal Gardens, district 1 has meager residual green spaces, necessary for the containment of the spread of heat islands, the mitigation of hydrogeological risk and the quality of life of citizens [73]. In contrast, District 7 is highly fragmented as it extends towards the green spaces of the hill and the Basilica di Superga Natural Park, and it is therefore impossible and inappropriate for the PA to push for further urbanization of the hillside soil which is an important ecosystem protected by UNESCO [74].
The spatialized “edge density” sub-indicator can therefore be of interest to PA in the context of a decision-making process related to the definition of sustainability strategies since it allows to assess the fragmentation of the landscape and at the same time to understand the reasons for this fragmentation while better guiding future choices [12].
Figure 12. Sub-indicator “Edge density”: urban scale
Figure 13. Sub-indicator “Edge density”: within the District 1 (map a) and the District 7 (map b)
6.1.3 Indicator 11.3.2
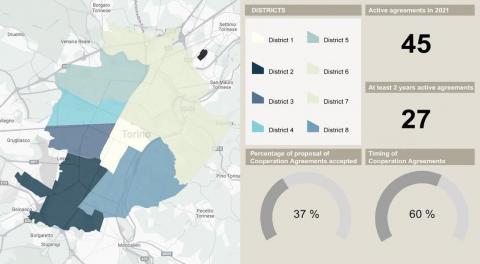
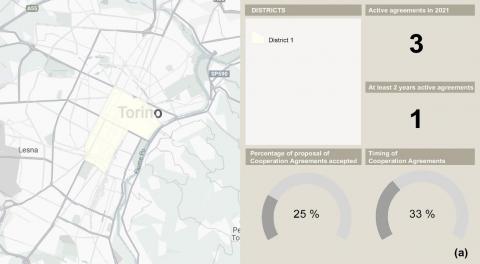
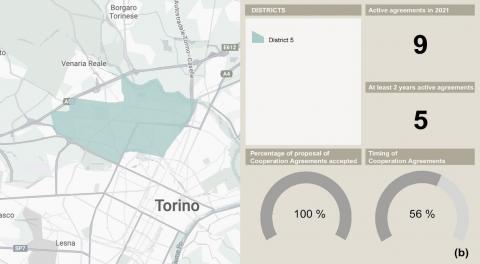
This section aims to investigate the phenomenon of Cooperation Agreements through the analysis and spatialization of the sub-indicators “Percentage of Cooperation Agreement proposals accepted” and “Timing of Cooperation Agreements”. The Cooperation Agreements are considered fundamental tools for sustainable transition from a social sustainability perspective because they are 2-year legal instruments that can enhance the relationship between cultural heritage and territory [75, 76].
For the purposes of spatialization, the data of the sub-indicators “Percentage of proposals for collaboration agreements accepted” and “Timing of collaboration agreements” were elaborated from information made available by the City of Turin [77] and the Torino Urban Lab association [28]. The innovation of the spatialization proposed here is to provide an aggregated reading of the 2 sub-indicators in a single geo-referenced visualization to facilitate the understanding of the social phenomenon of collaboration agreements in terms of both size and time distribution.
Percentage of proposal of cooperation agreements accepted and Timing of cooperation agreements. The sub-indicator “Percentage of proposal of cooperation agreements” identifies the percentage share of accepted Cooperation Agreements out of the total number of those proposed, providing a measure of the active role of citizens in taking care of the city’s commons, while monitoring the PA’s ability to promote and intercept activism.
The “Timing of cooperation agreements” sub-indicator, on the other hand, identifies the success of Cooperation Agreements beyond the legal 2-years deadline in percentage terms.
Figure 14 shows that in the entire city of Turin, 45 cooperation agreements are active of which 27 have a duration of at least 2 years. Looking at the percentages, it can be seen that only 37% of the proposed cooperation agreements have been accepted by the PA, but these, although not large in number, seem to be effective considering that the 60% are continuing beyond the legal term.
Figure 14. Sub-indicators “Percentage of Cooperation Agreements accepted” and “Timing of Cooperation Agreements”: urban scale
Figure 15. Sub-indicators “Percentage of Cooperation Agreements accepted” and “Timing of Cooperation Agreements”: within District 1 (map a) and District 5 (map b)
Moving down the scale and looking, for example, at districts 1 and 5 (Figure 15 (a) and Figure 15 (b)), it is visible how the situation is varied across the city’s territory. In district 1 only 1 cooperation agreement has been active for more than 2 years and only 25% of the proposed agreements have been accepted with a success rate of 33%. On the other hand, in district 5 the situation is very different: 5 cooperation agreements have been active for more than 2 years, all proposed agreements have been accepted with a success rate of 56%. These differences could be attributable to various urban, social or political reasons. These data, read in an integrated way, could lead the PA to different conclusions regarding its own inability to promote effective collaborative agreements, the inertia of the population of some districts in proposing social initiatives in synergy with the PA, or simply the different usefulness of collaborative agreements depending on the urban and social tissue of the districts.
Regardless the conclusions, the integrated and spatial monitoring of cooperation agreements has relevant implications for the PA to implement the PIS and outline strategies aimed at social awareness, administrative innovation, and the construction of innovative tools aimed at stimulating the capacity for autonomy of non-institutional actors.
6.2 Cross-reading
6.2.1 Housing market trends sub-indicator
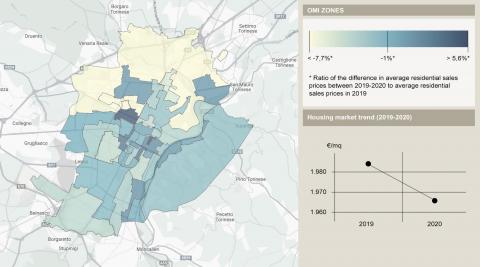
This sub-indicator observes the housing market trends in terms of average sales prices of residential properties in the OMI zones for the 2019-2020 reference period as collected in the Internal Revenue Service’s open-access database. The sub-indicator was calculated using the ratio of the difference in average residential sales prices between 2019-2020 to average residential sales prices in 2019 (Figure 16).
The information about the housing market of Turin can be found in a variety of open-access sources that can be easily consulted on both local and national databases. The relevance of spatializing this sub-indicator therefore lies in the possibility of being viewed and read cross-referenced against other sub-indicators within the same “Metropolitan Geographies” platform to understand relationships of mutual influence.
The ability to integrate information from a variety of sources, collected for different purposes and in different timespan is one of the recognized advantages of GIS tools. Indeed, it has been shown how this ability can lead to effective urban policies and strategies that can prevent possible disasters [78].
Figure 17 reports the housing market trend for the city of Turin that shows a decrease in housing sales prices demonstrating the general trend of the Italian housing market in the 2 years of reference [79].
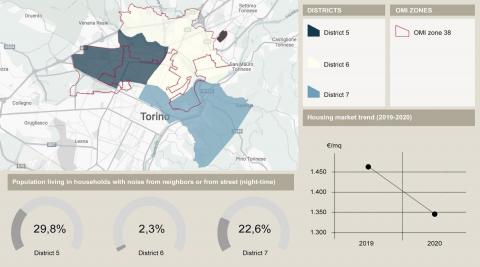
Figure 17 makes a leap in scale by showing the housing market trend in the OMI zone 38 “Northwest Crown”. That OMI zone shows an inflection in average sales prices but is very large in size, overlapping with 3 districts of the city. This makes it difficult to understand what the potential detailed reasons for the decrease in sales prices are. For example, if we look at this sub-indicator in overlap with the one Population living in households with noise from neighbors or from street we notice that for districts 5 and 7, the inflection in sales prices could be also due to a decline in the housing demand due to a noise discomfort perceived by the residents (29.8% and 25% respectively). On the contrary, the same reasoning cannot be done for district 6 where the noise discomfort is not present (2.3%). Looking at the same data, a completely different reasoning could also be made: since all districts that fall within OMI zone 38 show the same inflection in housing sales prices but not the same noise discomfort, the reasons for the inflection in the housing market trend must be sought elsewhere.
Figure 16. Sub-indicators “Housing market trend”: urban scale
Figure 17. Cross-reading of sub-indicators “Housing market trend” and “Population living in households with noise from neighbors or from street” (night-time): OMI zone 38 and districts 5-6-7
Obviously, those reasoning are interpretative hypotheses aimed at illustrating the potential offered by the cross-visualization of the sub-indicators in urban settings.
This paper provides an original contribution to the spatialization of some SDG11 indicators illustrating the research path followed for the implementation of an open access WebGIS database, through an application to the City of Turin. New spatialized sub-indicators based on the use of open data at the local urban scale have been provided, showing how the integration of statistical and spatial data is challenging but possible and useful with respect to the definition of spatial governance tools.
The operational difficulties encountered confirmed the obstacles already highlighted in the literature and in the meetings with PA representatives, leading to three different cases of reworking: i) processing considering a temporal update; ii) identification of suitable proxies; and iii) impossibility of spatialization. The three steps necessary to arrive at the outcome, which consists of at least one map for each sub-indicator, were explained in detail, discussing both the theoretical and application aspects.
The case study demonstrates the effectiveness and replicability of our method. By specializing the database through GIS, the analysis of data for a comprehensive understanding of urban phenomena is facilitated, as well as the dissemination of information in open and open-access modes.
Among the limitations of this research, we would like to emphasize how the inhomogeneity of the existing databases, the availability and the spatial and temporal scale of the available data affect the potential use of the database created. Certainly, an investment in terms of mapping and constant updating would be important to make these analyses more and more effectively usable by PAs. What could help in solving this limitation would be the introduction of Artificial Intelligence (AI) into the monitoring and spatialisation process. This step would constitute a new research challenge, as it could potentially entirely modify the way in which data are measured and represented.
As far as the developments of the research, what we would like to verify is the contribution of this type of maps with respect to the construction of sustainable urban policies. To this end, the research envisages a further meeting and exchange phase with the representatives of the PAs and territorial bodies involved. Despite the lack of feedback so far on the actual use of maps within PA procedures, the result of the research seems to be potentially useful to the DMs in their action of monitoring the territory, enabling the integrated reading of different phenomena in specific urban contexts.
We would like to acknowledge the contribution of Marika Gaballo and Torino Urban Lab in the research and in the development of the maps. This work has been co-funded by the Interuniversity Department of Regional and Urban Studies and Planning (DIST), Politecnico di Torino, Italy.
[1] Salvucci, G., Sanna, F.M. (2011). Tra scala geografica e risoluzione dei dati: Metodologie statistiche per l'analisi territoriale: Il caso di Roma. Rivista di Economia e Statistica del Territorio 3: 39-86. http://doi.org/10.3280/REST2011-003003
[2] Rajabifard, A., Sabri, S., Chen, Y., Agunbiade, M., Kalantari, M. (2019). Urban analytics data infrastructure: Critical SDI for measuring and monitoring the national and local progress of SDGs. In Sustainable Development Goals Connectivity Dilemma. CRC Press, pp. 243-255.
[3] Costanza, R., Kubiszewski, I., Pickett, K.E., Trebeck, K., De Vogli, R., Vala Ragnarsdottir, K., Lovins, H., Fioramonti, L., Giovannini, E., Mcglade, J., Mortensen, L.F., Roberts, D., Wilkinson, R. (2020). After the crisis: Two possible futures. The Solutions Journal, 11(3): 112-117.
[4] Lami, I.M., De Franco, A., Moroni, S. (2023). Values, indicators and policies. A reflection starting from sustainability issues and the COVID-19 pandemic. Valori e Valutazioni, (32): 5-16. https://doi.org/10.48264/VVSIEV-20233202
[5] Fukuda-Parr, S., McNeill, D. (2019). Knowledge and politics in setting and measuring the SDGs: Introduction to special issue. Global Policy, 10: 5-15. https://doi.org/10.1111/1758-5899.12604
[6] Biermann, F., Kanie, N., Kim, R.E. (2017). Global governance by goal-setting: The novel approach of the UN sustainable development goals. Current Opinion in Environmental Sustainability, 26: 26-31. https://doi.org/10.1016/j.cosust.2017.01.010
[7] Biermann, F., Hickmann, T., Sénit, C.A., Beisheim, M., Bernstein, S., Chasek, P., Grob, L., Kim, R.E., Kotzé, L.J., Nilsson, M., Llanos, A.O., Okereke, C., Pradhan, P., Raven, R., Sun, Y., Vijge, M.J., van Vuuren, D., Wicke, B. (2022). Scientific evidence on the political impact of the sustainable development goals. Nature Sustainability, 5(9): 795-800. https://doi.org/10.1038/s41893-022-00909-5
[8] Abastante, F., Lami, I.M., Mecca, B. (2020). How COVID-19 influences the 2030 Agenda: Do the practices of achieving the sustainable development goal 11 need rethinking and adjustment? Valori e Valutazioni, 26: 11-13. https://doi.org/10.48264/VVSIEV-20202603
[9] United Nations. (2020). The sustainable development goals report 2020. United Nations Publication Issued by The Department of Economic and Social Affairs, 1-64. https://sdgs.un.org/sites/default/files/2020-09/The-Sustainable-Development-Goals-Report-2020.pdf, accessed on Aug. 23, 2023.
[10] United Nations. (2023). Global indicator framework for the Sustainable Development Goals. https://agenda2030lac.org/estadisticas/global-indicator-framework-sdg.html#data, accessed on Nov. 29, 2023.
[11] Campagna, M. (2020). Geographic information and COVID-19 outbreak: Does the spatial dimension matter? TEMA-Journal of Land Use, Mobility and Environment, pp. 31-44. https://doi.org/10.6092/1970-9870/6850
[12] Lami, I.M., Abastante, F., Gaballo, M., Mecca, B., Todella, E. (2023). Fostering sustainable cities through additional SDG11-related indicators. Valori e Valutazioni, (32): 45-61. https://doi.org/10.48264/VVSIEV-20233205
[13] Torino Vivibile. (2023). https://www.torinovivibile.it/aree-tematiche/, accessed on Nov. 29, 2023.
[14] United Nations Development Group. (2015). Localizing the post-2015 development agenda-dialogues on implementation. https://www.uclg.org/sites/default/files/dialogues_on_localizing_the_post-2015_development_agenda.pdf, accessed on Nov. 29, 2023.
[15] Mecca, B., Gaballo, M., Todella, E. (2023). Measuring and evaluating urban sustainability. Valori e Valutazioni, 32: 17-29. https://doi.org/10.48264/VVSIEV-20233203
[16] Siragusa, A., Proietti, P., Bertozzi, C., Coll Aliaga, E., Foracchia, S., Irving, A., Monni, S., Pacheco Oliveira, M., Sisto, R. (2021). Building urban datasets for the SDGs. Six European cities monitoring the 2030 Agenda. In Luxembourg: Publications Office of the European Union. https://publications.jrc.ec.europa.eu/repository/handle/JRC126179, accessed on Nov. 29, 2023.
[17] Berisha, E., Caprioli, C., Cotella, G. (2022). Unpacking SDG target 11.A: What is it about and how to measure its progress? City and Environment Interactions, 14: 100080. https://doi.org/10.1016/j.cacint.2022.100080
[18] Kumar, D., Singh, R.B., Kaur, R. (2019). Spatial Information Technology for Sustainable Development Goals. Cham: Springer. https://doi.org/10.1007/978-3-319-58039-5
[19] Nabiyeva, G.N., Wheeler, S.M. (2020). Geographic information systems as a tool to support the sustainable development goals. International Journal of Computer and Information Engineering, 14(3): 78-85.
[20] Iriarte, L., Musikanski, L. (2019). Bridging the gap between the sustainable development goals and happiness metrics. International Journal of Community Well-Being, 1(2): 115-135. https://doi.org/10.1007/s42413-018-0012-2
[21] Organization for Economic Co-operation and Development (OECD). (2008). Handbook on Constructing Composite Indicators. Methodology and User Guide. https://www.oecd.org/sdd/42495745.pdf, accessed on Nov. 29, 2023.
[22] Rinaldi, A. (2002). Fonti informative e indicatori statistici per l'analisi socio-economica territoriale. Istituto Guglielmo Tagliacarne. https://www.tagliacarne.it/files/uploaded/Generale/Studi/WORKINGPAPER31.pdf, accessed on Nov. 29, 2023.
[23] Mitchell, G. (1996). Problems and fundamentals of sustainable development indicators. Sustainable Development, 4(1): 1-11. https://doi.org/10.1002/(SICI)1099-1719(199603)4:1%3C1::AID-SD24%3E3.0.CO;2-N
[24] Guarini, R., Tassinari, F. (2000). Statistica Economica-Problemi e Metodi di Analisi. Il Mulino, Bologna.
[25] Ciccarelli, A. (2003). Una metodologia statistica per l'analisi di competitività delle province. Editore non Identificato. https://www.tagliacarne.it/files/uploaded/Generale/Studi/WP_35_03.pdf, accessed on Nov. 29, 2023.
[26] Lami, I.M., Abastante, F., Gaballo, M., Mecca, B., Todella, E. (2022). An updated picture of target 11.1 and 11.3: Pathways of implementation in the light of COVID-19. AIP Conference Proceedings, 2574: 120004. https://doi.org/10.1063/5.0105557
[27] Geografie Metropolitane. https://geografiemetropolitane.it/, accessed on Nov. 29, 2023.
[28] Torino Urban Lab. https://urbanlabtorino.it/, accessed on Nov. 29, 2023.
[29] ESRI. https://www.esri.com/en-us/home, accessed on Nov. 29, 2023.
[30] Ebener, S., Stenberg, K., Brun, M., Monet, J.P., Ray, N., Sobel, H.L., Roos, N., Gault, P., Conlon, C.M., Bailey, P., Moran, A.C., Ouedraogo, L., Kitong, J.F., Ko, E., Sanon, D., Jega, F.M., Azogu, O., Ouedraogo, B., Osakwe, C., Chanza, H.C., Steffen, M., Hamadi, I.B., Tib, H., Asaad, A.H., Torres, T.T. (2019). Proposing standardised geographical indicators of physical access to emergency obstetric and newborn care in low-income and middle-income countries. BMJ Global Health, 4(5): e000778. https://doi.org/10.1136/bmjgh-2018-000778
[31] Victora, C., Boerma, T., Requejo, J., Mesenburg, M.A., Joseph, G., Costa, J.C., Vidaletti, L.P., Ferreira, L.Z., Hosseinpoor, A.R., Barros, A.J. (2019). Analyses of inequalities in RMNCH: Rising to the challenge of the SDGs. BMJ Global Health, 4(4): e001295. https://doi.org/10.1136/bmjgh-2018-001295
[32] Smith, C.D., Jackson, K., Peters, H., Herrera Lima, S. (2020). Lack of safe drinking water for lake Chapala basin communities in Mexico inhibits progress toward sustainable development goals 3 and 6. International Journal of Environmental Research and Public Health, 17(22): 8328. https://doi.org/10.3390/ijerph17228328
[33] Calka, B. (2021). Bivariate choropleth map documenting land cover intensity and population growth in Poland 2006-2018. Journal of Maps, 17(1): 163-169. https://doi.org/10.1080/17445647.2021.2009925
[34] Chalkidou, S., Arvanitis, A., Patias, P., Georgiadis, C. (2021). Spatially enabled web application for urban cultural heritage monitoring and metrics reporting for the SDGs. Sustainability, 13(21): 12289. https://doi.org/10.3390/su132112289
[35] UN-Habitat. (2022). World cities report 2022. Envisaging The Future of Cities. https://unhabitat.org/sites/default/files/2022/06/wcr_2022.pdf, accessed on Nov. 29, 2023.
[36] Calka, B., Orych, A., Bielecka, E., Mozuriunaite, S. (2022). The ratio of the land consumption rate to the population growth rate: A framework for the achievement of the spatiotemporal pattern in Poland and Lithuania. Remote Sensing, 14(5): 1074. https://doi.org/10.3390/rs14051074
[37] Lombardi, P., Abastante, F., Torabi Moghadam, S., Toniolo, J. (2017). Multicriteria spatial decision support systems for future urban energy retrofitting scenarios. Sustainability, 9(7): 1252. https://doi.org/10.3390/su9071252
[38] Moghadam, S.T., Abastante, F., Genta, C., Caldarice, O., Lombardi, P., Brunetta, G. (2023). How to support the low-carbon urban transition through an interdisciplinary framework? An Italian case study. Planning Practice & Research, 38(2): 310-329. https://doi.org/10.1080/02697459.2023.2177012
[39] ISTAT. (2022). Affollamento abitazione. http://dati.istat.it/Index.aspx?DataSetCode=DCCV_ABITAFFOLL, accessed on Jan. 24, 2024.
[40] ISTAT. (2011). Condizioni abitative ed insediamenti: Patrimonio abitativo. https://ottomilacensus.istat.it/comune/001/001272/, accessed on Nov. 29, 2023.
[41] Osservatorio del Mercato Immobiliare 2018. Manuale della Banca Dati Quotazioni dell’Osservatorio del Mercato Immobiliare Istruzioni tecniche per la formazione della Banca Dati Quotazioni OMI. https://www.agenziaentrate.gov.it/portale/documents/20143/265514/Il+manuale+della+banca+dati+OMI_Manuale+2016_vers_2.0+modificata+in+data+02-01-2018.pdf/c2073cce-b58f-cc2d-4827-d52a8b5eac95, accessed on Nov. 29, 2023.
[42] ISTAT. (2011). Condizioni abitative ed insediamenti: Condizioni abitative. https://ottomilacensus.istat.it/sottotema/001/001272/8/, accessed on Nov. 29, 2023.
[43] BDTRE, Base Dati Territoriale di Riferimento degli Enti. https://www.geoportale.piemonte.it/visregpigo/, accessed on Nov. 29, 2023.
[44] Decreto del Presidente del Consiglio dei Ministri 14 novembre 1997. Determinazione dei valori limite delle sorgenti sonore. https://www.gazzettaufficiale.it/eli/id/1997/12/01/097A9602/sg, accessed on Nov. 29, 2023.
[45] Streimikiene, D. (2015). Quality of life and housing. International Journal of Information and Education Technology, 5(2): 140-145. https://doi.org/10.7763/ijiet.2015.v5.491
[46] Sunega, P., Lux, M. (2016). Subjective perception versus objective indicators of overcrowding and housing affordability. Journal of Housing and the Built Environment, 31: 695-717. https://doi.org/10.1007/s10901-016-9496-3
[47] Decreto ministeriale 5 luglio 1975. Modificazioni alle istruzioni ministeriali 20 giugno 1896, relativamente all’altezza minima ed ai requisiti igienico-sanitari principali dei locali di abitazione. Art. 2. https://www.gazzettaufficiale.it/eli/gu/1975/07/18/190/sg/pdf, accessed on Nov. 29, 2023.
[48] Andreotti, A., Mingione, E., Polizzi, E. (2012). Local welfare systems: A challenge for social cohesion, Urban Studies, 49(9): 1925-1940. https://doi.org/10.1177/0042098012444884
[49] Quaglio, C., Todella, E., Lami, I.M. (2021). Adequate housing and COVID-19: Assessing the potential for value creation through the project. Sustainability, 13(19): 10563. https://doi.org/10.3390/su131910563
[50] Jefferies, T., Cheng, J., Coucill, L. (2021). Lockdown urbanism: COVID-19 lifestyles and liveable futures opportunities in Wuhan and Manchester. Cities & Health, 5(1): S155-S158. https://doi.org/10.1080/23748834.2020.1788771
[51] Vennix, J. (1996). Group Model Building: Facilitating Team Learning Using Systems Dynamics. Wiley, London.
[52] Andersen, D.F., Richardson, G.P. (1997). Scripts for group model building. System Dynamics Review: The Journal of the System Dynamics Society, 13(2): 107-129. https://doi.org/10.1002/(SICI)1099-1727(199722)13:2<107::AID-SDR120>3.0.CO;2-7
[53] Lami, I.M. (2020). Abandoned Buildings in Contemporary Cities: Smart Conditions for Actions. SIST 168. Cham: Springer. https://doi.org/10.1007/978-3-030-35550-0
[54] Todella, E., Quaglio, C., Lami, I.M. (2022). Projecting the underused. Increasing the transformation value of residential spaces through their adaptive reuse. In International Symposium: New Metropolitan Perspectives. Cham: Springer International Publishing, pp. 1476-1485. https://doi.org/10.1007/978-3-031-06825-6_142
[55] Polis Lombardia. (2020). Rapporto Lombardia 2020. Studio per la ripartenza dei territori lombardi. https://www.promozionesalute.regione.lombardia.it/wps/wcm/connect/54d0eaac-3511-4543-a8f8-ebd8f7689139/Rapporto%2BLombardia%2B020%2Bvolume%2B2_RIPARTENZA%2B_navigabile.pdf?MOD=AJPERES&CACHEID=ROOTWORKSPACE-54d0eaac-3511-4543-a8f8-ebd8f7689139-nnWuptH, accessed on Nov. 29, 2023.
[56] Robiglio, M. (2016). The adaptive reuse toolkit. How cities can turn their industrial legacy into infrastructure for innovation and growth. Urban and Regional Policy Paper, 38: 1-24. https://www.gmfus.org/sites/default/files/Robiglio_AdaptiveReuseToolkit_Sept16_complete.pdf, accessed on Nov. 29, 2023.
[57] Strollo, A., Smiraglia, D., Bruno, R., Assennato, F., Congedo, L., De Fioravante, P., Giuliano, C., Marinosci, I., Riitano, N., Munafò, M. (2020). Land consumption in Italy. Journal of Maps, 16(1): 113-123. https://doi.org/10.1080/17445647.2020.1758808
[58] Ceccarelli, T., Bajocco, S., Luigi Perini, L., Luca Salvati, L. (2014). Urbanisation and land take of high quality agricultural soils - Exploring long-term land use changes and land capability in Northern Italy. International Journal of Environmental Research, 8(1): 181-192. https://doi.org/10.22059/ijer.2014.707
[59] Haase, D., Nuissl, H. (2007). Does urban sprawl drive changes in the water balance and policy? The case of Leipzig (Germany) 1870-2003. Landscape and Urban Planning, 80(1-2): 1-13. https://doi.org/10.1016/j.landurbplan.2006.03.011
[60] Elliot, T., Torres-Matallana, J.A., Goldstein, B., Almenar, J.B., Gómez-Baggethun, E., Proença, V., Rugani, B. (2022). An expanded framing of ecosystem services is needed for a sustainable urban future. Renewable and Sustainable Energy Reviews, 162: 112418. https://doi.org/10.1016/j.rser.2022.112418
[61] Munafò, M. (2019). Consumo di Suolo, Dinamiche Territoriali e servizi Ecosistemici. Roma, Italy: ISPRA.
[62] ISPRA. (2022). Il consumo di suolo in Italia. https://www.consumosuolo.it/indicatori, accessed on Nov. 29, 2023.
[63] European Commission. (2011). Report on best practices for limiting soil sealing and mitigating its effects. DG Environment, 11 April.
[64] Sistema Nazionale per la Protezione Ambiente (SNPA). (2022). Consumo di suolo: Nel 2021 il valore più alto degli ultimi 10 anni. https://www.snpambiente.it/2022/07/26/consumo-di-suolo-nel-2021-il-valore-piu-alto-degli-ultimi-10-anni/#:~:text=Il%20solo%20 consumato%20pro%20 capite,m2%2Fab%20di%20oggi, accessed on Nov. 29, 2023.
[65] World Health Organization. (2015). Connecting global priorities. Biodiversity and human health: A state of knowledge review. https://www.cbd.int/health/SOK-biodiversity-en.pdf, accessed on Nov. 29, 2023.
[66] Mouratidis, K. (2021). Urban planning and quality of life: A review of pathways linking the built environment to subjective well-being. Cities, 115: 103229. https://doi.org/10.1016/j.cities.2021.103229
[67] European Parliament and Council. (2013). Environment action programme to 2030. https://ec.europa.eu/environment/action-programme/, accessed on Nov. 29, 2023.
[68] Indovina, F. (2009). Dalla cittÀ Diffusa All’Arcipelago Metropolitano. Milano: Franco Angeli.
[69] Marinosci, I., Assennato, F., Congedo, L., Luti, T., Munafò, M. (2015). Forme di urbanizzazione e tipologia insediativa. https://core.ac.uk/download/pdf/54529419.pdf, accessed on Nov. 29, 2023.
[70] Rosa, I.M.D., Gabriel, C., Carreiras, J.M.B. (2017). Spatial and temporal dimensions of landscape fragmentation across the Brazilian Amazon. Regional Environmental Change, 17: 1687-1699. https://doi.org/10.1007/s10113-017-1120-x
[71] Wang, H.C. (2022). Prioritizing compactness for a better quality of life: The case of US cities. Cities, 123: 103566. https://doi.org/10.1016/j.cities.2022.103566
[72] Hejazi, S.J., Arvin, M., Sharifi, A., Lak, A. (2023). Measuring the effects of Compactness/Sprawl on COVID 19 spread patterns at the neighborhood level. Cities, 132: 104075. https://doi.org/10.1016/j.cities.2022.104075
[73] Li, X., Zhou, W. (2019). Optimizing urban greenspace spatial pattern to mitigate urban heat island effects: Extending understanding from local to the city scale. Urban Forestry & Urban Greening, 41: 255-263. https://doi.org/10.1016/j.ufug.2019.04.008
[74] UNESCO. https://www.unesco.org/en, accessed on Nov. 29, 2023.
[75] Fidelbo, E. (2018). Strumenti giuridici di valorizzazione del rapporto tra patrimonio culturale e territorio: Il caso dei patti di collaborazione tra amministrazioni locali e cittadini. Aedon, Rivista di Arti e Diritto on Line 3. https://doi.org/10.7390/92257
[76] Ferroni, M.V. (2022). Rigenerazione urbana e riuso temporaneo dei beni: I beni confiscati alla criminalità organizzata. Sociologia Urbana e Rurale, 128: 71-82. https://doi.org/10.3280/SUR2022-128007
[77] Comune di Torino. (2022). Patti di collaborazione. http://www.comune.torino.it/benicomuni/patti_collaborazione/index.shtml, accessed on Nov. 29, 2023.
[78] Greene, R.W. (2000). GIS in Public Policy: Using Geographic Information for more Effective Government. ESRI Press: Redlands, California.
[79] ISTAT (2021). Mercato immobiliare: Compravendite e mutui di fonte notarile. https://www.istat.it/it/files//2021/03/Flash_Mercato-immobiliare_I-e-II-trim-2020PC.pdf, accessed on Nov. 29, 2023.