Syamsu Rijal*![]() | Munajat Nursaputra
| Munajat Nursaputra![]() | Chairil A.
| Chairil A.![]() | Hasniar Ulang Dari
| Hasniar Ulang Dari![]()
© 2024 The authors. This article is published by IIETA and is licensed under the CC BY 4.0 license (http://creativecommons.org/licenses/by/4.0/).
OPEN ACCESS
Flooding is a type of natural disaster that has occurred frequently in Indonesia since 2012-2022 and occupies the second highest position compared to other types of disasters released by the Indonesian National Disaster Management Agency. In South Sulawesi, flooding occurs every year, especially in areas affected by watersheds, such as the Walanae watershed. Indications of flooding causes include land change and overflows from rivers and lakes. Identifying factors affecting flood occurrence is necessary for the region's watershed management and development planning. This study was conducted to determine the factors that most influence the occurrence of floods and map the level of flood susceptibility in the Walanae watershed using the Frequency Ratio method. The causal factors analyzed in this study are rainfall, Topographic Wetness Index, elevation, slope, land cover, and distance from the river, which are then processed to obtain the Frequency Ratio value. The study results show that the most influential factor is land cover as a water-absorbing medium, with FR probability values of 4.27 and 3.31 in the water body and rice field cover classes. Land use direction needs to be followed up in the Walanae watershed, such as direction and correction of the spatial pattern plan improvements, especially in the spatial pattern of settlements and agricultural land that contribute to high flood impacts.
Frequency Ratio, flood susceptibility, Walanae watershed
Floods are considered the most frequent natural disaster worldwide and cause severe damage [1]. Indonesia is one of the countries that has been hit by floods every year for the past decade [2]. In 2012-2022 based on the National Disaster Management Agency report, floods occupied the first position as the most frequent disaster in Indonesia [3]. The potential for flood disasters in Indonesia is relatively high because some developing areas have low topography (lowlands and flat slopes) and basins [4]. In addition, weak supervision of land use in flood-prone areas is also one of the factors causing flood disasters [5].
According to data from the National Disaster Management Agency (BNPB), flooding is ranked second among several types of disasters after landslides. One of the locations where flooding often occurs in Indonesia is South Sulawesi Province with a record of 54 floods throughout 2022. The main cause of flooding is assumed to be consecutive rainfall both day and night, which causes rainwater discharge to be unable to be accommodated and channeled by rivers and lakes. In South Sulawesi, flooding occurs every year, especially in regencies located in the Walanae watershed such as Maros, Bone, Wajo and Soppeng regencies. Flooding in Bone, Wajo and Soppeng regencies is influenced by overflowing rivers and Tempe Lake, which is one of the priority lakes in Indonesia. The characteristics of floods caused by the overflow of Tempe Lake have a longer inundation period than rivers. Meanwhile, flooding in Maros Regency, which is the upstream part of the watershed, is caused by river water overflowing and inundating the surrounding areas [6]. The complexity of flood events in this watershed is very important to understand its occurrence.
The Walanae watershed has already entered a critical phase due to land use change patterns and is supported by global climate change [3]. The year 2020 was characterized by abnormal earth temperatures and La Nina events, which resulted in extreme weather changes in various regions in Indonesia, especially in South Sulawesi. The La Nina event during 2020 until the end of 2022 caused high rainfall in several areas, especially in the Walanae river basin [7]. The increased rain, lack of water catchment areas, and siltation of Tempe Lake caused significant flooding in Wajo District and four sub-districts in North Bone. In 2021 in Soppeng Regency and Wajo Regency due to the overflow of the Walanae River which submerged some settlements, rice fields, plantations, and other facilities [6].
Disaster susceptibility analysis has gained popularity in Geographic Information Systems (GIS) as it helps gather relevant information about topographic surfaces, land cover, soils, rainfall and other factors that contribute to disaster occurrence. GIS can facilitate spatial data preparation by utilizing remote sensing data for flood susceptibility mapping [8]. Analyzing flood susceptibility in the Walanae watershed can be done using GIS techniques using Frequency Ratio (FR), a quantitative method based on the relationship between the location of floods and the factors that influence them [9].
Several researchers have assessed flood susceptibility using the FR method in the past. The FR method has proven effective in mapping flood hazards [10]. The FR method identifies flood vulnerability zones based on relevant factors, ranging from very high to very low [11]. It is also emphasized by Tehrany et. al. that the FR method is considered 1) simple and easy to implement, because the data used is not difficult to obtain, 2) does not require a long time with a shorter dataset 3) effective for spatial data analysis, because it can produce flood vulnerability maps that provide a visual representation of the areas most likely to be affected by flooding in the future [11].
Therefore, through this research, the use of FR is expected to be the best approach to determine flood vulnerability compared to other hydrological methods that require data sets that are quite difficult to obtain [12]. In addition, the use of FR can determine the correlation between input parameters and results, which describes the factors that cause flooding in the Walanae watershed. Thus, this research is important to decide on the level of flood susceptibility using the FR method in the Walanae watershed based on the factors that cause flood events. The FR assists in identifying and mapping areas at high risk of flooding, and helps in identifying factors that contribute to flood risk in an area. This allows for more targeted and specific mitigation planning.
2.1 Research location
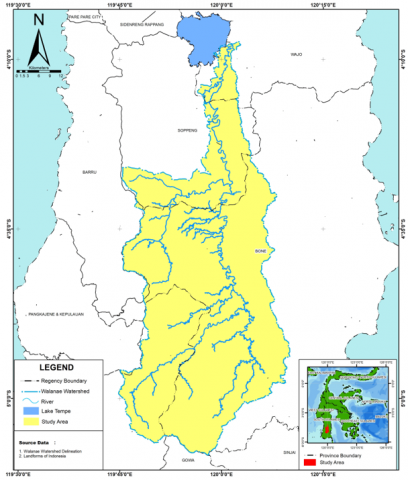
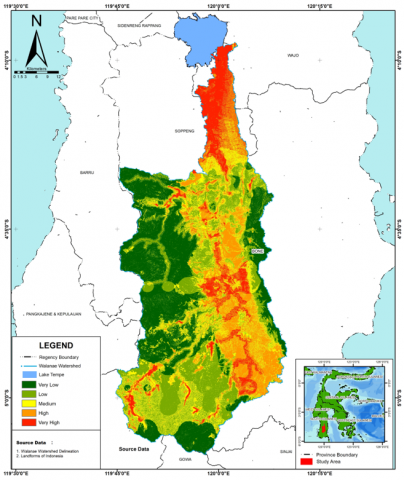
This research was conducted in the Walanae watershed located in four districts in South Sulawesi Province, namely Maros, Bone, Soppeng, and Wajo districts. As presented in Figure 1.
Geographically, the Walanae watershed is located at coordinates 3°59'03"-5°8'45" N and 119°44'08"-120°8'57" East with a watershed area of 293,287.75 ha.
2.2 Inventory of flood events
Frequency Ratio uses historical flood data that has been recorded, which can provide a strong picture of flood patterns and characteristics in an area. This assists in making decisions based on past conditions. The inventory of flood events was obtained from data from the Regional Disaster Management Agency in 2020-2021 in the form of location descriptions in several regencies in the Walanae watershed and flood event data in 2022 obtained from Google Earth Engine (GEE) with cloud computing processing. Flood data was obtained from two sources because data from the Regional Disaster Management Agency was only available until 2021, so reinterpretation was carried out in 2022 using GEE. These two data sources can provide information related to flood events in an area. In this study, two sources are used because the spatial data on flood events in BPBD only reaches 2021, so it is complemented by data on events in 2022 extracted from Sentinel SAR data using the GEE platform as presented in Table 1.
In conducting flood susceptibility analysis, it is essential to have scientifically justifiable data of past flood events to forecast future floods [13]. The integrity and accuracy of future floods depend on the accuracy of previously recorded flood events [14]. Although no specific rule defines how flood points will be allocated into the training and validation datasets [9]. Generally, research uses 70% of flood events as the training dataset to prepare the flood susceptibility model, and the remaining 30% is used to validate the output model [15].
Flood inventory data is then converted into points with the initial stage, the data is converted into a raster where each raster value is categorized into 0 and 1, where 1 is the flood category, and 0 is not flooded. The categorized data is then converted into points, then divided into two groups randomly, where 70% as training data and 30% as validation data. By setting aside some data as validation data, it can be measured to what extent the model trained on the training data can produce accurate predictions.
Figure 1. Research location in Walanae watershed
Table 1. Data sets used for flood susceptibility mapping
|
Data |
Resolution |
Uses of Data |
|
Sentinel-1 imagery recorded in 2022 |
20 m |
Identification of flood events |
|
CHIRPS data for the period 2020-2022 |
5 km |
To create rainfall maps |
|
Digital Elevation Model (DEMNAS) |
8 m |
To create TWI, elevation, slope maps |
|
Landsat 8 imagery recorded in 2022 |
30 m |
To create a land cover map |
|
Map of Indonesian Topographic |
1: 50.000 |
To create a distance from river map |
|
Regional Spatial Plan of South Sulawesi Province |
1: 50.000 |
Analysis of spatial pattern plan conditions and mitigation measures |
2.3 Parameters causing a flood
It is important to select factors that are effective in mapping flood susceptibility based on literature studies, data availability, the condition of the research site, and the scale of the parameters used. Six parameters used in this research are considered to be representative of several other parameters, namely rainfall, Topographic Wetness Index (TWI), elevation, slope, land cover, and distance from the river. Data processing in this study will convert all maps into raster data with pixels of 30mx30m.
2.4 Data analysis
Data analysis uses a quantitative method, namely the Frequency Ratio method. Suppose the ratio value is greater than 1.0. In that case, the relationship between flood occurrence and its causal factors is higher by showing a stronger correlation. If the ratio is less than 1.0, the relationship between flood occurrence and its causal factors is low by showing a weak correlation. The value in each class indicates the level of relationship of the Frequency Ratio value, which can be calculated by the formula [11].
$\mathrm{FR}=\frac{\left(\mathrm{PxcF}(\mathrm{nm}) / \sum \mathrm{PncF}\right)}{\left(\mathrm{Pixel}(\mathrm{nm}) / \sum \mathrm{Pnx}\right)}$ (1)
It is analysed using the formula to create a Flooding Susceptibility Index (FSI) or flood susceptibility index [10].
$\mathrm{FSI}=\mathrm{Fr}_1+\mathrm{Fr}_2+\ldots+\mathrm{Fr}_{\mathrm{n}}$ (2)
FSI value applied for flood susceptibility mapping based on five classes on Natural Break classified into very high, high, medium, low, and very low.
2.5 Data validation
Flood susceptibility analysis is conducted to find areas that may be affected by flooding in the future. So, whatever integration methodology is used, validating the flood susceptibility map that will be produced is very important. The flood event data obtained is then divided into two, namely 70% training data to prepare the flood susceptibility model, while the remaining 30% validation data is for validating the model test results [15].
Assessment of the accuracy and quality of the resulting model with real data using Area Under the Curve (AUC) through ROC (Receiver Operating Characteristic) analysis. AUC is a statistical measure to assess the ability of a classifier model to distinguish between classes and can be applied as a summary of the ROC graph. The area under the curve indicates the accuracy of the test model. AUC can calculate the percentage of success and test rates of each model and is obtained using training data and validation data. It can be calculated by the formula [16].
$\mathrm{AUC}=\frac{\Sigma \mathrm{TP}+\Sigma \mathrm{TN}}{\mathrm{P}+\mathrm{N}}$ (3)
If the resulting AUC value is <0.5, then the model validation has a very low level of accuracy and indicates that the model could be better if used. So the greater the AUC value, the better the predictive ability of the model [17].
3.1 Inventory of flood events
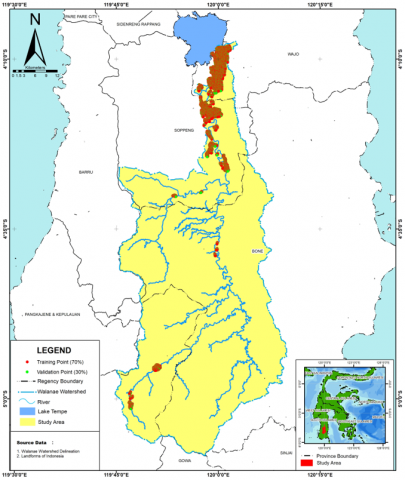
From the results of the interpretation of sentinel 1-GRD imagery and data from the Disaster Management Agency, then obtained 70% traning data of 55,798 pixels and 30% validation data of 23,913 pixels with a total of 79,711 flood points from a total of 3,258,305 pixels of the Walanae watershed. As presented in Figure 2.
Figure 2. Map of distribution of flood events
3.2 Flood susceptibility parameters
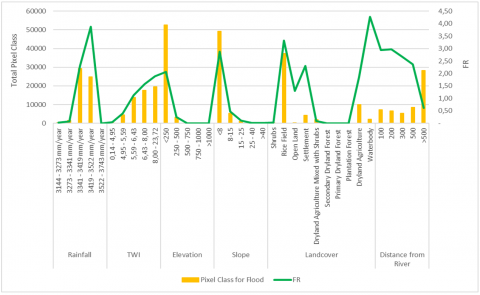
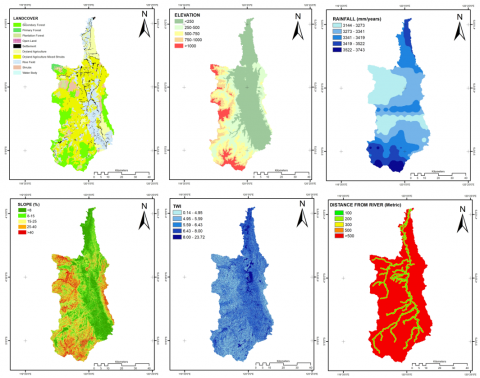
Determining the causal factors of flood events used does not have strict rules. The parameters that become factors causing flooding are based on literature studies/general knowledge, the condition of the research site, and available data sources. The raster analysis conducted during the research used the Frequency Ratio (FR) method from the results obtained maps, values, and Frequency Ratio graphs on the flood susceptibility level parameters can be seen in Table 2, Figure 3, and Figure 4.
Table 2. Parameter calculation results
|
Parameter |
Classification |
Pixel Class for Flood |
% (Pixel Flood) |
Total Pixel Class |
% (Pixel Class) |
FR |
|
Rainfall |
3144-3273mm/year |
312 |
0.56 |
910.521 |
27.94 |
0.02 |
|
3273-3341mm/year |
1.401 |
2.51 |
1.106.668 |
33.96 |
0.07 |
|
|
3341-3419mm/year |
29.345 |
52.59 |
747.656 |
22.95 |
2.29 |
|
|
3419-3522mm/year |
24.740 |
44.34 |
373.480 |
11.46 |
3.87 |
|
|
3522-3743mm/year |
0 |
0 |
119.980 |
3.68 |
0 |
|
|
TWI |
0.14-4.95 |
396 |
0.71 |
602.201 |
18.54 |
0.04 |
|
4.95-5.59 |
4.560 |
8.17 |
674.107 |
20.76 |
0.39 |
|
|
5.59-6.43 |
13.737 |
24.62 |
715.993 |
22.05 |
1.12 |
|
|
6.43-8.00 |
17.591 |
31.53 |
654.830 |
20.17 |
1.56 |
|
|
8.00-23.72 |
19.514 |
34.97 |
600.155 |
18.48 |
1.89 |
|
|
Elevation |
<250 |
52.658 |
94.37 |
1.485.890 |
45.6 |
2.07 |
|
250-500 |
3.140 |
5.63 |
734.033 |
22.53 |
0.25 |
|
|
500-750 |
0 |
0 |
509.703 |
15.64 |
0 |
|
|
750-1000 |
0 |
0 |
315.013 |
9.67 |
0 |
|
|
>1000 |
0 |
0 |
213.877 |
6.56 |
0 |
|
|
Slope |
<8 |
49.190 |
88.16 |
1.002.066 |
30.75 |
2.87 |
|
8-15 |
5.370 |
9.62 |
667.080 |
20.47 |
0.47 |
|
|
15-25 |
1.117 |
2 |
668.072 |
20.5 |
0.1 |
|
|
25-40 |
114 |
0.2 |
662.596 |
20.33 |
0.01 |
|
|
>40 |
7 |
0.01 |
258.702 |
7.94 |
0 |
|
|
Shrubs |
69 |
0.12 |
171.414 |
5.26 |
0.02 |
|
|
Rice field |
37.454 |
67.12 |
659.892 |
20.25 |
3.31 |
|
|
Open land |
23 |
0.04 |
1.029 |
0.03 |
1.31 |
|
|
Settlement |
4.206 |
7.54 |
106.562 |
3.27 |
2.31 |
|
|
Landcover |
Dryland Agriculture mixed with shrubs |
1.833 |
3.29 |
1.284.300 |
39.41 |
0.08 |
|
Secondary Dryland Forest |
0 |
0 |
602.699 |
18.49 |
0 |
|
|
Primary Dryland Forest |
0 |
0 |
21.195 |
0.65 |
0 |
|
|
Plantation Forest |
0 |
0 |
66.774 |
2.05 |
0 |
|
|
Dryland Agriculture |
10.066 |
18.04 |
315.547 |
9.68 |
1.86 |
|
|
Waterbody |
2.147 |
3.85 |
29.352 |
0.9 |
4.27 |
|
|
Distance from river |
100 |
7.174 |
12.86 |
142.323 |
4.37 |
2.94 |
|
200 |
6.533 |
11.71 |
128.400 |
3.94 |
2.97 |
|
|
300 |
5.340 |
9.57 |
117.295 |
3.6 |
2.66 |
|
|
500 |
8.505 |
15.24 |
209.864 |
6.44 |
2.37 |
|
|
>500 |
28.246 |
50.62 |
2.660.882 |
81.65 |
0.62 |
The factor that causes flooding that needs to be considered is rainfall. High rainfall in an area has a direct influence on flood events. Rainfall that occurs in upstream areas can cause flooding in downstream areas. The results showed that the highest FR value in the rainfall class occurred in the 3419-3522mm/year class with a flood pixel value of 24,740 or 44.33% of the total flood pixels with an FR value of 3.86, the 3341-3419mm/year class with a flood pixel value of 29,345 or 52.59% of the total flood class pixels with an FR value of 2.29, the 3144-3341 mm/year class had an FR value of only 0.02, while the 3522-3743 mm/year FR value was zero or no flooding occurred. Rainfall above 3000mm/year is already categorized as very high [18]. This shows that the higher the rainfall, the greater the potential for flooding, and vice versa [19].
The FR value in TWI shows similar results to rainfall. Based on the research results, the highest FR value was obtained in the 8.00-23.72 class with a flood pixel value of 19,514 or 34.97% of the total flood pixels and an FR value of 1.89. The next highest FR value is in the 6.43-8.00 class with a flood pixel value of 17,591 or 31.52% of the total flood pixels and an FR value of 1.56. Class 5.59-6.43, with a flood pixel value of 13,737 or 24.61% of the total flood pixels and a FR value of 1.11. While the class 4.95-5.59 FR value is 0.39, and for the class 0.14-4.95 the FR value is only 0.03. Consistently, TWI is relatively correlated with soil moisture. TWI values also indicate the accumulation and velocity of surface water flow [20]. The higher the TWI value, the higher the flood and inundation susceptibility [21]. Places with high TWI values are near rivers or irrigation channels [22]. Places with high TWI values are assumed to have a high level of flood susceptibility. High TWI values are associated with flat topography and high flow density. Flat topography tends to be concave, making it a water accumulation area [23].
Elevation shows a different value from the TWI value. The highest FR value occurs in the elevation class <250 meters above sea level with a flood pixel value of 52,658 or 94.37% of the total flood pixels and an FR value of 2.06. While the elevation of 250-500 meters above sea level with a total of 3140 pixels with an FR value of 0.24. Elevation always has an important role in flood susceptibility mapping [24]. These results show that flooding occurs in places with low elevation, where the elevation class ratio relationship affects the occurrence of flooding. Generally, the FR value will decrease as the elevation of a place increases. Places with low FR values have a smaller chance of flooding [25]. Water flow will follow the shape of the earth's surface, where water will flow from higher to lower locations [20]. The occurrence of flooding cannot be separated from other causal factors such as slope and land use as well as the population that is growing every year putting pressure on land resources in flat areas [26].
The FR value on slope has similarities with the elevation value, where the highest FR value occurs in the slope class <8 with a flood pixel value of 49,190 or 88.15% of the total flood pixels and an FR value of 2.86. This result shows that the slope in the <8 class is the highest factor in the slope class with an FR value greater than 1 indicating a higher proportion of flood events and correlations. The condition of a very steep slope will affect the flow rate of flowing water, so a very steep slope will have a higher flow velocity than a flat slope [27].
Figure 3. Frequency Ratio value for each parameter
Figure 4. Map of parameters causing flood events
The land cover classification results obtained the highest FR value in the land cover class, namely water bodies compared to other classes with a flood pixel value of 2,147 or 3.84% of the total flood pixels and an FR value of 4.27. The next highest FR value is in the rice field land cover with a flood pixel value of 37,454 or 67.12% of the total flood pixels and an FR value of 3.31. The next highest FR value, more than 1, occurs in the settlement land cover class with a flood pixel value of 4,206 or 7.53% of the total flood pixels and an FR value of 2.30. For the dryland agricultural land cover class, the FR value is 1.86, and the open land class has an FR value of 1.30, while for the rest of the classes, the FR value is below zero to zero or categorized as no flooding. Flooding occurs in water bodies due to flood water runoff from rivers or flood discharge greater than the existing river drainage capacity. Flooding can occur due to inundation due to water runoff out of the river channel because the enlarged river discharge suddenly exceeds its capacity which occurs quickly [28]. According to residents, the condition of paddy fields in the research location is often affected by flooding when rainfall is very high. This shows that the rice field area provides a relatively slow level of soil permeability where the soil in rice fields has a low organic matter content, the soil in rice fields usually produces soil that has a low permeability value when inundation occurs it will be very slow to flow, causing flooding [29].
Distance from the river has the highest FR value at a distance of 200m with a flood pixel value of 6,533 or 11.70% of the total flood pixels and an FR value of 2.97. For the next highest FR value of 2.94 at a distance of 100 m with a flood pixel value of 7,147 or 102.85% of the total flood pixels, then the 300 m distance class with a flood pixel value of 5,340 or 9.57% of the total flood pixels and an FR value of 2.65. For the 500 m distance class with a pixel value of 8,505 or 15.24% of the total flood pixels and an FR value of only 2.39, and the >500m distance class the FR value is only 0.64. These results show that the closer the distance of the river or water body, the greater the possibility of inundation or flooding from river overflows [24]. Distance from the river is one of the main causative factors due to its significant impact on the spread and magnitude of flooding that will occur [30]. Areas close to rivers are more prone to flooding within the watershed due to water flowing from higher elevations and accumulating at lower elevations, where mostly when it rains, areas close to terrestrial water bodies become flooded, such as rivers, swamps, ponds, and lakes [31].
3.3 Flood susceptibility level
Analysis of the level of flood susceptibility is generated after preparing 6 (six) factors that cause flood events, all factors are combined to build a flood susceptibility map in the Walanae watershed using ArcGIS software with the extract multi values tool. In Table 3, the value of the Flood Susceptibility Index (FSI) analysis results is represented in 5 (five) classes, namely very low, low, medium, high, and very high. Flood susceptibility can be seen in Table 3.
The administrative area with the widest flood susceptibility level is in Bone Regency with a high susceptibility class area of 39,318.25 ha and a very high class of 11,399.05 ha. Soppeng Regency has a high susceptibility area of 10,243.05 ha and a very high class of 8,294.23 ha. Wajo Regency has a high susceptibility category of 1,541.38 ha and a very high class of 7,618.18 ha, and Maros Regency with a high category area of 3,4,73.69 ha and a very high of 1,918.95 ha. This condition shows a need for appropriate mitigation measures in several areas that fall into the high and very high susceptibility categories. The distribution of flood susceptibility can be seen in Figure 5.
Figure 5. Map of flood susceptibility in walanae watershed
Table 3. Level of flood susceptibility based on administrative area
|
Regency |
Susceptibility (Ha) |
|||||
|
Very Low |
Low |
Medium |
High |
Very High |
Total |
|
|
Bone |
51,038.25 |
49,550.36 |
34,046.50 |
39,318.25 |
11,399.05 |
185,352.39 |
|
Maros |
21,729.63 |
14,936.34 |
8,874.35 |
3,473.69 |
1,918.95 |
50,932.97 |
|
Soppeng |
9,161.44 |
9,503.38 |
10,441.07 |
10,243.05 |
8,294.23 |
47,643.17 |
|
Wajo |
0.09 |
199.04 |
1,541.38 |
7,618.18 |
9,358.69 |
|
|
Total |
81,929.32 |
73,990.16 |
53,560.96 |
54,576.37 |
29,230.40 |
293,287.22 |
The high and very high susceptibility classes mostly belong to the downstream part of the Walanae watershed, an area with a dangerous risk and high potential for flooding. The results of this study are quite in line with the results of the flood disaster risk assessment produced by the National Disaster Management Agency, where the area around Tempe Lake has a high level of vulnerability. However, by using the FR method, the factors that influence flood events can be identified, which is different from previous flood studies. The high susceptibility of flooding in this area is influenced by factors that have a relationship or correlation to flooding events, namely at elevations <250 meters above sea level (lowland areas), slopes <8 (flat-very flat), rainfall <3,000 mm/year, TWI class >5.59, in land cover settlements, rice fields, and water bodies have a high relationship in influencing flooding, and distance from the river <500m.
3.4 Validation tests
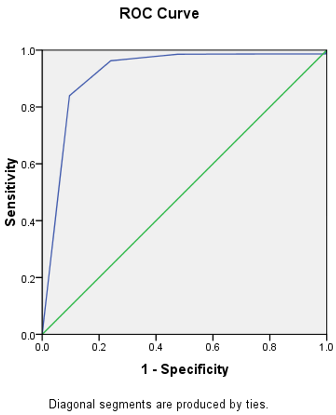
In this study, validation was carried out using Receiver Operating Characteristic (ROC) curve analysis to support the model prediction, which is described by the Area Under Curve (AUC) value. AUC value of 0.5 or less, the model is said to be not good or not suitable for flood vulnerability and if the value is perfect 1 then this model is most suitable for estimating flood trends and if the AUC value is >0.8 then flood predictability is also well accepted [32].
From the validation results, the AUC value of the model success rate of 92.5% and the AUC value of the model testing rate of 91.7% have high values. The ROC curve validation results can be seen more clearly in Table 4 and Figure 6.
The classification can be categorized as successful because the value is 0.8-0.9 or very good [11]. Based on the above results, the Frequency Ratio model is useful for determining flood susceptibility mapping in the Walanae watershed.
Table 4. AUC value of ROC analysis results on success rate and prediction Frequency Ratio
|
Susceptibility (Ha) |
|
|
AUC |
Value |
|
AUC Model Success |
0.925 |
|
AUC Model Testing Rate |
0.917 |
(a)
(b)
Figure 6. AUC curve of ROC validation results of flood susceptibility modeling; (a) Model success results curve; (b) Model test rate curve
3.5 Flood mitigation strategy
The Walanae watershed area is an area that is prone to flooding and to overcome routine flood disasters it is necessary to take mitigation actions. What can be done in mitigation is by making action plans and land use patterns in areas that are considered prone to flooding. The analysis conducted between spatial pattern data and flood susceptibility shows that flood susceptibility data is dominant in agricultural land and settlements in each regency, so it is necessary to take mitigation actions in locations that have high and very high susceptibility classes, this can be seen in Table 5 and Table 6.
The Law No. 23 of 2021 on Forestry Implementation in Article 41 related to Forest Area Adequacy directs maintaining forest areas and forest cover based on physical conditions and land cover with a proportional distribution based on watershed characteristics [33]. The main indicator of the cause of flooding is land infiltration capacity, due to lack of vegetation and mismatch of land cover/use as a determinant of good watershed characteristics determined by the condition of vegetation or land cover [34]. Data on spatial pattern plans and land cover in the Walanae watershed show a mismatch, such as in the spatial pattern designation of production forest areas and conservation areas where most of the land cover is agricultural land and settlements. Irregular building patterns will also affect infiltration and the rate of water runoff into the ground and trigger flooding [35]. The designation of the spatial pattern plan that has been established should be maintained and preserved, as well as taking action to prevent continuous land conversion because it will trigger greater flooding in the Walanae watershed area.
Table 5. Linkages between spatial planning and flood susceptibility levels
|
Susceptibility (Ha) |
Total |
||||||
|
Very Low |
Low |
Medium |
High |
Very High |
|||
|
Spatial Plan |
Water Body |
2.71 |
0.24 |
93.28 |
96.22 |
||
|
Production Forest Area |
31,252.35 |
26,438.09 |
7,345.00 |
997.56 |
206.43 |
66,239.43 |
|
|
Production Forest Area/Mining and Energy Area |
75.06 |
123.93 |
27.53 |
3.11 |
229.63 |
||
|
Conservation Area |
13,046.98 |
2,678.48 |
761.36 |
96.51 |
2.94 |
16,586.27 |
|
|
Geological Protected Areas |
336.32 |
501.41 |
69.36 |
907.09 |
|||
|
Community Forest Area |
3,832.87 |
3,185.00 |
1,644.60 |
230.78 |
15.07 |
8,908.32 |
|
|
Local Protection Area |
0.53 |
0.88 |
45.87 |
47.28 |
|||
|
Settlement Area |
3.32 |
34.22 |
405.47 |
776.57 |
564.65 |
1,784.23 |
|
|
Mining and Energy Area |
483.39 |
2,056.28 |
1,426.69 |
583.92 |
105.26 |
4,655.54 |
|
|
Agriculture Area |
17,667.21 |
33,748.45 |
40,272.04 |
51,169.55 |
28,099.65 |
170,956.89 |
|
|
Protected Forest Area |
15,568.14 |
5,725.73 |
1,338.71 |
215.84 |
27.89 |
22,876.31 |
|
|
Total |
81,929.32 |
73,990.16 |
53,560.96 |
54,576.37 |
29,230.40 |
293,287.22 |
|
Table 6. Linkages between spatial plan and land cover types
|
Land Cover |
||||||||||||
|
Secondary Dryland Forest |
Primary Dryland Forest |
Plantation Forest |
Open land |
Settlement |
Dryland Agriculture |
Dryland Agriculture Mixed with shrubs |
Rice field |
Shrubs |
Waterbody |
Total |
||
|
Spatial Plan |
Water Body |
96.22 |
96.22 |
|||||||||
|
Production Forest Area |
29,260.19 |
7.32 |
4900.78 |
108.36 |
184.13 |
26455.2 |
1139.03 |
4019.4 |
165.01 |
66239.43 |
||
|
Production Forest Area/Mining and Energy Area |
214.08 |
5.56 |
9.99 |
229.63 |
||||||||
|
Conservation Area |
9,854.71 |
960.81 |
252.8 |
6.27 |
3,477.12 |
549.63 |
1,473.82 |
11.11 |
16,586.27 |
|||
|
Geological Protected Areas |
28.2 |
878.89 |
907.09 |
|||||||||
|
Community Forest Area |
2,022.54 |
277.03 |
61.49 |
68.57 |
5280.9 |
528.81 |
668.95 |
0.03 |
8,908.32 |
|||
|
Local Protection Area |
0.37 |
3.13 |
43.78 |
47.28 |
||||||||
|
Settlement Area |
13.89 |
1,353.09 |
152.87 |
60.05 |
157.94 |
46.02 |
0.37 |
1,784.23 |
||||
|
Mining and Energy Area |
1,432.4 |
61.83 |
88.75 |
1,020.94 |
1,116.84 |
781.24 |
141.63 |
11.92 |
4,655.54 |
|||
|
Agriculture Area |
2,827.63 |
499.13 |
93.06 |
7,924.25 |
25,768.84 |
7,2252.8 |
55,903.09 |
3,466.62 |
2221.48 |
170,956.89 |
||
|
Total |
54,247.26 |
1,907.84 |
6,007.30 |
93.06 |
9,586.47 |
2,8406.78 |
115,575.61 |
59,395.44 |
15,426.52 |
2,640.96 |
293,287.22 |
|
Such conditions indicate the need for supervision, control and utilization of space by the rules of the Law No. 21 of 2021. Based on the rules of spatial planning implementation article 195 paragraph 1, control of spatial utilization is the duty and authority of the provincial and regency / city governments [36]. Planning directions in several areas in the Walanae watershed based on the results of field observations and data analysis of land cover and spatial patterns that can be actualized include, in the settlement area, directions should be carried out by making two-story houses, normalizing drainage around the Walanae watershed, especially cleaning water hyacinth, counseling related to flood mitigation, increasing the scale of cooperation and communication between the government and the community, and establishing and improving the Flood Early Warning System (FEWS) [37, 38]. In agricultural areas, the direction is to limit agricultural activities within a minimum radius of 100 meters from the river border, clean drainage, build embankments, implement the concept of Soil and Water Conservation, apply agroforestry patterns, and build retention ponds or infiltration wells [39]. In forested areas that are considered as catchment areas, there needs to be appropriate actions or directions such as guarding and limiting the area to prevent land conversion in forest areas to increase water absorption [40], as well as carrying out land rehabilitation activities that are considered critical in the Walanae watershed.
Based on the FR method, it can be seen that the flood vulnerability of high and very high-class categories in the Walanae watershed based on administrative data is largest in Bone Regency covering 50,717.29 ha or 17.29% of the watershed area, Soppeng Regency covering 18,537.28 ha or 6.32%, Wajo Regency covering 9,159.56 ha or 3.12% and Maros Regency covering 5,392.64 ha or 1.84%. The results showed that factors that have a relationship to flooding events with high FR values are located at elevations <250 meters above sea level (lowland areas), slopes <8 (flat-very flat), rainfall <3,000mm/year, TWI class >5.59 and in land cover of settlements, rice fields, and water bodies. This flood vulnerability information can be used to make action plans and land use patterns in areas considered prone to flooding, such as in agricultural areas, the direction of limiting agricultural activities within a minimum radius of 100 meters from the river border, cleaning drainage, building embankments, implementing the concept of Soil and Water Conservation, implementing agroforestry patterns, and making retention ponds or infiltration wells. The use of the FR method can be improved in the future by projecting future flood vulnerability by projecting dynamic parameters such as land cover and climate.
The author wishes to convey appreciation for the facility support provided by Universitas Hasanuddin to complete this research. Additionally, the author wishes to convey thankfulness to those who assisted in the completion of this research and anonymous reviewers who provided suggestions for this research.
[1] Kuswardhana, A.T., Wahyono, R.U.A. (2023). Pemetaan geospasial risiko banjir di sub-das gunting, jombang jawa timur. Rekayasa Sipil, 17(1): 54-65. https://doi.org/10.21776/ub.rekayasasipil.2023.017.01.8
[2] Hapsari, R.I., Zenurianto, M. (2016). View of flood disaster management in Indonesia and the key solutions. American Journal of Engineering Research, 5(3): 140-151.
[3] Badan Nasional Penanggulangan Bencana (BNPB). "Geoportal Kebencanaan Indonesia." Website: gis.bnpb.go.id. Diakses pada 22 Agustus 2023.
[4] Suprapto. (2011). Statistik pemodelan bencana banjir Indonesia (Kejadian 2002-2010). Jurnal Dialog Penanggulangan Bencana, 2: 84-97.
[5] Hamdani, H., Permana, S., Susetyaningsih, A. (2014). Analisa daerah rawan banjir menggunakan aplikasi sistem informasi geografis (Studi kasus Pulau Bangka). Jurnal Konstruksi, 12(1).
[6] Zamzani, R., Mujiburohman, D.A., Salim, M.N., Dewi, A.R. (2022). Kebijakan penataan ruang dan pemanfaatan danau tempe. Publik: Jurnal Manajemen Sumber Daya Manusia, Administrasi dan Pelayanan Publik, 9(2): 178-191. https://doi.org/10.37606/publik.v9i2.294
[7] BMKG. (2020). KLIMA la nina si gadis yang menyertai musim hujan ditengah pandemi dan perubahan iklim. Kedeputian Bidang Klimatologi, Jakarta Pusat.
[8] Addis, A. (2023). GIS based flood susceptibility mapping using Frequency Ratio and information value models in upper Abay river basin, Ethiopia. Natural Hazards Research, 3(2): 247-256. https://doi.org/10.1016/j.nhres.2023.02.003
[9] Pradhan, B., Oh, H.J., Buchroithner, M. (2010). Weights-of-evidence model applied to landslide susceptibility mapping in a tropical hilly area. Geomatics, Natural Hazards and Risk, 1(3): 199-223. https://doi.org/10.1080/19475705.2010.498151
[10] Munir, A., Ghufran, M.A., Ali, S.M., Majeed, A., Batool, A., Alias Sahib Khan, M.B., Abbasi, G.H. (2022). Flood susceptibility assessment using Frequency Ratio modelling approach in northern sindh and southern punjab, Pakistan. Polish Journal of Environmental Studies, 31(4): 3250-3251. https://doi.org/10.15244/pjoes/145607
[11] Shafapour Tehrany, M., Shabani, F., Neamah Jebur, M., Hong, H., Chen, W., Xie, X. (2017). GIS-based spatial prediction of flood prone areas using standalone Frequency Ratio, logistic regression, weight of evidence and their ensemble techniques. Geomatics, Natural Hazards and Risk, 8(2): 1538-1561. https://doi.org/10.1080/19475705.2017.1362038
[12] Sarkar, D., Mondal, P. (2020). Flood vulnerability mapping using Frequency Ratio (FR) model: A case study on Kulik river basin, Indo-Bangladesh Barind region. Applied Water Science, 10(1): 1-13. https://doi.org/10.1007/s13201-019-1102-x
[13] Lee, M.J., Kang, J.E., Jeon, S. (2012). Application of Frequency Ratio model and validation for predictive flooded area susceptibility mapping using GIS. In 2012 IEEE International Geoscience and Remote Sensing Symposium, Munich, Germany, pp. 895-898. https://doi.org/10.1109/IGARSS.2012.6351414
[14] Merz, B., Thieken, A.H., Gocht, M. (2007). Flood risk mapping at the local scale: Concepts and challenges. Flood Risk Management in Europe: Innovation in Policy and Practice, 231-251. https://doi.org/10.1007/978-1-4020-4200-3_13
[15] Pourghasemi, H.R., Moradi, H.R., Fatemi Aghda, S.M., Gokceoglu, C., Pradhan, B. (2014). GIS-based landslide susceptibility mapping with probabilistic likelihood ratio and spatial multi-criteria evaluation models (North of Tehran, Iran). Arabian Journal of Geosciences, 7: 1857-1878. https://doi.org/10.1007/s12517-012-0825-x
[16] Gorunescu, F. (2011). Data mining: Concepts, models and techniques. Springer Science & Business Media. Springer, South Australia, Vol. 12. https://doi.org/10.1007/978-3-642-19721-5
[17] Yesilnacar, E.K. (2005). The application of computational intelligence to landslide susceptibility mapping in Turkey. University of Melbourne, Department, 200.
[18] Pusat Penelitian Tanah Dan Agroklimat, (2004). Klasifikasi intensitas curah hujan. Bogor: Puslit Tanah.
[19] Darmawan, K., Suprayogi, A. (2017). Analisis tingkat kerawanan banjir di kabupaten sampang menggunakan metode overlay dengan scoring berbasis sistem informasi geografis. Jurnal Geodesi Undip, 6(1): 31-40. https://doi.org/10.14710/jgundip.2017.15024
[20] Sharir, K., Roslee, R. (2022). Flood susceptibility assessment (FSA) using GIS-based Frequency Ratio (FR) model in Kota Belud, Sabah, Malaysia. International Journal of Design & Nature and Ecodynamics, 17(2): 203-208. https://doi.org/10.18280/ijdne.170206
[21] Buchanan, B.P., Fleming, M., Schneider, R.L., Richards, B.K., Archibald, J., Qiu, Z., Walter, M.T. (2014). Evaluating topographic wetness indices across central New York agricultural landscapes. Hydrology and Earth System Sciences, 18(8): 3279-3299. https://doi.org/10.5194/hess-18-3279-2014
[22] Pourali, S.H., Arrowsmith, C., Chrisman, N., Matkan, A.A., Mitchell, D. (2016). Topography wetness index application in flood-risk-based land use planning. Applied Spatial Analysis and Policy, 9: 39-54. https://doi.org/10.1007/s12061-014-9130-2
[23] Nucifera, F., Putro, S.T. (2017). Deteksi kerawanan banjir genangan menggunakan topographic wetness index (TWI). Media Komunikasi Geografi, 18(2): 107-116. https://doi.org/10.23887/mkg.v18i2.12088
[24] Fernández, D.S., Lutz, M.A. (2010). Urban flood hazard zoning in Tucumán Province, Argentina, using GIS and multicriteria decision analysis. Engineering Geology, 111(1-4): 90-98. https://doi.org/10.1016/j.enggeo.2009.12.006
[25] Khosravi, K., Nohani, E., Maroufinia, E., Pourghasemi, H.R. (2016). A GIS-based flood susceptibility assessment and its mapping in Iran: A comparison between Frequency Ratio and weights-of-evidence bivariate statistical models with multi-criteria decision-making technique. Natural Hazards, 83: 947-987. https://doi.org/10.1007/s11069-016-2357-2
[26] Utama, L., Naumar, A. (2015). Kajian kerentanan kawasan berpotensi banjir bandang dan mitigasi bencana pada daerah aliran sungai (DAS) Batang Kuranji Kota Padang. Jurnal Rekayasa Sipil, 9(1): 21-28.
[27] Pratomo, A.J. (2008). Analisis kerentanan banjir di daerah aliran sungai sengkarang kabupaten pekalongan provinsi jawa tengah dengan bantuan sistem informasi geografis. Doctoral Dissertation, Universitas Muhammadiyah Surakarta.
[28] Utama, L., Saidi, A., Berd, I., Mizwar, Z. (2018). Kajian morphometri pada daerah aliran sungai (das) batang kuranji terhadap debit banjir. Frontiers: Jurnal Sains Dan Teknologi, 1(1). https://doi.org/10.36412/frontiers/001035e1/april201801.07
[29] Mulyono, A., Lestiana, H., Fadilah, A. (2019). Permeabilitas tanah berbagai tipe penggunaan lahan di tanah aluvial pesisir DAS Cimanuk, Indramayu. Jurnal Ilmu Lingkungan, 17(1): 1-6. https://doi.org/10.14710/jil.17.1.1-6
[30] Glenn, E.P., Morino, K., Nagler, P.L., Murray, R.S., Pearlstein, S., Hultine, K.R. (2012). Roles of saltcedar (Tamarix spp.) and capillary rise in salinizing a non-flooding terrace on a flow-regulated desert river. Journal of Arid Environments, 79: 56-65. https://doi.org/10.1016/j.jaridenv.2011.11.025
[31] Hartini, S., Hadi, M.P., Sudibyakto, S., Poniman, A. (2015). Application of vector auto regression model for rainfall-river discharge analysis. In Forum Geografi, 29(1). https://doi.org/10.23917/forgeo.v29i1.786
[32] Samanta, S., Pal, D.K., Palsamanta, B. (2018). Flood susceptibility analysis through remote sensing, GIS and Frequency Ratio model. Applied Water Science, 8(2): 66. https://doi.org/10.1007/s13201-018-0710-1
[33] Indonesia. (2021). Peraturan pemerintah republik Indonesia nomor 23 tahun 2021 tentang penyelenggaraan kehutanan. Jakarta
[34] Nurfaika. (2015). Analisis karakteristik morfometri daerah aliran sungai melalui pemanfaatan penginderaan jauh dan sistem informasi geografi (Studi Kasus di DAS Limboto Provinsi Gorontalo). Universitas Negeri Gorontalo, Gorontalo.
[35] Oladokun, V., Proverbs, D. (2016). Flood risk management in Nigeria: A review of the challenges and opportunities. Flood Risk Management and Response, 6(3): 485-497. https://doi.org/10.2495/SAFE-V6-N3-485-497
[36] Indonesia. (2021). Peraturan pemerintah republik indonesia nomor 21 tahun 2021 tentang penyelenggaraan penataan ruang. Jakarta.
[37] Prathaithep, W.B., Nitivattanannon, V., Kim, S.M., Shrestha, S. (2022). Enhancing flood management plan (FMP) through integration strategic environmental assessment (SEA) in Thailand: The case of Ayutthaya. International Journal of Sustainable Development & Planning, 17(4): 1101-1115. https://doi.org/10.18280/ijsdp.170407
[38] Kurniawan, E., Suharini, E., Dafip, M. (2021). How far disaster management implemented toward flood preparedness: A lesson learn from youth participation assessment in Indonesia. International Journal of Safety and Security Engineering, 11(2): 175-183. https://doi.org/10.18280/ijsse.110206
[39] Ishikawa, T., Akoh, R., Senoo, H. (2023). Flood disaster mitigation strategy in the early modern age in Japan (the beginning of 17th to the mid-19th century). International Journal of Environmental Impacts, 6(1): 1-6. https://doi.org/10.18280/ijei.060101
[40] Pirah, J.A., Roslee, R. (2021). Positive changes in flood mitigation through sand dredging works at Padas River and tributary based on HEC-RAS hydrological modelling. Journal of Design & Nature and Ecodynamics, 16(4): 451-458. https://doi.org/10.18280/ijdne.160412