Erna Handayani*![]() | Ali Akbar Anggara
| Ali Akbar Anggara![]() | Ira Hapsari
| Ira Hapsari![]() | Ching-Te Lin
| Ching-Te Lin![]()
© 2024 The authors. This article is published by IIETA and is licensed under the CC BY 4.0 license (http://creativecommons.org/licenses/by/4.0/).
OPEN ACCESS
This study aims to develop instruments to measure the implementation of the Sustainability Development Goals (SDGs) in higher education institutions in Indonesia, focusing on the 17 United Nation’s SDGs agendas. Further, the developed instrument was used to evaluate the implementation of SDGs in higher education institutions. Considering the resource limitations in Indonesian higher education institutions, the study aims to identify and prioritize SDGs agendas that are effective and suitable for implementation. Hence, higher education institutions in Indonesia can gradually enhance the implementation of SDGs agendas by prioritizing the most efficient and suitable ones. This study used a quantitative research approach. The sample included 118 private higher education institutions in Indonesia. This study utilized various analysis techniques including exploratory factor analysis (EFA) and confirmatory factor analysis (CFA) to assess the validity of the measurement items. The SDGs implementation was evaluated by statistical process control (SPC) analysis and illustrated with Pareto diagrams. The effectiveness of SDGs agendas was examined using an Importance-Performance Map Analysis matrix. The findings demonstrated that the SDGs measurement item accurately evaluated the implementation of SDGs. The overall level of SDGs implementation was determined to be moderate, indicating potential areas for improvement in higher education settings. The study identified 2 the high priority agendas, 13 medium priority agendas and 2 low priority agendas that require immediate attention and improvement. These findings contribute to the existing knowledge on sustainable development and offer valuable insights for policymakers and higher education institutions in Indonesia. The study also emphasizes the importance of standardized sustainability reports to enhance transparency and accountability in the higher education sector.
sustainability development goals, SDGs agenda, sustainability reports, higher education
The Education Sustainability Development Agenda 2030 [1] was established with the aim of ensuring sustainable education development by setting targets for quality education, inclusivity, and equal opportunities for lifelong learning. This agenda, signed in 2015, emphasizes the vital role of higher education institutions as providers of education in supporting and promoting policies that enable quality education and equitable opportunities for individuals throughout their lives.
The implementation of Sustainability Development Goals (SDGs) is continuously improving, including in higher education. In December 2002, the United Nations resolution emphasized the significance of educational institutions in achieving sustainable development during the United Nations Decade of Education for Sustainable Development (UNDESD) program, which spanned from 2014 to 2023. This program is crucial for monitoring and assessing the extent to which higher education institutions embrace fundamental sustainable development concepts and activities [2]. In 2013, the Government of Indonesia appointed five universities in Indonesia (Patimura University, Sebelas Maret University, Hassanuddin University, Cendrawasih University and Diponegoro University) as a pilot of green campuses. Since then, universities in Indonesia have started to implement the concept of a green campus and the SDGs.
The implementation green campus consists of the:
(1) evaluation and revitalization of the campus master plan based on green campus,
(2) socio engineering,
(3) safe circulation safe, comfortable, and healthy,
(4) efficiency usage of energy and water,
(5) integrated waste management,
(6) development of environmentally friendly campus vehicles. The implementation of sustainable development in higher education has been reported through published sustainability reports. However, these reports are still limited in some universities, such as Diponegoro University (since 2016), University of Indonesia (since 2018) and Institute Surabaya Technology (since 2018).
Several private higher education institutions have applied and implemented green campus initiatives and Sustainable Development Goals (SDGs). However, there is currently no evaluation and monitoring of the implementation of SDGs in higher education in Indonesia. This situation arises due to the absence of regulations that mandate the delivery of sustainability reports by higher education institutions in the country. The performance measurement of higher education institutions in Indonesia, as represented by the Accreditation Board for Higher Education, is primarily focused on academic and governance performance, with limited consideration given to elements of sustainable development. Examples of such limited elements include the unoptimal provision of facilities for disability and inclusion programs, as well as the establishment of green campuses. Comprehensive measurement and indexing of SDGs implementation have not yet been conducted, and the findings have not been made available to the public.
Returning to the importance of the role of higher education in achieving the SDGs [1, 3], this study analyzes empirical facts about the level of implementation of SDGs 17 in tertiary institutions in Indonesia using indicators that are adjusted to the space and complexity of managing tertiary institutions in Indonesia [4]. The study evaluates the social, economic and environmental aspects [2, 5]. Farinha et al. [6] used SDGs indicators to measure their research about the implementation SDGs in higher education in Portugal. However, the study discusses the implementation of the SDGs in a comprehensive and systematic manner.
Abad-Segura and González-Zamar [7] highlight that most discussions on the implementation of SDGs in higher education are centered around developed countries such as the US, China and the United Kingdom. However, there is a need for more attention and research on the implementation of SDGs in higher education institutions in developing countries, particularly in smaller universities [8]. Nonetheless, several large universities in developing countries have committed to the SDGs as described Budihardjo et al. [9] and Tabucanon et al. [8]. To increase the role and implementation of SDGs in higher education, researchers have agreed that the introduction of mandatory sustainability reporting is essential. This requirement would entail higher education institutions to produce regular sustainability reports as part of their measurement process [6, 8].
The measurement and assessment of SDGs implementation should be conducted regularly to monitor the progress towards achieving the 17 SDGs agendas. However, it is essential to focus on the most relevant agenda items that are applicable and can be effectively developed within the higher education context. Based on Resource Based Theory [10], due to the limitations in higher education resources, effective management is essential to achieve specific objectives, particularly in the context of implementing the SDGs. Proper management can play a significant role in ensuring that the resources available are utilized efficiently and effectively to work towards achieving the SDGs. The objectives of this study are as follows:
(1) To develop a comprehensive measurement instrument for evaluating the implementation of the 17 Sustainable Development Goals (SDGs) in higher education institutions.
(2) To assess the level of implementation of the SDGs agendas in higher education institutions by developed measurement instrument.
(3) Optimizing the implementation of the 17 Sustainable Development Goals (SDGs) agenda by assessing their essence and effectiveness for implementation in tertiary institutions. Given the limited resources, universities can gradually implement the SDGs agenda based on their importance and effectiveness.
2.1 Sustainability development goals at higher education
Research exploring the implementation and role of universities in the sustainability agenda is still limited, especially in Indonesia. Measuring and implementing the Sustainable Development Goals (SDGs), especially in the context of sustainable development in education, is an interesting and important topic in line with the 2030 Education Sustainable Development (SD) Agenda [1]. This study explores the extent of implementation and the role of higher education in promoting the sustainability agenda. Aleixo et al. [2, 5] examined the implementation of SDGs in Portugal using content analysis of SDGs-oriented curricula and courses. The results found that most universities in Portugal had implemented an SDGs-oriented curriculum with an average of 6 courses.
Farinha et al. [6] highlighted the implementation of SDGs in Portugal from a different perspective, namely from higher education policies and strategies which are reflected in their performance reports. Farinha et al. [6] used a qualitative approach and content analysis by examining university strategic plans and published reports on the website to see commitments and best practices for implementing the SDGs. From this study, it shows the development of the implementation of the SDGs of higher education in Portugal.
An evaluation of the implementation of combining all SDGs indicators was carried out by Tabucanon et al. [8] for large universities in Thailand by grouping indicators into 5 dimensions, namely economic, social, environmental, administrative, and educational/research aspects related to SDGs. They conclude the important implementation of SDGs in the vision and strategy, safety and welfare, waste, and the higher education system in Thailand. Further, they concluded the need for a sustainability assessment tool for higher education, especially in Thailand.
At the global level, ranking the implementation of SDGs in higher education has been done globally for a long time. The Times Higher Education is a university rating agency that measures the contribution of universities in the world based on 17 agendas determined by the United Nations SDGs. In Indonesia, there are still a few tertiary institutions that are included in the ranking list [11]. In 2023, major Indonesian universities, one of which is Gajah Mada University, will be included in the Times Higher Education ranking list for aspects of No Poverty (23), Affordable and Clean Energy (33), and Decent Work and Economic Growth (46) [11].
The achievement becomes motivation [12, 13] for other higher education institutions in Indonesia to judge how far higher education implements this role, including government or holder policy related. This research is very relevant regarding the conditions and challenges of achieving SDGs implementation in Indonesian higher education because there are no specific measurements yet.
2.2 Indicators of sustainability education development goals
The main dimensions of the sustainability of the unity of nations consist of social, economic and environmental aspects [2, 5, 6, 14-17]. This dimension is reflected in the 17 indicators reviewed in the implementation of research by experts and the basis for preparing a sustainability report using the SDGs indicators as has been done in private companies in Indonesia [18]. Combining Aleixo et al. [2, 5] and Tabucanon et al. [8], the evaluation of indicators for the implementation of the sustainability education development goals of higher education institutions in Indonesia is modified in the following Table 1:
Table 1. Indicators of the 17 SDGs agenda in higher education institutions
|
SDG |
Aspect |
Implementation of Higher Education Strategy Policy |
|
SDG1 |
End poverty in all its form |
Poverty alleviation programs, social assistance and community empowerment implemented by universities. |
|
SDG2 |
End hunger, achieve food security and improved nutrition and promote sustainable agriculture |
Food security research programs, sustainable agriculture, stunting alleviation, agricultural land conservation. |
|
SDG3 |
Ensure healthy lives and promote well-being for all at all ages |
Health research programs, health social activities for the elderly and the poor, public health policies. |
|
SDG4 |
Ensure inclusive and equitable quality education and promote lifelong learning opportunities for all |
Difable-friendly curriculum and academic support, educational scholarships for underprivileged students, achievement scholarships, equal and non-discriminatory opportunities for students with various backgrounds and regions, affordable study fees for all groups. |
|
SDG5 |
Achieve gender equality and empower all women and girls |
Universities provide opportunities for women in strategic positions, tertiary institutions are anti-gender discriminatory in learning opportunities, learning processes and academic services. |
|
SDG6 |
Ensure availability and sustainable management of water and sanitation for all |
Universities practice sustainable water resource resilience, groundwater management, greenery and environmental sanitation. Universities have a greening campaign program and play a role in a sustainable clean water supply program for the community. |
|
SDG7 |
Ensure access to affordable, reliable, sustainable and modern energy for all |
Universities carry out vehicle emission reduction programs, green campuses. Universities are involved in research and actively campaign on pollution, the environment and renewable energy sources. |
|
SDG8 |
Promote sustained, inclusive and sustainable economic growth, full and productive employment and decent work for all |
Universities actively develop entrepreneurship, MSME development and sustainable business units. |
|
SDG9 |
Build resilient infrastructures, promote sustainable industrialization and foster innovation |
Universities develop innovation programs, patents used by industry, actively collaborate with industry on an ongoing basis. |
|
SDG10 |
Reduce inequality within and among countries |
Universities develop national and international collaborations to achieve the vision of continuous and independent education. |
|
SDG11 |
Makes cities inclusive, safe, resilient and sustainable |
Universities are actively involved in community empowerment, community economic independence and poverty alleviation. |
|
SDG12 |
Ensure sustainable consumption and production patterns |
Universities have recycling programs, efficiency of infrastructure, energy saving. |
|
SDG13 |
Take urgent action to combat climate change and its impact |
Universities are active in campaigns for saving energy, recycling waste, reducing plastic waste and going green. |
|
SDG14 |
Conserve and sustainably use the oceans, seas and marine resources |
Universities are active in environmental, river and marine conservation activities. |
|
SDG15 |
Sustainably manage forests, combat desertification, halt and reserve land degradation, halt biodiversity loss |
Universities are active in forest conservation, saving the environment, greening and land conservation. |
|
SDG16 |
Promote peaceful and inclusive societies for SD, provide access to justice for all and build effective, accountable and inclusive institutions at all levels |
Universities are managed in a transparent, accountable and fair manner. Universities make sustainability reports published. |
|
SDG17 |
Revitalize the global partnership for SD |
Universities are actively collaborating at international level and in sustainable development research. |
Source: [2, 5, 8] and colaborated by author.
3.1 Research methods and instruments
This study uses a questionnaire instrument to measure research variables. This study employs three sections of statistical techniques to comprehensively evaluate the implementation and role of higher education institutions in the sustainability agenda.
(1) This study used SDGs measurement items referring to Aleixo et al. [2]. However, this study carefully selected and employed relevant measurement items specific to the higher education context. Exploratory factor analysis (EFA) and confirmatory factor analysis (CFA) are utilized to assess the validity of the measurement items developed for evaluating the implementation of the 17 Sustainable Development Goals (SDGs) in higher education institutions. These techniques allow for the examination of the underlying factors and the confirmation of the measurement tool’s reliability and construct validity.
EFA plays a crucial role in determining whether the selected measurement items align well with the anticipated factors, thereby indicating their suitability for effectively measuring the variable of interest. Subsequently, CFA (Confirmatory Factor Analysis) is utilized to validate and confirm the identified factor structure from EFA while assessing its compatibility with the collected data. CFA employs more rigorous criteria, providing formal evidence concerning the validity of the factor structure. In this study, Structural Equation Modelling (SEM) was performed to conduct the CFA test, ensuring the robust evaluation of the measurement model's validity for the SDGs in higher education institutions.
(2) Statistical process control (SPC) analysis and Pareto diagrams are employed to evaluate the level of implementation of the SDGs agendas in higher education institutions using the developed measurement instrument. SPC analysis provides a systematic approach to monitor and control the implementation process, while Pareto diagrams and Importance-Performance Map analysis (IPMA) offer visual representations of the relative importance and performance of different SDGs agendas. These techniques aid in identifying areas of improvement and prioritizing resources for effective implementation. (3) Importance-Performance Map Analysis is also conducted to provide insights into the essentiality and effectiveness by the effect of the 17 Sustainable Development Goals (SDGs) agendas for implementation in higher education institutions. This analysis allows for the identification of SDGs agendas that are both highly important and have a significant impact on the institution's sustainability performance. It provides valuable information for strategic decision-making and resource allocation. Hence, higher education institutions can gradually implement the SDGs agendas based on their importance and effectiveness.
3.2 Research population and sample
The research population is an entity, namely all Muhammadiyah/Aisiyah tertiary institutions which currently number 171. For sample measurements using the Krejcie and Morgan [19] method, there are 118 respondents. In his article, Krejcie shows techniques and tables for calculating research samples based on the study population. The research population for this study consists of private higher education institutions affiliated with the Muhammadiyah and Aisiyah organizations. In order to determine the appropriate sample size, the method proposed by Krejcie and Morgan [19] was employed. As a result, a total of 118 private higher education institutions were selected as the sample for this study.
The respondents of the study are financial management officials and campus managers responsible for higher education facilities. These individuals were chosen because of their knowledge and insight into the implementation of sustainability development initiatives within their respective campuses. By including these key stakeholders, the study aims to gather valuable information on the current state of sustainability practices in private higher education institutions under the Muhammadiyah organizations.
3.3 Data collection techniques
The data collection for this study utilized a questionnaire administered to the heads of the finance departments in higher education institutions. The questionnaire was developed in collaboration with the officers of the Muhammadiyah foundation, which is recognized as the largest educational foundation in Indonesia. This collaboration ensured that the questionnaire captured relevant and accurate information regarding the implementation of sustainability development in higher education institutions affiliated with the Muhammadiyah organization.
By engaging with the finance department heads and collaborating with the Muhammadiyah foundation, the study aimed to collect comprehensive data that would provide valuable insights into the current practices and challenges related to sustainability development in these educational institutions. The study uses random probability [20] where all Muhammadiyah/Aisiyah private high education institutions have the opportunity to become a sample.
4.1 Stage 1
Stage 1: Developing a comprehensive measurement instrument for evaluating the implementation of the 17 Sustainable Development Goals (SDGs) in higher education institutions
4.1.1 Exploratory factor analysis (EFA)
In the EFA test, there are three important components which are the assumptions of exploratory factor analysis. First, to assess the correlation between indicators and determine the adequacy of the sample, the Barlett Test of Sphericity and Kesier-Meyers-Oklin (KMO) values were employed. The Barlett Test of Sphericity determines whether there is a significant correlation between the indicators, indicating the suitability of the data for factor analysis.
The KMO values measure the sampling adequacy by evaluating the proportion of variance in the variables that can be explained by common factors. If the results of the factor analysis show a significance value of the Barlett Test of Sphercity <0.05 and the KMO ranges from 0.5 - 1, then the factor analysis is said to be appropriate. A higher KMO value indicates a better fit of the data for factor analysis. The Barlett Test of Sphercity and Kesier-Meyers-Oklin (KMO) tests output in this study can be seen in Table 2:
Table 2. KMO and Bartlett's test
|
Kaiser-Meyer-Olkin Measure of Sampling Adequacy |
0.929 |
|
|
Bartlett's Test of Sphericity |
Approx. Chi-Square |
2451.179 |
|
df |
136 |
|
|
Sig. |
0.000 |
|
Based on Table 2 is known that the Barlett Test of Sphericity is 2451.179 with a significance level of 0.000. This result indicates that there is a high correlation and is feasible for further processing. The results of the KMO calculation were 0.929 or > 0.5 which indicated that the sample had high adequacy. Second, determine how many possible factors can be formed through the indicator variables used. These results can be seen in Table 3.
Table 3. Total variance explained
|
Component |
Extraction Sums of Squared Loadings |
|
|
% of Variances |
Cumulative % |
|
|
1 - 17 |
67.446 |
67.446 |
Table 4. Component matrix
|
Items |
Loading Factor |
|
SDGs1 |
0.716 |
|
SDGs2 |
0.759 |
|
SDGs3 |
0.864 |
|
SDGs4 |
0.861 |
|
SDGs5 |
0.540 |
|
SDGs6 |
0.824 |
|
SDGs7 |
0.880 |
|
SDGs8 |
0.793 |
|
SDGs9 |
0.837 |
|
SDGs10 |
0.730 |
|
SDGs11 |
0.792 |
|
SDGs12 |
0.835 |
|
SDGs13 |
0.879 |
|
SDGs14 |
0.727 |
|
SDGs15 |
0.877 |
|
SDGs16 |
0.893 |
|
SDGs17 |
0.759 |
Table 3 presents the factor analysis results, indicating that all measurement items formed a single factor. This is evident from the total variance value, which exceeds 1.00, indicating that there is only one factor that accounts for the majority of the variance. The eigen value for this factor is 67.446%, surpassing the threshold of 50%. These findings suggest that the measurement indicators developed in this study are robust and effectively measure their respective constructs within a single factor, as depicted in Table 4.
The component matrix derived from the Exploratory Factor Analysis (EFA) provides insights into the relationship between the observed variables and the extracted factors. It presents the factor loadings, which indicate the strength and direction of the relationship between each observed variable and each factor. In Table 4, it can be observed that all the SDGS items, which were selected to measure the SDGs, exhibit factor loadings greater than 0.5. This indicates that each indicator successfully captures and explains its respective construct effectively.
4.1.2 Confirmatory factor analysis (CFA)
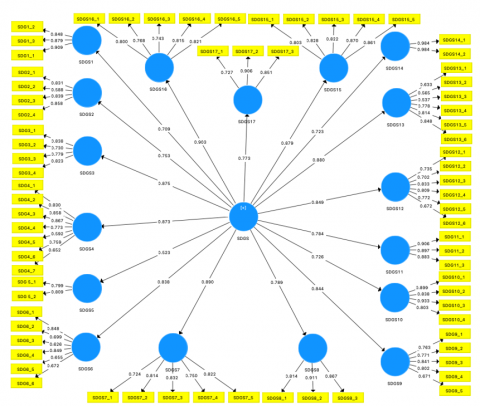
The objective of the Confirmatory Factor Analysis (CFA) test is to assess the unidimensionality assumption of the measurement instruments and determine the appropriateness of the model in measuring the observed variables. The CFA analysis provides insights into the model fit by examining the loading factor values, which should be greater than 0.5. In this study, a second-order model was employed in the Structural Equation Modeling (SEM) to test the validity of both the latent variables and the observed variables. Figure 1 presents the graphical representation of the model used in the CFA test:
In Table 5, the results of the comprehensive confirmatory factor analysis (CFA) measurement are presented, displaying the loading factor values for each item and construct.
Figure 1. Instrument testing model (processed by researchers)
Table 5. Loading factor values for items and constructs
|
Items/ Indicators |
Loading Factor (Items) |
Loading Factor (Construct) |
|
SDGs1_1 |
0.909 |
0.709 |
|
SDGs1_2 |
0.848 |
|
|
SDGs1_3 |
0.879 |
|
|
SDGs2_1 |
0.831 |
0.753 |
|
SDGs2_2 |
0.588 |
|
|
SDGs2_3 |
0.839 |
|
|
SDGs2_4 |
0.858 |
|
|
SDGs3_1 |
0.838 |
0.875 |
|
SDGs3_2 |
0.730 |
|
|
SDGs3_3 |
0.779 |
|
|
SDGs3_4 |
0.823 |
|
|
SDGs4_1 |
0.830 |
0.873 |
|
SDGs4_2 |
0.858 |
|
|
SDGs4_3 |
0.867 |
|
|
SDGs4_4 |
0.773 |
|
|
SDGs4_5 |
0.592 |
|
|
SDGs4_6 |
0.759 |
|
|
SDGs4_7 |
0.652 |
|
|
SDGs5_1 |
0.799 |
0.523 |
|
SDGs5_2 |
0.809 |
|
|
SDGs6_1 |
0.848 |
0.838 |
|
SDGs6_2 |
0.699 |
|
|
SDGs6_3 |
0.626 |
|
|
SDGs6_4 |
0.849 |
|
|
SDGs6_5 |
0.655 |
|
|
SDGs6_6 |
0.672 |
|
|
SDGs7_1 |
0.724 |
0.890 |
|
SDGs7_2 |
0.814 |
|
|
SDGs7_3 |
0.832 |
|
|
SDGs7_4 |
0.750 |
|
|
SDGs7_5 |
0.822 |
|
|
SDGs8_1 |
0.814 |
0.789 |
|
SDGs8_2 |
0.911 |
|
|
SDGs8_3 |
0.867 |
|
|
SDGs9_1 |
0.763 |
0.844 |
|
SDGs9_2 |
0.771 |
|
|
SDGs9_3 |
0.841 |
|
|
SDGs9_4 |
0.802 |
|
|
SDGs9_5 |
0.671 |
|
|
SDGs10_1 |
0.899 |
0.726 |
|
SDGs10_2 |
0.838 |
|
|
SDGs10_3 |
0.933 |
|
|
SDGs10_4 |
0.803 |
|
|
SDGs11_1 |
0.906 |
0.784 |
|
SDGs11_2 |
0.897 |
|
|
SDGs11_3 |
0.883 |
|
|
SDGs12_1 |
0.735 |
0849 |
|
SDGs12_2 |
0.702 |
|
|
SDGs12_3 |
0.833 |
|
|
SDGs12_4 |
0.809 |
|
|
SDGs12_5 |
0.772 |
|
|
SDGs12_6 |
0.672 |
|
|
SDGs13_1 |
0.633 |
0.880 |
|
SDGs13_2 |
0.565 |
|
|
SDGs13_3 |
0.537 |
|
|
SDGs13_4 |
0.778 |
|
|
SDGs13_5 |
0.814 |
|
|
SDGs13_6 |
0.848 |
|
|
SDGs14_1 |
0.984 |
0.723 |
|
SDGs14_2 |
0.984 |
|
|
SDGs15_1 |
0.803 |
0.879 |
|
SDGs15_2 |
0.828 |
|
|
SDGs15_3 |
0.822 |
|
|
SDGs15_4 |
0.870 |
|
|
SDGs15_5 |
0.861 |
|
|
SDGs16_1 |
0.800 |
0.903 |
|
SDGs16_2 |
0.768 |
|
|
SDGs16_3 |
0.743 |
|
|
SDGs16_4 |
0.815 |
|
|
SDGs16_5 |
0.821 |
|
|
SDGs17_1 |
0.727 |
0.773 |
|
SDGs17_2 |
0.906 |
|
|
SDGs17_3 |
0.851 |
The results in Table 5 demonstrate that all measurement items included in this study exhibited loading factor values exceeding 0.5. The loading factor is an essential component in factor analysis as it indicates the strength and direction of the relationship between observed variables and latent factors. A loading factor exceeding 0.5 suggests a robust relationship between observed variable and its corresponding latent factor, indicating that the observed variable effectively captures and measures the underlying construct. This highlights the suitability and reliability of the measurement items used in this study for assessing the intended constructs.
4.2 Stage II
Stage II: Assessing the level of implementation of the SDGs agendas in higher education institutions by developed measurement instrument
4.2.1 Perception index analysis
Perception index analysis is a valuable tool used to gain insights into respondents' perceptions of various variables. It allows researchers to illustrate the overall perceptions of respondents regarding the research variables being studied Ferdinand [21]. The index number is derived from the scores assigned to respondents' answers, with a scoring range typically ranging from 1 (the lowest score) to 5 (the highest score). To calculate the index number, one needs to determine the minimum and maximum values of the measurement indicators [21]. This method provides a quantitative means of summarizing and interpreting respondents' perceptions, enabling a comprehensive understanding of their views on the variables under investigation [21]:
a. Min value: (100% x 1)/5=20
b. Maximum value: (100% x 5)/5=100
The Likert scale representing different levels of agreement or disagreement with a statement. In this study, the index numbers are calculated based on the Likert scale responses and are expressed as percentages, ranging from 20% to 100%. The minimum index number of 20% corresponds to the lowest score of 1 on the Likert scale, indicating a lower level of agreement or perception. Conversely, the maximum index number of 100% corresponds to the highest score of 5 on the Likert scale, indicating a stronger agreement or perception. This index provides a standardized representation of respondents' perceptions, allowing for easy interpretation and comparison across different variables. The perception index value will demonstrate how excellent the implementation of SDGs in higher education institutions. These results offer insights into stakeholders' perceptions and can be used to assess the effectiveness and progress of SDGs implementation in higher education institutions as shown in Table 6.
Table 6. Perception index of SDGs implementation in higher education institutions
|
Items/ Indicators |
Index by Item |
Index by Construct |
|
SDGs1_1 |
64.64 |
65.31 |
|
SDGs1_2 |
67.39 |
|
|
SDGs1_3 |
63.91 |
|
|
SDGs2_1 |
58.70 |
63.62 |
|
SDGs2_2 |
73.33 |
|
|
SDGs2_3 |
65.07 |
|
|
SDGs2_4 |
57.39 |
|
|
SDGs3_1 |
53.91 |
60.36 |
|
SDGs3_2 |
68.55 |
|
|
SDGs3_3 |
61.45 |
|
|
SDGs3_4 |
57.54 |
|
|
SDGs4_1 |
54.35 |
60.37 |
|
SDGs4_2 |
51.88 |
|
|
SDGs4_3 |
50.00 |
|
|
SDGs4_4 |
64.35 |
|
|
SDGs4_5 |
66.38 |
|
|
SDGs4_6 |
66.38 |
|
|
SDGs4_7 |
69.28 |
|
|
SDGs5_1 |
73.19 |
71.16 |
|
SDGs5_2 |
69.13 |
|
|
SDGs6_1 |
61.88 |
59.18 |
|
SDGs6_2 |
56.09 |
|
|
SDGs6_3 |
69.28 |
|
|
SDGs6_4 |
60.00 |
|
|
SDGs6_5 |
56.23 |
|
|
SDGs6_6 |
51.59 |
|
|
SDGs7_1 |
46.38 |
55.13 |
|
SDGs7_2 |
59.71 |
|
|
SDGs7_3 |
61.01 |
|
|
SDGs7_4 |
53.19 |
|
|
SDGs7_5 |
55.36 |
|
|
SDGs8_1 |
59.86 |
59.71 |
|
SDGs8_2 |
57.83 |
|
|
SDGs8_3 |
61.45 |
|
|
SDGs9_1 |
62.17 |
60.78 |
|
SDGs9_2 |
63.48 |
|
|
SDGs9_3 |
56.96 |
|
|
SDGs9_4 |
56.52 |
|
|
SDGs9_5 |
64.78 |
|
|
SDGs10_1 |
67.54 |
66.41 |
|
SDGs10_2 |
69.28 |
|
|
SDGs10_3 |
67.39 |
|
|
SDGs10_4 |
61.45 |
|
|
SDGs11_1 |
65.65 |
65.56 |
|
SDGs11_2 |
62.90 |
|
|
SDGs11_3 |
68.12 |
|
|
SDGs12_1 |
49.28 |
58.43 |
|
SDGs12_2 |
61.30 |
|
|
SDGs12_3 |
64.35 |
|
|
SDGs12_4 |
56.96 |
|
|
SDGs12_5 |
54.49 |
|
|
SDGs12_6 |
64.20 |
|
|
SDGs13_1 |
62.17 |
57.87 |
|
SDGs13_2 |
66.09 |
|
|
SDGs13_3 |
68.12 |
|
|
SDGs13_4 |
51.30 |
|
|
SDGs13_5 |
50.72 |
|
|
SDGs13_6 |
48.84 |
|
|
SDGs14_1 |
49.86 |
49.13 |
|
SDGs14_2 |
48.41 |
|
|
SDGs15_1 |
54.64 |
54.09 |
|
SDGs15_2 |
48.41 |
|
|
SDGs15_3 |
50.29 |
|
|
SDGs15_4 |
58.55 |
|
|
SDGs15_5 |
58.55 |
|
|
SDGs16_1 |
63.62 |
60.52 |
|
SDGs16_2 |
67.25 |
|
|
SDGs16_3 |
60.58 |
|
|
SDGs16_4 |
58.26 |
|
|
SDGs16_5 |
52.90 |
|
|
SDGs17_1 |
41.30 |
47.58 |
|
SDGs17_2 |
48.41 |
|
|
SDGs17_3 |
53.04 |
|
|
Total SDGs |
59.72 |
|
4.2.2 Statistical process control (SPC)
Statistical Process Control (SPC) within the context of implementing SDGs in higher education institutions focuses on monitoring, analyzing, predicting, and controlling processes to ensure the efficient and effective utilization of resources based on the most impactful and crucial indicators. The objective is to optimize resource allocation for achieving Sustainable Development Goals (SDGs) in higher education. The SPC framework ensures that the implementation process behaves predictably to produce outcomes aligned with SDGs while maximizing the proper and efficient use of resources. Key tools include control charts, continuous improvement strategies, and design experiments [22, 23].
Variations in the implementation process that may impact the efficient use of resources are detected and addressed promptly, minimizing the likelihood of misallocations. SPC, with its emphasis on early detection and prevention of issues, offers an advantage over methods that rely on post-implementation corrections [24]. When the implementation process deviates from the desired efficiency, an alert is triggered, prompting stakeholders to investigate and rectify the causes of variation. However, a proactive approach is advocated to prevent inefficiencies in the implementation of SDGs in higher education. This involves adjusting the process proactively, ensuring that resources are allocated optimally based on the most effective and important indicators to yield aligned outcomes with minimal waste [25, 26]. SPC analysis can explain the stakeholders' perception of the implementation of SDGs in higher education, as measured by the Perception Index Analysis through control charts.
In organizational contexts, the utilization of Statistical Process Control (SPC) often revolves around specific processes, particularly when seeking to identify the most crucial indicators for implementing Sustainable Development Goals (SDGs). For instance, SPC is applied to assess and regulate formal inspections, testing procedures, maintenance protocols, and initiatives for personal improvement. Control charts serve as the primary tool for determining the statistical control of processes and, in this context, help in pinpointing the most significant indicators for effective SDG implementation [27].
Control charts consist of lines showing the Upper Control Limit (UCL), Center Line (CL), Lower Control Limit (LCL), and the sample mean. The benefit of using control lines in SPC is to identify the location of an ongoing activity process and see any possible deviations (under LCL).
CL=Standard deviation
UCL=Means + (3 x CL)
LCL=Means - (3 x CL)
Based on this equation, it is known that:
CL=6.002;
UCL=77.73;
LCL=41.71
Statistical techniques offered by SPC optimize the amount of information required for decision-making by understanding business baselines, providing insights for process improvements, communicating the value and results of processes, and fostering active and visible involvement. SPC offers real-time analysis to establish controllable baselines, learn, set, and dynamically enhance process capabilities, directing business focus toward areas in need of improvement [28, 29].
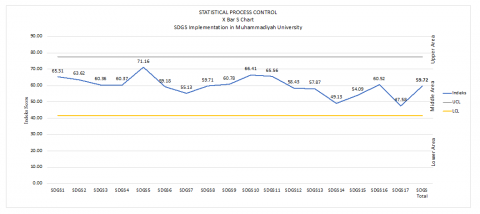
The following is the SPC Analysis Control chart, depicted in Figure 2.
Based on the control chart depicted in Figure 2, the analysis reveals that the overall implementation of the SDGs in higher education institutions is positioned within the middle range (between LCL and UCL). According to the respondent’s perception, SDG 5, which focuses on achieving gender equality, has the highest perception index value of 71.16, followed by SDGs 10 (Reduce inequality within and among countries). On the other hand, SDG 17, which aims to revitalize the global partnership for sustainable development, has the lowest index value of 47.58, followed by SDGs 14 (Conserve and sustainably use the oceans, seas and marine resources).
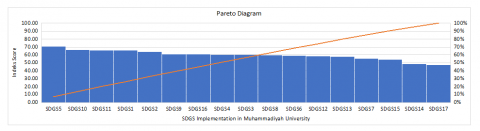
Figure 3 provides a sorted representation of the implementation of the SDGs in higher education institutions. The researcher illustrates the order from highest to lowest index using a Pareto diagram. The Pareto diagram is a graphical tool that provides information based on the relative significance of values. In this study, the values used are the SDGs implementation index values in higher education institutions. The Pareto chart in Figure 3 below presents a visual representation of the distribution of SDGs implementation index values in higher education institutions.
Figure 2. The implementation of SDGs agendas in higher education institutions
Figure 3. Pareto diagram SDGs implementation in higher education institutions
4.2.3 Importance-performance map analysis (IPMA)
Importance-Performance Map Analysis (IPMA) is a valuable analytical technique that enables the assessment of a construct's performance and its relative impact. IPMA analysis enables directors and managers to enhance their management strategies by highlighting the key factors that necessitate an immediate response [30]. This analysis facilitates the prioritization of constructs to enhance a specific target construct, pinpointing the most crucial areas for targeted actions. The insights gleaned from IPMA are valuable in practical studies that discern the varied impacts that specific dimensions of the construct exert on the phenomena [31].
Moreover, its application is rooted in three motivations: (1) IPMA facilitates more rigorous management decision-making, (2) serves as a potent tool for helping managers establish better priorities and allocate scarce resources more effectively, and (3) comes with guidelines for performance evaluation that benefit both the stakeholders [32]. In simpler terms, IPMA offers a clearer understanding of where management should direct its attention. Despite being utilized across various sectors, contributing to improved management findings [31] it has yet to be applied in the field of higher education management.
To evaluate models using IPMA with PLS-SEM, an additional procedure established by SmartPLS (Version: 3.2.9; SmartPLS GmbH Company, Bönningstedt, Germany) has been implemented [33]. Furthermore, we assess our path model using the traditional two-step evaluation recommended by Hair et al. [34]: (1) evaluating the measurement model and (2) appraising the structural model [34]. To determine the significance of parameters, we employed a bootstrap procedure [35].
Bootstrapping, a resampling technique, is capable of establishing the significance of path coefficients, as well as the weights and loadings of the indicators for each composite (i.e., the latent variables). This analysis involves calculating and mapping the performance of a particular construct, such as the implementation of SDGs in higher education institutions, along with its level of influence or importance. The resulting map provides a visual representation that helps stakeholders identify areas where performance should be improved to align with the construct's importance.
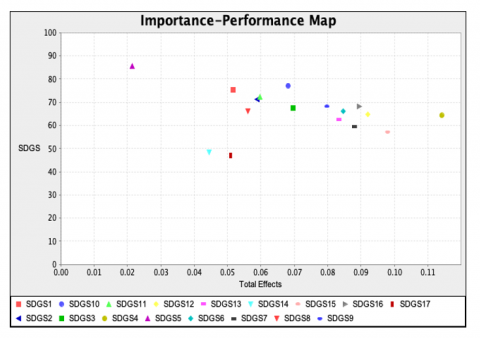
The IPMA of the SDGs implementation will be presented in a matrix format in Figure 4, divided into four distinct areas. These areas are:
Quadrant I: Excellent Decision. This quadrant represents the SDGs that are deemed highly important and are also being implemented effectively. These are the areas of strength that should be maintained and further improved upon to ensure continued success.
Quadrant II: Valuable predictor that needs to be performed. SDGs positioning into this quadrant are of high importance but are currently not being implemented successfully. These areas require immediate attention and improvement to bridge the performance gap and align with their significance.
Quadrant III: Too much performance for non-important issues. In this quadrant, the SDGs have relatively lower importance, yet they are being implemented successfully. While these areas may not require immediate focus, it is important to sustain the current performance levels to maintain a well-rounded approach to SDGs.
Quadrant IV: Not important and no need performed. This quadrant represents SDGs that have low importance and are also lacking in effective implementation. While these areas may not be the primary focus, efforts should still be made to enhance their performance or determine if they can be integrated with other SDGs to maximize impact.
Figure 4. IPMA matrix of SDGs implementation in higher education institutions
The Y-line or vertical line shows how much the performance of a construct is or how much a construct has been done or felt. So that the greater the percentage of the Y-line, the greater the performance of the SDGs. Meanwhile, the X-line or horizontal line shows how important the role of the construct is. So that the bigger the X-line, the more important the role of this type of SDG is for the development of SDGS. Based on the data presented in Figure 4, it can be observed that 13 SDGs are positioned in quadrant I (already executing 57,102% to 77,180%). This indicates that the higher education institutions under the Muhammadiyah organization have made appropriate and strategic decisions in prioritizing and implementing these important SDGs with relatively good performance.
By focusing on these key SDGs and achieving effective implementation, these institutions are aligning their efforts with the most significant sustainability goals while demonstrating commendable performance in the process. This finding signifies the successful integration of sustainable development principles into their educational practices and highlights their commitment to contributing to the broader SDGs agenda. Nonetheless, continuous efforts and monitoring will be essential to sustain and further improve the performance in these areas, ensuring a lasting impact on sustainable development within the higher education context.
Despite the overall positive performance and strategic implementation of SDGs in the higher education institutions under the Muhammadiyah organization, there were some instances of deviations or misaligned strategies. Specifically, SDGs and SDGs1 were implemented with relatively high-performance levels ranging from 85.617% to 75.381%. However, it is important to note that these particular SDGs may not have a significant impact on the overall development of the SDGs agenda. On the other hand, SDGs14 and SDGs17, which are categorized as less important SDGs, exhibited performance levels of 48.537% to 46.956% (as shown in Table 7).
Table 7. Performance and effect
|
SDGs |
Performance (%) |
Effect |
|
SDGs1 |
75.381 |
0.052 |
|
SDGs2 |
71.145 |
0.059 |
|
SDGs3 |
67.557 |
0.070 |
|
SDGs4 |
64.256 |
0.114 |
|
SDGs5 |
85.617 |
0.021 |
|
SDGs6 |
66.033 |
0.085 |
|
SDGs7 |
59.406 |
0.088 |
|
SDGs8 |
66.016 |
0.056 |
|
SDGs9 |
68.228 |
0.080 |
|
SDGs10 |
77.180 |
0.068 |
|
SDGs11 |
72.429 |
0.060 |
|
SDGs12 |
64.621 |
0.092 |
|
SDGs13 |
62.597 |
0.083 |
|
SDGs14 |
48.537 |
0.045 |
|
SDGs15 |
57.102 |
0.098 |
|
SDGs16 |
68.218 |
0.089 |
|
SDGs17 |
46.956 |
0.051 |
4.3 Stage III
Stage III: Providing insights into the 17 Sustainable Development Goals (SDGs) agendas by assessing their essentiality and effectiveness for implementation in higher education
After evaluating the implementation of SDGs in private higher education institutions, this study provides valuable insights into the 17 Sustainable Development Goals (SDGs) agendas and their impact on building Sustainable Development Goals (SDGs). These insights are derived from the analysis conducted using the Importance-Performance Map Analysis (IPMA) approach.
This approach ensures a targeted and effective implementation process, allowing institutions to make the most of their available resources and expertise. By understanding the effect and significance of each agenda, higher education institutions can strategically allocate their resources and gradually implement the SDGs over time. Implementing all the SDG agendas simultaneously may not be feasible for higher education institutions due to resource constraints. It is anticipated that higher education institutions will make informed decisions and prioritize the implementation of SDG agendas based on their impact and potential for maximizing performance.
This strategy enables institutions to concentrate their efforts on areas where they can make a substantial difference and gradually expand their implementation to cover other agendas. Through a phased approach, institutions can continuously assess their progress, adapt their strategies, and make informed decisions on the sequential implementation of additional SDG agendas. It is crucial for higher education institutions to recognize their resource limitations and adopt a realistic and pragmatic approach toward SDG implementation. By focusing on specific agendas and gradually expanding their efforts, institutions can make meaningful contributions to the SDGs while effectively managing their resources and ensuring long-term sustainability.
The effect of each SDG agenda is classified into quartiles based on their level of effect, forming distinct dimensions of high priority, medium priority, and low priority. The effect of each agenda is demonstrated in IPMA effect matrix as shown in Table 7.
The results of measuring the implementation of SDGs in Indonesian universities are concluded to be in the middle area with score of 59.72. The middle area zone shows that the implementation of the SDGs has mostly been implemented in university strategic policies, but is not yet optimal. Of the 17 SDGs agendas, implementation varied and gender equality (SDGs5) was found to be the most widely implemented SDGs agenda in Muhammadiyah tertiary institutions with a performance of 85.62%. This agenda is reflected in gender equality both in the placement of strategic leaders to student services. Even though it is the highest in the implementation index, if we look at the effect on the implementation of the SDGs as a whole, SDGs 5 has a less impactful effect, namely only 0.021. If you look deeper into the impact analysis, then SDGs4 (Quality Education) has the highest impact, namely 0.114 and the middle area performance value, which is 64.25%.
Quality education is implemented in a disability-friendly curriculum and academic support, educational scholarships for underprivileged students, achievement scholarships, equal and non-discriminatory opportunities for students with diverse backgrounds and regions, affordable study fees for all groups. This agenda is agenda that is very impactful for increasing the role of tertiary institutions in sustainability development (SD) in the 2014-2023 United Nations Decade of Education for Sustainable Development (UNDESD) program, namely education for all.
Referring to Resource Based Theory [10], this research is important as a note that due to limited resources owned by universities, the implementation of SDGs must be carried out in stages with an emphasis on certain agendas, especially in Indonesia. This becomes a recommendation for policy holders when formulating SDGs assessment instruments or university sustainability reports. Referring to the results of this study, the emphasis on the SDGs agenda in tertiary institutions can be emphasized on high-impact agendas as shown in Table 8 (IPMA Matrix) excellent decision zone.
The use of resources for high performance SDGs but low impact actually makes the implementation of higher education SDGs less on target. Pay attention to the IPMA Matrix (Table 7), in the Q4 zone (not important and no need performed) and Q3 zone (too much performance for non-important issues) there are No Poverty agendas (SDGs1), Partnerships to achieve the goal (SDGs17), life below water (SDGs14) and gender equity (SDGs5). Some of these agendas still have low performance (SDGs17=46.95% and SDGs14=48.54%) but some have high performance (SDGs1=75.38% and SDGs5 (85.62%). efficient use of resources, to increase the SDGs agenda, seeing that the impact is not too high.
Table 8. The dimension of SDGs agendas by their effect
|
Priority Scale |
SDGs |
Agenda |
Effects |
Dimension |
|
1 |
SDGs 4 |
Quality Education |
0.114 |
High Priority |
|
2 |
SDGs 15 |
Life on Land |
0.098 |
|
|
3 |
SDGs 12 |
Responsible Consumption and Production |
0.092 |
Medium Priority |
|
4 |
SDGs 16 |
Peace and Justice Strong Institutions |
0.089 |
|
|
5 |
SDGs 7 |
Affordable and Clean Energy |
0.088 |
|
|
6 |
SDGs 6 |
Clean Water and Sanitation |
0.085 |
|
|
7 |
SDGs 13 |
Climate Action |
0.083 |
|
|
8 |
SDGs 9 |
Industry, Innovation and Infrastructure |
0.080 |
|
|
9 |
SDGs 3 |
Good Health and Well-being |
0.070 |
|
|
10 |
SDGs 10 |
Reduced Inequality |
0.068 |
|
|
11 |
SDGs 11 |
Sustainable Cities and Communities |
0.060 |
|
|
12 |
SDGs 2 |
Zero Hunger |
0.059 |
|
|
13 |
SDGs 8 |
Decent Work and Economic Growth |
0.056 |
|
|
14 |
SDGs 1 |
No Poverty |
0.052 |
|
|
15 |
SDGs 17 |
Partnerships to achieve the Goal |
0.051 |
|
|
16 |
SDGs 14 |
Life Below Water |
0.045 |
Low priority |
|
17 |
SDGs 5 |
Gender Equality |
0.021 |
The results of testing the research instrument adopted from previous studies by Aleixo et al. [2, 5] and Tabucanon et al. [8] were valid and reliable in measuring the intended constructs. It has been found that all the indicators and questions in the research instrument were suitable for use. The findings indicate that the proposed measurement instrument for SDGs agendas is suitable for assessing the implementation of SDGs in higher education institutions. The instrument has been designed and tested to effectively measure the key aspects of SDGs implementation, allowing for a comprehensive assessment of progress and performance.
By implementing this measurement instrument, higher education institutions can systematically evaluate their efforts in relation to the SDGs agendas. It provides a structured approach to assess various dimensions of sustainability development, including social, economic, and environmental aspects. The instrument allows for a comprehensive evaluation of the extent to which the institutions are aligned with and actively working towards achieving the SDGs. The instrument also facilitates benchmarking and comparisons with other institutions, fostering learning and collaboration in the pursuit of sustainable development.
The second research objective aimed to assess the level of implementation of the 17 SDGs agendas in higher education institutions. This assessment provided valuable insights into the extent to which the SDGs agendas have been effectively implemented in these institutions. In conclusion, the findings of this study indicate that the implementation of the SDGs agendas in higher education institutions, specifically in private institutions under the Muhammadiyah organization, is positioned in the middle range. While there are notable achievements and efforts in implementing the SDGs, there is still room for improvement.
The study reveals that certain SDGs have been prioritized and implemented with relatively good performance, while others may require further attention and strategic planning. The measurement and evaluation of tertiary institutions in Indonesia is carried out by the Higher Education Accreditation Board which is the Indonesian government's accreditation agency. Assessment indicators include nine criteria, namely vision, mission, goals and objectives; governance, governance and cooperation; student; human Resources; finance, facilities and infrastructure; education; study; community service; tridharma outcomes and achievements [36].
One of the indicators for assessing accreditation in the financial sector, infrastructure assesses the adequacy of facilities and infrastructure as seen from their availability, up-to-date and relevance, including facilities and equipment for learning, research, PkM, and facilitating those with special needs. Facilitation points with special needs are part of the role of universities in the 2030 education sustainability development (SD) agenda [1], where universities are targeted to become part of continuing education that ensures quality, inclusive and fair education and promotes lifelong learning opportunities for all.
This indicator is part of the SDGs 4 indicator (Ensure inclusive and equitable quality education and promote lifelong learning opportunities for all). Nonetheless, the SDGs activities have been implemented into higher education governance and activities. What is noteworthy is that there is no specific reporting or specific measurement required regarding the implementation of the SDGs or the obligation of higher education institutions in Indonesia to implement the SDGs. This note is what researchers suspect is the cause of the implementation of the SDGs not being maximized.
The third objective of this study was to gain insights into the essentiality and effectiveness of the 17 Sustainable Development Goals (SDGs) agendas for implementation in higher education institutions consisting of three core agendas related to economic growth, social inclusion, and environmental protection. The 17 Sustainable Development Goals (SDGs) were developed to address the interconnected challenges facing our world. They are designed to be integrated and indivisible, meaning that progress in one goal is closely linked to progress in other goals.
The economic dimension of sustainable development focuses on promoting inclusive and sustainable economic growth, improving infrastructure, and fostering innovation and employment. It aims to ensure that economic progress is environmentally sustainable and benefits all individuals and communities. The agendas included in the economic dimension are SDG 1: No Poverty, SDG 2: Zero Hunger, SDG 3: Good Health and Well-being, SDG 8: Decent Work and Economic Growth, and SDG 9: Industry, Innovation, and Infrastructure
The social dimension of sustainable development emphasizes the need for inclusive societies that provide equal opportunities for all. This includes goals related to poverty eradication, quality education, gender equality, healthcare, and social protection. It aims to create societies where everyone can thrive and have their basic needs met. The agendas included in the social dimension are SDG 4: Quality Education, SDG 5: Gender Equality, SDG 10: Reduced Inequalities, SDG 11: Sustainable Cities and Communities, SDG 16: Peace, Justice, and Strong Institutions and SDG 17: Partnerships for the Goals.
The environmental dimension of sustainable development addresses the urgent need to protect the planet and its natural resources. It includes goals related to climate action, conservation of ecosystems, sustainable use of resources, and promoting clean energy and sustainable practices. It recognizes that environmental sustainability is essential for the well-being of present and future generations. The agendas included in the environmental dimension are SDG 6: Clean Water and Sanitation, SDG 7: Affordable and Clean Energy, SDG 12: Responsible Consumption and Production, SDG 13: Climate Action, SDG 14: Life Below Water, and SDG 15: Life on Land.
High education institutions have the responsibility to educate and shape the minds of future leaders and professionals. By incorporating all SDGs into their curricula, research, and campus activities, these institutions can foster a sense of global citizenship among their students. This empowers students to understand and actively engage in addressing pressing global challenges, promoting social responsibility and sustainable practices. Applying all the agendas of the Sustainable Development Goals (SDGs) in higher education institutions can bring about a range of positive outcomes. By integrating the SDGs into its operations, curriculum, and activities, the institution can enhance its reputation and standing. It demonstrates a commitment to sustainability and social responsibility, which resonates with students, faculty, staff, and the wider community. This reputation boost can attract motivated and engaged students who are passionate about making a positive impact in the world.
Implementing the SDGs can lead to an improved educational experience. Students gain a broader understanding of global challenges and develop the knowledge, skills, and competencies needed to tackle complex issues. The institution can offer interdisciplinary courses, research opportunities, and practical experiences that enable students to contribute meaningfully to sustainable development. Indeed, implementing all SDGs agendas in higher education institutions requires significant resources and strategic planning. Given the limited resources available, it is essential for institutions to prioritize certain agendas and develop effective strategies to maximize their impact.
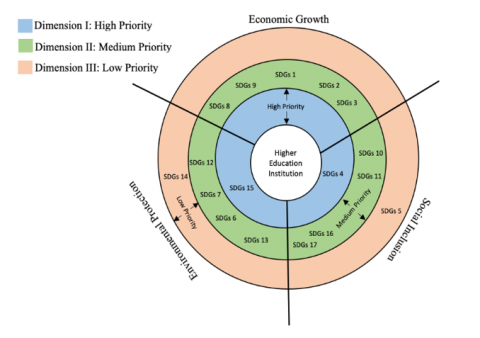
Through the assessment conducted in this study, it has been identified that the improvement of SDGs implementation in higher education institutions can be achieved through a three-stage approach, considering the dimensions of high priority, medium priority, and low priority (refer to Table 8). The following Figure 5 illustrates some key considerations that can help determine priorities and construct effective strategies.
Figure 5. The stage of the SDGs agendas implementation
In the first stage, the high priority dimensions of the SDGs agendas should be given utmost attention and focus. These dimensions are considered crucial and impactful in achieving sustainable development goals. Prioritizing these dimensions allows higher education institutions to concentrate their efforts and allocate resources effectively to areas that have a significant potential for positive change. The agendas included in the dimension I: high priority are SDGs 4 (social inclusion) and SDGs 15 (environmental protection).
In the second stage, the medium priority dimensions of the SDGs agendas should be addressed. While these dimensions may not be as critical as the high priority ones, they still hold importance in advancing sustainability within higher education institutions. By giving attention to these dimensions, institutions can further enhance their sustainability efforts and contribute to the broader SDGs framework. The agendas included in the dimension II: medium priority are SDGs 8, SDGs 9, SDGs 1, SDGs 2, SDGs 3 (economic growth); SDGs 10, SDGs 11, SDGs 16, SDGs 17 (social inclusion); SDGs 6, SDGs 7, SDGs 12, SDGs 13 (environmental protection).
In the final stage, the low priority dimensions of the SDGs agendas can be addressed. Although these dimensions may have a relatively lower impact, they should not be disregarded entirely. Institutions can gradually incorporate initiatives and actions related to these dimensions as they progress in their sustainability journey. The agendas included in dimension III: low priority are SDGs 14 (environmental protection) and SDGs 5 (social inclusion). By following this three-stage approach, higher education institutions can strategically and systematically improve their implementation of the SDGs agendas. This approach ensures that resources are allocated efficiently, allowing institutions to make meaningful contributions to sustainable development while considering their limitations and focusing on areas that yield the greatest impact.
The three stages of research that have been carried out have resulted in the conclusion that the implementation of the 17 SDGs agenda in universities in Indonesia, in this case Muhammadiyah universities, is in the middle zone. The highest performance is in SDGs 5 where universities provide opportunities for women in strategic positions, tertiary institutions are anti-gender discriminatory in learning opportunities, learning processes and academic services. Using instruments that have been tested for validity and reliability, the research proposes that optimizing the implementation of the SDGs in tertiary institutions in Indonesia can be focused in stages into 3 dimensions, namely high, medium and low priority. Priority scale is needed due to limited university resources. Based on resource-based theory, universities must choose priorities that have a high impact on their resources. From the point of view of higher education policy makers (government), they can maximize the implementation of the SDGs in order to support UNESCO's 2030 Education Sustainability Development agenda [1]. The government's role is needed in measuring, monitoring and enhancing this role. The author proposes the publication of university sustainability reports and structured evaluations by the government.
This study utilizes a survey instrument to provide recommendations for optimal decision-making in the implementation of the SDGs agenda. However, it is important to acknowledge certain limitations in our research. One such limitation is the restricted population sample, which only includes private higher education institutions under the Muhammadiyah organization. This limited scope may hinder the generalizability of our findings to other types of institutions or organizations. Future research should strive to examine the implementation of SDGs in a broader context, encompassing diverse educational institutions and regions beyond Indonesia. Additionally, to enhance the formulation of the SDGs index and ensure its applicability, a mixed-methods approach can be explored. By combining qualitative and quantitative research methods, a more comprehensive understanding of the sustainability practices and reporting formats in the high education institutions can be obtained.
[1] UNESCO. (2015). Incheon Declaration Framework for Action. In UNDP, p. 83.
[2] Aleixo, A.M., Azeiteiro, U.M., Leal, S. (2020). Are the sustainable development goals being implemented in the Portuguese higher education formative offer? International Journal of Sustainability in Higher Education, 21(2): 336-352. https://doi.org/10.1108/IJSHE-04-2019-0150
[3] de Paula Arruda Filho, N. (2017). The agenda 2030 for responsible management education: An applied methodology. The International Journal of Management Education, 15(2): 183-191. https://doi.org/10.1016/j.ijme.2017.02.010
[4] Bidarbakhtnia, A. (2020). Measuring sustainable development goals (SDGs): An inclusive approach. Global Policy, 11(1): 56-67. https://doi.org/10.1111/1758-5899.12774
[5] Aleixo, A.M. (2020). Conceptualization of sustainable higher education institutions, roles, barriers, and challenges for sustainability: An exploratory study in Portugal. Journal of Cleaner Production, 172: 1664-1673. https://doi.org/10.1016/j.jclepro.2016.11.010
[6] Farinha, C., Caeiro, S., Azeiteiro, U. (2019). Sustainability strategies in Portuguese higher education institutions: Commitments and practices from internal insights. Sustainability (Switzerland), 11(11): 3227. https://doi.org/10.3390/su11113227
[7] Abad-Segura, E., González-Zamar, M.D. (2021). Sustainable economic development in higher education institutions: A global analysis within the SDGs framework. Journal of Cleaner Production, 294: 126133. https://doi.org/10.1016/j.jclepro.2021.126133
[8] Tabucanon, A.S., Sahavacharin, A., Rathviboon, S., Lhaetee, H., Pakdeesom, D., Xue, W., Charmondusit, K. (2021). Investigating the critical issues for enhancing sustainability in higher education institutes in Thailand. International Journal of Sustainable Development and Planning, 16(3): 503-514. https://doi.org/10.18280/IJSDP.160311
[9] Budihardjo, M.A., Ramadan, B.S., Putri, S.A., Wahyuningrum, I.F.S., Muhammad, F.I. (2021). Towards sustainability in higher-education institutions: Analysis of contributing factors and appropriate strategies. Sustainability (Switzerland), 13(12): 1-14. https://doi.org/10.3390/su13126562
[10] Wernerfelt, B. (1984). A resource-based view of the firm. Strategic Management Journal, 5(2): 171-180.
[11] Times Higher Education. (2023). https://www.timeshighereducation.com/world-university-rankings/universitas-gadjah-mada.
[12] Lin, A.J., Chang, H.Y., Hung, B. (2017). Identifying key financial, environmental, social, governance (ESG), bond, and COVID-19 factors affecting global shipping companies-A hybrid multiple-criteria. Sustainability. https://www.mdpi.com/2071-1050/14/9/5148.
[13] Yang, S. (2021). Essays in Corporate Governance and Sustainable Finance. https://prism.ucalgary.ca/handle/1880/113274.
[14] Handayani, E., Sholihin, M., Pratolo, S., Rahmawati, A. (2023). Optimation principles of good financial governance to increase financial sustainability. Quality Access to Success, 24(196): 230-242. https://doi.org/10.47750/QAS/24.196.29
[15] Handayani, E., Sholihin, M., Pratolo, S., Rahmawati, A. (2023). Distribution of income diversification on financial sustainability of Indonesian private universities; empirical studies. Journal of Distribution Science, 21(3): 71-82. https://doi.org/10.15722/jds.21.03.202303.71
[16] Handayani, E., Sholihin, M., Pratolo, S., Rahmawati, A. (2022). Do Private universities achieve financial sustainability as a result of transformational leadership. International Journal of Sustainable Development and Planning, 17(8): 2365-2374. https://doi.org/10.18280/ijsdp.170803
[17] Handayani, E. (2023). Does the implementation of SDGs improve the performance of universities? International Journal of Research in Business and Social, 12(4): 454-460. https://doi.org/10.20525/ijrbs.v12i4.2599
[18] Kuswantoro, H., Sholihin, M., Djajadikerta, H.G. (2022). Exploring the implementation of sustainable development goals: A comparison between private and state-owned enterprises in Indonesia. Environment, Development and Sustainability, 25: 10799-10819. https://doi.org/10.1007/s10668-022-02505-1
[19] Krejcie, R.V., Morgan, D.W. (1970). Determining sample size for research activities. Educational and Psychological Measurement, 30(3): 607-610. https://doi.org/10.1177/001316447003000308
[20] Gay, M.A. (2016). Quantitative Research Relies on the Collection and Analysis of Numerical Data to Describe, Explain, Predict, or Control Variables and Phenomena of Interest. SAGE Publications, Inc.
[21] Ferdinand, A. (2013). Metode Penelitian Manajemen. Semarang: Badan Penerbit Universitas Diponegoro,
[22] Franco‐Santos, M., Kennerley, M., Micheli, P., Martinez, V., Mason, S., Marr, B., Gray, D., Neely, A. (2007). Towards a definition of a business performance measurement system. International Journal of Operations & Production Management, 27(8): 784-801. https://doi.org/10.1108/01443570710763778
[23] Heizer, J.H., Render, B. (2008). Operations Management. 9th Edition. New Jersey: Pearson Education.
[24] Mason, B., Antony, J. (2000). Statistical process control: An essential ingredient for improving service and manufacuring quality. Managing Service Quality: An International Journal, 10(4): 233-238. https://doi.org/10.1108/09604520010341618
[25] Oakland, J.S. (2004). Oakland on Quality Management. United Kingdom: Butterworth Heinemann.
[26] Salaheldin, S.I. (2009). Critical success factors for TQM implementation and their impact on performance of SMEs. International Journal of Productivity and Performance Management, 58(3): 215-237. https://doi.org/10.1108/17410400910938832
[27] Madanhire, I., Mbohwa, C. (2016). Application of statistical process control (SPC) in manufacturing industry in a developing country. Procedia CIRP, 40: 580-583. https://doi.org/10.1016/j.procir.2016.01.137
[28] Tan, B. (2022). Understanding consumer ethical decision making with respect to purchase of pirated software. Journal of Consumer Marketing, 19(2): 96-111. https://doi.org/10.1108/07363760210420531
[29] Anggara, A.A., Weihwa, P., Khananda, R.W.V., Randikaparsa, I. (2024). How do Indonesia firms encounter COVID-19 pandemic? An evidence of transformation of the roots of competitive advantage from EMDE country. Quality-Access to Success, 25(198): 59. https://doi.org/10.47750/QAS/25.198.07
[30] Wyród-Wróbel, J., Biesok, G. (2017). Decision making on various approaches to importance-performance analysis (IPA). European Journal of Business Science and Technology, 3(2): 123-131. https://doi.org/10.11118/ejobsat.v3i2.82
[31] Ringle, C.M., Sarstedt, M. (2016). Gain more insight from your PLS-SEM results. Industrial Management & Data Systems, 116(9): 1865-1886. https://doi.org/10.1108/imds-10-2015-0449
[32] Streukens, S., Leroi-Werelds, S., Willems, K. (2017). Dealing with nonlinearity in importance-performance map analysis (IPMA): An integrative framework in a PLS-SEM context. In Partial Least Squares Path Modeling: Basic Concepts, Methodological Issues and Applications. Cham: Springer.
[33] Henseler, J., Ringle, C.M., Sarstedt, M. (2015). A new criterion for assessing discriminant validity in variance-based structural equation modeling. Journal of the Academy of Marketing Science, 43(1): 115-135. https://doi.org/10.1007/s11747-014-0403-8
[34] Hair, J.F., Black, W.C., Babin, B.J., Anderson, R.E. (2014). Multivariate Data Analysis.
[35] Chin, W.W., Marcelin, B.L., Newsted, P.R. (2003). A partial least squares latent variable modeling approach for measuring interaction effects: Results from a Monte Carlo simulation study and an electronic-mail emotion/adoption study. Information Systems Research, 14(2): 189-217. https://doi.org/10.1287/isre.14.2.189.16018
[36] BAN-PT. (2019). Akreditasi Perguruan Tinggi Kriteria dan Prosedur 3.0. In Badan Akreditasi Nasional Perguruan Tinggi, p. 18.