Chinwe Sam-Amobi![]() | Obinna Ubani*
| Obinna Ubani*![]() | Theophilus Eze
| Theophilus Eze![]() | Emeka Mba | Ivo Henry
| Emeka Mba | Ivo Henry
© 2024 The authors. This article is published by IIETA and is licensed under the CC BY 4.0 license (http://creativecommons.org/licenses/by/4.0/).
OPEN ACCESS
Although the governance structure and environmental and agricultural impacts of peri-urban development in sub-Saharan Africa are known, little research attention has been given to understanding how residents of such areas are coping with their livelihoods in challenging locations in many urban centers in this region. This research aimed at investigating the livelihood coping strategies of peri-urban dwellers in Enugu, Southeast Nigeria. A cross-section survey involving two-stage cluster sampling technique was used in selecting 816 registered household heads who participated in this study. Questionnaire method was employed in the collection of data. Principal Component Analyses and multiple linear regression statistical tools were used to analyze the data. The results revealed the four main coping strategies to include home-based business (49.95%), retail trading (16.50%), domestic working (16.34%), and street trading (12.03%). Factors that influenced the identified coping strategies of these dwellers include age, sex, take-off capital, type of housing unit, and space availability. This study implies that contemporary urban planning strategies should take cognizance and integrate these coping strategies into modern urban planning practices and policy making. This is vital in ensuring that the contributions of this category of urban residents to the gross domestic product are adequately harnessed for national development.
coping strategies, informality, livelihoods, socio-economic challenges, survey, urban planning
A significant global milestone was reached in 2008 when the global urban population surpassed the rural population worldwide [1]. African countries, previously considered slow in urbanization among developing nations, have experienced an unprecedented urbanization rate, growing at over 5% annually, which is considerably higher than the urbanization rate of about 0.75% per year in developed countries [1]. Moreover, it has been reported that cities cover only about two percent of the Earth's surface [2]. However, cities accommodate more than fifty-five percent of the world's population and contribute approximately sixty percent of the global GDP [3]. Additionally, cities are responsible for over sixty percent of global greenhouse gas emissions [4], highlighting their significant global influence.
This rapid urbanization has led to various crises in urban centers, including traffic congestion, housing shortages, pressure on poorly maintained urban infrastructure, waste management challenges, inadequate accommodation for new migrants, and the spontaneous growth of urban slums [5]. It is believed that the high cost of rent in cities, coupled with limited economic opportunities and unrealistic government policies on social amenities like housing, have driven the urban poor to settle in peripheral and unconventional locations within urban areas [6]. A study conducted by the UN [7] estimated that nearly one billion people, representing one-sixth of the world's population, live in slums across cities worldwide. Unfortunately, the majority of these slums are found in developing countries, particularly in Africa, Latin America, and Southeast Asia [8, 9]. The review of the literature shows that in the developing countries, about 13% of the urban population [10] lived in sub-Saharan Africa and that this region housed about 25% of the slum population in the developing countries. Research on urban expansion has also shown that informal suburbanization and peri-urbanization are increasing unabated [11]. Similar discourse on the emergence of these peri-urban areas has described these as areas associated with residents judged to be living below the poverty line [11]. The challenges of these peri-urban areas are particularly unique for cities in sub-Saharan Africa [12].
Whereas the existing studies have focused on rural-urban migration rates, housing challenges, and slum redevelopment [13, 14], very few studies have attempted to identify the coping strategies of peri-urban dwellers. Recent works on peri-urban informal settlements have centered on areas of water supply, housing demand, health, poverty situation, self-governance, and trade-offs in ecosystems within peri-urban areas [11, 15-19]. Similarly, previous studies on slums in different parts of the world, such as the Barriadas of Lima, the Bustees of India, the Ghettos of North America, and the Ranchos of Venezuela, have failed to delve into the livelihood strategies adopted by these categories of urban residents [20]. Instead matters of inferior and deteriorating environmental conditions which result in reduced productivity have been the foci of such studies [21]. As a result, there is a lack of understanding of how this group of urban residents is coping with their daily livelihood needs in a marginalized urban environment and the strategies for ensuring that they are properly integrated into the mainstream of physical planning and economic activities of contemporary cities in the global South.
The Enugu City, Nigeria, presents a captivating mosaic of human settlements, raising numerous puzzles and research questions about the resilience, sustainability, and persistence of such communities. The housing environments range from squalid structures to well-designed buildings with organized tenancy. The majority of the peri-urban dwellers in Enugu occupy areas of the hills accessible only through narrow footpaths, as vehicular movements are restricted to the lower slopes half a kilometer away. Despite the absence of significant job opportunities, visible service industries, and accessible clean water supply, many migrants choose to reside in these areas due to their inability to gain access to housing within the city. This situation raises the question: What are the individual livelihood coping strategies employed by these dwellers to survive under these conditions? It was in a bid to answer this question that the current research investigated the livelihood coping strategies of peri-urban dwellers in Enugu, Southeast Nigeria. The specific objectives of this study were to (1) describe the socio-economic and demographics of residents of selected peri-urban settlements in Enugu, Southeast Nigeria, and (2) identify and analyze the residents' livelihood coping strategies in the study area.
This research contributes to knowledge by revealing the different livelihood coping strategies of residents of the peri-urban area of Enugu, a key metropolitan area in Southeast Nigeria. It also provides a fresh insight into the key factors responsible for the adoption of the identified coping strategies, which studies have yet to explore. It is expected that the findings of this research will not only add to the growing body of literature on peri-urban settlements in the global South but will inform urban planning and policymaking as it relates to the strategies for integrating and harnessing the potential of peri-urban residents into formal urban planning and development framework in Nigeria and other developing countries in sub-Saharan Africa.
2.1 Theoretical framework
The core underpinning theories of the current research are the Backwash and Spread effects theory, Burgess Concentric Theory, and Homer Hoyt Sector Model. The relevance of these theories in this research is explained in the following paragraphs. The Backwash and Spread effects theory explains the relationship between the core urban and peri-urban areas. The theory posits that the core urban areas usually pull the productive labor forces of periphery urban areas to themselves, thus resulting in poor performances and brain drain of industries in the peripheries, capital outflow, and much dependence in the urban core [22]. This migration to the core city is mainly due to the quest for better living condition and juicy employment. Another assumption of this theory is that there is a positive spread effect of the core’s development to the periphery [23]. The implication of this is that the urban areas will have negative incidences of congestion, high rents, and overcrowding. The import of this theory is that it explains the contemporary scenario of the features of settlements in peri-urban areas [24]. Enugu Urban is characterized by occurrences of traffic congestion and household overcrowding. This is similar to most other urban areas in Nigeria. Hence this theory fits the study area.
The Burgess Concentric theory was perhaps the first and most popular urban planning model. This concentric model was made popular by the Chicago school of thought led by Burgess in 1925. The concentric model of urban land use states that urban centers grow in concentric circles with the central business district (CBD) at the center. This was followed by the factory zone and zone in transition. He called the next circle workman’s home followed by the residential zone and finally the commuter zone. Although no mention was made of peri-urban settlements or zones, in the current situation, the peri-urban settlements or zones can be likened to commuter zones since most residents of this area commute to the CBDs for work and business activities. Despite the insight gained from this theory, it was discarded later by Homer Hoyt's sector theory and Harris and Ullman's multiple nuclei model because it lacks universality in application to real-world situations [25].
The Homer Hoyt Sector model came with major modifications of the Burgess Model. Proponents of this model posit that transport exerts a major structural influence on the land use shape of the urban land space. This model introduced five major zones which radiate from the center in a wave-like form to the outer area. Central business district is at the center from where all the other zones are hinged. The only outlying district is zone 5 which represents high-class residential areas. There is no relationship with the current state of peri-urban settlements in Enugu.
Alonso Access Space Trade-off Model posited that as homes are closer to the city center, there is usually low cost and time of commuting but with high rent and high cost of land [26]. In contrast, homes farther away from the urban center will attract a high cost of commuting and a low cost of land. However, land for residential development in the Peri-urban areas usually are provided at a relatively cheaper price. Unfortunately, commuting residents in peri-urban areas to city centers either for work- or non-work-related purposes will take longer commuting distances. All these theories, be the growth poles and urban diffusion model find expression in the theoretical framework for peri urban interface. However, the framework for their livelihood coping strategy is still a grey area that needs further conceptualization hence the need to fill this knowledge gap.
2.2 Peri-urban area as urban settlement typology
The review of the literature reveals that several authorities have been quoted in many studies as showing serious conceptual difficulties in defining peri-urban areas. Peri-urban as a place or process concept [27]. Many urban researchers [28-30] believe that the distinction between urban and rural areas is becoming very slim and the border definitions are arbitrary as it has slim transitional boundary areas. This blurred transitional boundary area is defined as the peri-urban area or urban fringe sandwiched between the urban and rural areas. These areas are trapped in the problems inherent in the conceptualization of both urban and rural areas. There are many ideas about what a peri-urban area is. Thus, divergent views on peri-urban definition could be endless [31]. To further explain the concept of peri-urban settlement, authorities gave a 2-definitional approaches to describing the peri-urban interface [14, 32]. Previous study used the explanation of discrete spatial limit to describe the peri-urban area, it posited that any area of a distance of about 30-50 kilometers beyond the urban built up edge should be described as peri-urban settlement [14]. However, using a more functional and broader parameter, any zone that is between fully urbanized land in cities and areas formerly used for agricultural purposes as peri-urban area [32]. He believed in the concept of rural –urban continuum. There are two major actors identified in the development of the peri-urban, the non-moving actors and the moving actors. Notable actors are peri-urban farmers, peri-urban residents, entrepreneurs, property developers and government institutions [33]. He described the leisure centers, industry, households and businesses as moving actors; and the non-moving actors he identifies to be land developers and owners. The predominant drivers of peri-urban growth are housing, population, services, infrastructure, employment and economy [34]. These drivers can either be pull or push forces. The pull factors includes better living condition, property investment for the future and cheaper land for housing, while the push forces are the residents spontaneous migration due to displacement from the core urban area [35]. However, it has been established that the inability of the majority of low-income earners to afford the high cost of rent in the organized and planned layouts has significantly contributed to the proliferation of peri-urban settlements [29].
Peri-urban areas, which are frequently impacted by urban growth and expansion, are undergoing a transformation aimed at creating a healthy environment and providing social management support. This transformation seeks to utilize peri-urban areas as valuable resources for cities [36]. These areas are often adversely affected by the rapid development of cities, particularly when they were previously occupied by farmers and villagers. In Colombo, the city authorities took measures to integrate these areas into the developing mainstream of the communities through the Community Development Committees (CDCs), thereby addressing their negative consequences [37]. The communities were not only organized but also connected to various administrative levels, such as neighborhoods, districts, and provinces. They were given significant responsibilities, including access to resources and finances. That study identified two notable steps that successfully shifted the erroneous perception of peri-urban areas, transforming them into positive settlement spaces that contribute to the growth and livability of cities.
Current research on peri-urban areas focuses primarily on evaluating land use change and environmental impacts [7], as well as the effects on agriculture, and concepts and definitions related to peri-urban areas [38, 39]. Insufficient attention has been given to studies that assess the impact of peri-urban development on household livelihoods and income. The World Bank conducted a study in response to growing concerns about peri-urban areas in Kenya, aiming to examine peri-urban development and changes in livelihoods [40]. That study specifically evaluated the impact of peri-urban development on household income using Nyahururu, a peri-urban settlement in Kenya, as a case study. The findings were consistent with similar studies conducted in other parts of sub-Saharan Africa, but it is important to closely examine the coping strategies employed in light of their effects on the urban environment [41].
A study conducted in 15 sub-Saharan African countries, focusing on lower-middle and low-income households, revealed that borrowing and selling assets were the common strategies used to cope with uninsured catastrophic health expenditures [42]. Households with higher inpatient expenses and lower income were reported to be more likely to resort to borrowing and selling assets. The absence of policies to mitigate food price inflation and the lack of decent-paying job opportunities for the urban poor contributed to the adoption of negative coping strategies among slum dwellers, who often lacked stable and reliable sources of income. Additionally, it was also reported that improving access to free primary schooling in slum areas helped to reduce the need to employ detrimental strategies like removing children from school.
2.3 Residents of informal urban settlements and factors influencing their livelihood coping strategies
Over the past few decades, rapid urbanization fueled by migration from rural to urban areas, occurred in sub-Saharan African countries concomitantly with slow economic growth in the region. The proportion of Africans living in urban areas increased from 15% in 1950 to 39% in 2010 and is expected to rise to 43% in 2020 [43]. States and Local Governments were unable to provide public services to the growing proportion of urban residents who ended up living in informal settlements characterized by high unemployment rates, poor housing, and poor public service provision including health, education, and security [44]. It is feared that up to 72% of urban dwellers in most African countries south of the Sahara live in slums due to poverty.
The demography characteristics of the dwellers in the peri-urban greatly influence the quality of housing, housing typology and affordability, thus the need to consider the socio-economic features of these different income groups of dwellers in housing developments cannot be overemphasized [45]. In matters of housing tenures in the peri-urban settlements, owner occupied housing is more pronounced than the rented or partly owned tenure [46]. He further submitted that the predominant factor that motivates the low income group to live in peri urban settlement is the affordability of housing.
Research has categorized coping strategies into two groups: ex-ante strategies and ex-post strategies [47]. The ex-ante strategies are protective risk-management actions by households before an eventual shock. These strategies usually take the form of insurance; self-insurance like precautionary savings and assets accumulation or community-based formal or informal insurance. Ex-post strategies are actions taken by households to mitigate the consequences of an adverse event. Examples of these strategies include reducing expenditures, increasing home production, or diversifying sources of income. Such strategies may have short-term or long-term impacts on both the family and the urban environment. Usually, households first implement coping mechanisms with short-term effects such as using up savings or selling assets, and when those mechanisms fall short, households may resort to other strategies with more long-term effects such as withdrawing children from schools as was found common among the Indonesian poor [47].
In Kenya for instance, Busck et al. [39] carried out an incisive study of the coping strategies by the urban poor in Nairobi Kenya, and found that between 60% and 80% of urban residents live in slum or slum-like conditions. They further discovered that in Nairobi, Kenya, about 73% of slum residents lived below the poverty line calculated using an expenditure-based poverty line of USD 37.7 per adult. The implication of this is that most of the urban residents in Nairobi are living impoverished and this will have a downturn in the overall standard of living of the residents and also the economic generation of the city will be relatively low as the situation will adversely affect the country’s GDP at large. Their findings are not different from similar studies in sub-Saharan Africa but their coping strategies needed to be closely examined in the light of concomitant effects on the urban milieu. Regarding expenditure, food spending was the single most important component, accounting for 52% of total households' income and 42% of total expenditures. A variety of household coping strategies were common. The most frequently used strategy is related to the reduction in food consumption, followed by the use of credit, with 69% and 52% of households using these strategies respectively. A substantial proportion of households also resorted to removing children from school to manage spending shortfalls. Formal employment, owning a business, rent-free housing, and being a member of the social safety net reduced the likelihood of using any of the stated coping strategies.
In a similar study, it was observed that massive migration of rural residents to the city to seek for livelihood led to migrants overwhelming Accra City's infrastructural facilities, leading to livelihood coping strategies deployed by households to cope with urban poverty in the 1980s [48]. Among the livelihood coping strategies identified were increased participation in informal sector activities, and employing legal and illegal methods in obtaining essential social services. They also observed an increased patronage of street food vendors, and multiple memberships of social, ethnic, and religious associations as a backup. The streets of Accra were flooded with migrants involved in the rental distribution of goods and foodstuffs such as newspapers, imported household items, crafts, toiletries, toys, non-essential items, etc. Carrying wares on heads and using bicycles, trucks, and taxis to transport goods from one part of the suburb to another became the order of the day. Providing skilled services by engaging in shoe shinning, watch repairing, hairdressing, manicure and pedicure services, typing of documents, etc. were also common. Other activities included repair and maintenance services such as fixing umbrellas, cookers, fridges, fans, and bicycles, etc., others included security services working as day and night watchmen for the shops and offices, car parks, and gambling services such as the sale of tickets for lottery and other games of chance as well as phone cards. It was also reported that the young among them went from door-to-door collecting waste materials to be recycled. Prostitution on a permanent or intermittent basis was widespread amongst the young females in the suburbs and peri-urban areas who engaged in this to improve their household income. Common among the abhorrent youths were engaging in organized and spontaneous crimes. The most common activities include the stealing of cash and other household electronic gadgets (television sets, video equipment, radios), mobile phones and communication equipment, and any moveable property [48].
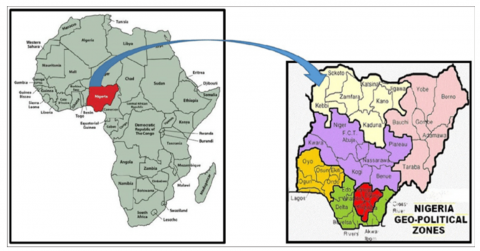
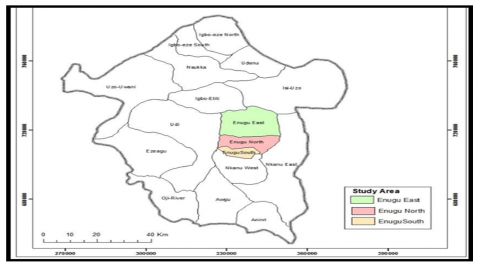
The selected case study is Enugu, the capital of Enugu State, and is located in the South-Eastern geopolitical region of the Federal Republic of Nigeria as shown in Figure 1. Enugu City is located between 6°2'10"N and 6°3'0"N latitude and between longitude 7°26'0"E and 7°37'0"E. The land area of the city is estimated at about 72.8 square kilometers. Enugu Urban consists of three local government areas, namely: Enugu North, Enugu South and Enugu East as shown in Figure 2 and Figure 3. Enugu is the foremost headquarter of the former south east region of Nigeria. It has 24 prominent residential neighborhoods. Enugu urban registered a population of 62,764 in 1952; the 1991 Census shows the population count of Enugu to be 462, 514, accommodated in 28 residential patterns. This increased to 722,664 in 2006 and is estimated to be 1,414,785 in 2022. The spatial scope of this study is limited to the identified peri-urban settlements recognized by Enugu State Government in the three Local Government areas in Enugu urban. The six settlements investigated in this study are Ikirike, Ngenev, Ugwu-Aaron, Ugwu-Alfred, Agu-Abor, and Ugbo-Odogwu.
Figure 1. Map of Africa showing Nigeria
Source: Ministry of Lands Survey, Enugu State, 2018.
Figure 2. Map of Nigeria showing Enugu
Figure 3. Map Enugu State showing Enugu urban
Source: Ministry of Lands Survey, Enugu State, 2018.
4.1 Research design and study population
The study utilized a cross-sectional survey research design, involving the distribution of questionnaires and conducting interviews with key residents of the settlements, particularly the pioneer settlers who are still alive. The six settlements investigated in this study are Ikirike, Ngenev, Ugwu-Aaron, Ugwu-Alfred, Agu-Abor, and Ugbo-Odogwu. These individuals provided valuable insights into the early establishment and development of the settlements. Specifically, they shed light on the patterns of land ownership, which played a crucial role in facilitating immigrants' settlement in these areas. The research population comprised households living in the six settlements identified in the study area. However, the sampling frame comprised 3,986 households found in the registers of various Neighborhood Watch Associations in the study area.
4.2 Sample size determination
Due to the lack of distinct population figures for these peri-urban settlements in the 1991 and 2006 National Population Census, a reliable sampling size was determined through a housing survey conducted with the assistance of satellite aerial maps. These maps allowed for an estimation of the number of housing units in the settlements and their distribution across the hill slopes. The total number of households was obtained from the security levy register of the Neighborhood Watch Associations in the settlements. Out of the 3,986 households identified from the registers of various Neighborhood Watch Associations, a minimum sample size of 816 was determined for the study using the Yamane [49] formula sample size determination formula.
$\mathrm{n}=\frac{N}{1+N\left(e^2\right)}$ (1)
where, n is the minimum sample size for the sample, N is the population size of 3986 households as obtained from the sample frame and e is the precision level which is 0.05 significance level at a 95% confidence level. Therefore, the minimum sample size was determined as follows:
$\mathrm{n}=\frac{3986}{1+3986\left(0.05^2\right)}$ (2)
$\mathrm{n}=\frac{3986}{10.97}=363.6$ households (3)
Although the minimum calculated sample size for the study was 364, in order to accommodate incomplete and invalid questionnaires, 816 copies of questionnaire was administered in the study.
A total of 452, representing 58% of the calculated sample size was added to accommodate for non-responses, invalid or lost questionnaires. This was similar to a study were 57% of the calculated sample size were added to the already determined sample size [50]. This translated to a minimum sample size of 816 respondents. This means that the lowest number of respondents in the survey in the six per-urban settlements should be 816 persons.
4.3 Data collection instrument and variables investigated
The data-gathering instrument used in this survey was a structured questionnaire designed by the researchers. It was designed to collect data on the demographic characteristics of the respondents, the general condition of the area, facilities in the environment as well as the resident’s livelihood coping strategies in the study area. The questionnaire were administered face to face to ensure that sampling across the respondents represented different background, education and gender. The questions in the questionnaire have responses that were either open in ranking scale or closed choices. A 4-point Likert scale responses was used to ascertain the residents’ livelihood coping strategies in the study area. Responses seeking degrees of agreement were posed to respondents', namely: extremely agreed (4), agreed (3), disagreed (2) and extremely disagreed (1). The choice of this 4-point Likert scale instead of the normal 3 or 5-point scale was to ensure that participants gave definite answers and avoided fake answers. [50, 51]. The questionnaire was first of all tested with few randomly selected residents of some of the settlements before administering it to the residents in the 6 settlements. This was done in order to assess the level of comprehension of the contents of the questionnaires by the respondents and make minor changes in the grammar to avoid ambiguity of any sort.
Since the current study aimed to identify coping strategies employed by the slum dwellers, 12 income-generating activities identified from the review of the literature and presented in Table 1 were included in the questionnaire as the possible components of the resident’s livelihood coping strategies in the study area.
Table 1. 12 variables used to investigate livelihood coping strategies
|
X1 |
Tailoring/Fashion Designing |
|
X2 |
Small Poultry farms/Pens |
|
X3 |
Part-time/Security guards |
|
X4 |
Shoemaking |
|
X5 |
Artisans |
|
X6 |
Patent Medicine Store |
|
X7 |
Crop Farming |
|
X8 |
Hawking by Children/Scavenging |
|
X9 |
Local food processing |
|
X10 |
Selling cooked food on wheelbarrows. |
|
X11 |
Water Vending |
|
X12 |
Petty Trading/Provision Stores |
Source: Variables from literature Review
4.4 Data collection and analysis
The survey was conducted using the two-stage clustering sampling technique as well as the simple random sampling techniques. Enugu urban was firstly clustered into the three administrative local government areas – Enugu North, Enugu South and Enugu East. Due to the dispersed location of these peri-urban settlements in these local government areas, six settlements were purposively selected from the 24 settlements in the study area. Aside cost reduction in the study, these selected settlements have the largest land mass area as well as the highest number of houses in the study area as observed from the satellite aerial map. Secondly, to generate quantitative data, 816 housing units were randomly selected based on the calculated minimum sample size from the clusters of 6 settlements in the study area. Simple random sampling techniques was used to select the 816 household heads across the six settlements of 3986 households. Since houses in these settlements were not arranged in organized streets or layouts, rather they appear in rows and disjointed pattern, houses were randomly selected in each of the cells in the settlements. Each settlement was divided into four cells from which households were representatively sampled. Proportionate allocation of questionnaires were made in each settlement based on the number of household percentage as seen in Table 2. This method was similar to a previous study [52]. The survey was conducted by the researchers and the employed research assistants. This questionnaire was administered in English language. The research assistants were engaged in the counting and administration of the questionnaires in each of the settlement and helped to interpret the content of the questionnaire to the very few household heads who were not able to read and write. They also aided in measuring the distance between buildings and plot boundaries. The administration and retrieval of copies of the questionnaire were done on weekdays and on weekends. This is in line with the methods adopted by previous study [53]. The questionnaire was administered face-to-face to ensure that sampling across the respondents represented different gender, educational and occupational backgrounds. Out of the 816 copies of questionnaires administered to household head, 678 copies, representing 83.1% response rate were retrieved and included in the analysis (see Table 2).
The questionnaire used for the study was subjected to content and face validity, Cronbach alpha was also used to test its reliability as it scores 0.79 which shows significance degree of reliability and adequacy of the instrument.
Table 2. Distribution of questionnaires in the various settlements
|
S/N |
Settlement |
*Households |
Percentage |
Distribution |
|
1 |
Ugwu Alfred |
680 |
17% |
139 |
|
2 |
Ugwu Aaron |
920 |
23% |
188 |
|
3 |
Ngenev |
800 |
20% |
163 |
|
4 |
Ugbo Odogwu |
790 |
20% |
163 |
|
5 |
Agu Abor |
440 |
11% |
90 |
|
6 |
Ikirike |
356 |
9% |
73 |
|
Total |
|
3986 |
100% |
816 |
Source: *Unpublished security levy Register of the Neighborhood Watch Associations, 2022.
The data were analyzed using simple descriptive statistics - frequency and percentage distributions, Principal Component Analysis (PCA) - a variant of factor analysis and multiple linear regression. Whereas frequency and percentage distribution table was used to address research objective 1, PCA and regression was used to address research objective 2. However, before subjecting the data to PCA, the dataset was subjected to the Kaiser-Meyer-Olkin (KMO) Measure of Sampling Adequacy test and Bartlett’s Test of Sphericity. The results revealed that the KMO Measure of Sampling Adequacy was 0.738 which is greater than the recommended minimum value of 0.6 and the Bartlett’s Test of Sphericity is significant at 0.001. This result implies that the sampling for the study is adequate and the result of the PCA was robust and reliable. The results are presented using texts and tables.
Multiple linear regression (MLR) statistical technique was used to analyze the factors that influenced the identified coping strategies of these dwellers. Eight factors which include age, educational status, marital status, sex, security of house tenure, take-off capital, type of housing unit, and space availability were used in this study as the exploratory variables which are also the independent variables. The dependent variable was derived from the PCA aggregated factor scores of the identified coping strategies attributes. The use of PCA aggregated factor score as dependent variable is similar to studies done previously [44, 54]. For the purpose of this analysis, the variable with more than two categories were recoded into two categories and this made them dummy variables. For instance, respondents who had educational qualification lower than primary school education were grouped as illiterates while those that attended primary school and above were regarded as literates coded ‘0’ and ‘1’ respectively. All other exploratory variables were also coded as binary variable, either 0 or 1. For instance, sex has either Male or female; house type is either permanent or temporary; security of tenure is either rented or self-owned; marital status is either single or married. Instances of respondents who were either widows or divorcee, were graded under married for the purpose of this study. Variables like age, take-off capital were collected as continuous variable. Data on space available was derived through measurement, the distance between the building and the plot boundary, this is referred as the setback from the building. Data processing and analysis for this study were performed using the Statistical Products and Services Solutions (SPSS) 22 for windows for statistical analysis of the quantitative data.
5.1 Socio-economic and demographic of the respondents
The study revealed the respondents’ age, educational status, and occupation, marital status, household size (family members), sex, monthly income and other demographical characteristics of the respondents as presented in Table 3.
The data indicates that 63.4% of the respondents are male, while 35.6% are female. This shows a gender-balanced representation. The larger number of men in the study area could be attributed to men been usually the household head. Shafiu et al. [55] remarked that it is the culture of Nigerian women to always keep questionnaires till their husbands return in order to get consent to answer the questions in the questionnaire. This may also influence the coping strategy to be adopted in the family since any strategy that must be adopted must be influenced by the husband decision.
The study revealed that about 88% of the respondents in the survey were low-income earners and had multiple income-generating activities. The National Housing Policy of Nigeria. NHP [56] has that any citizen that earns less than #200,000 per annum is categorized as poor. More so, the national acceptable monthly minimum wage in Nigeria is #18,000. These results were corroborated with the data indication that about 9.8% of the survey participants earned gross monthly household income of less than ₦4,100 (US$ 7), this is quite worrisome.
The study shows that the largest portion, constituting 42.0% of the participants, falls within the 50+ age category, highlighting the presence of older individuals. Following this, 22.0% are in the 20-29 age range, indicating a substantial representation of young adults. Moreover, 18.0% belong to the 30-39 age group, while 14.0% are situated within the 40-49 range. Notably, 4.0% of respondents are under 20 years old. This distribution sheds light on the prominence of respondents in their fifties and twenties, it could then be presumed that the respondents have the tendency and capacity to engage in livelihood coping strategy.
Table 3. Demographic data N = 678
|
S/N |
Characteristics |
Percentages |
|
1. |
Gender |
Male (63.4%), Female (35.6%) |
|
2. |
Age |
<20 (4.0%), 20-29 (22.0%), 30-39 (18.0%), 40-49 (14.0%), 50+ (42.0%) |
|
3. |
House type |
Temporary (31.7%), Permanent (67.3%) |
|
4. |
Education status |
No formal education (8.1%), primary school (9.3%), Secondary school (62.9%), Above Secondary school (19.7%) |
|
5. |
Occupation of Respondents |
Unemployed (13.7%), Employed (65.3%), Retired (21%) |
|
6. |
Average Annual Income |
<50,000 (9.8%), 50,000-100,000 (36.1%), 135,000-200,000 (42.1%), Above 200,000 (12%) |
|
7. |
Number of Years in Enugu |
<5 (31.7%), 5-8 (35.6%), 9-15 (22.8%), 16+ (9.9%) |
|
8 |
Marital status |
Married (81.7%), single (8.3%), widows (6.0%), divorcees (4.0%) |
|
9 |
Take-off capital |
< #10,000 (36.1%), #11,000-50,000 (27.8%), Above #50,000 (36.1%) |
|
10 |
Reason for living there |
Work, (78.2%), family\grew up there (11.4%), friends, (9.7%), studies (0.7%), |
|
11 |
security of tenure |
rented (61.6%), self-owned (38.4%) |
Source: Field Survey, 2022
The study further revealed the educational attainment of the respondents. Table 3 notably revealed that majority of the respondents are literates as more than 82.6% had secondary school education and above, only about 17.4% possess lower than secondary school educational qualification. This distribution reinforces the internal validity of the study since most of the respondents were able to understand the content of the questionnaire.
The study, surprisingly, revealed that all the sampled households were involved in one form of coping strategy, however, their take-off capital varies differentially. Although, the researchers sought for the average estimate that they used to take off on the coping strategy, the presentation in Table 3 was done in range. It was observed that 36.1% of the respondents used less than 10,000 naira as take-off capital for their survival endeavor that they engaged in. 27.8% of respondents had a take-off capital of between #11,000 - #50,000. The remaining started with over #50,000 as their initial take-off capital. This presentation show that the dwellers started with a very minimal amount even with no support from the government. They generate this take off capital mainly through cooperate thrift systems within themselves. The study additionally revealed the distribution of the number of years respondents have spent in Enugu.
5.2 Livelihood coping strategies
Four components were extracted using the PCA extraction method. To classify the identified components, the factor loadings were placed on rotations converged in four iterations, and a properly classified rotated component matrix shown in Table 4 was observed.
The coping strategies employed by the peri-urban dwellers were thoroughly examined and categorized into four distinct components, which collectively accounted for 94.82 percent of the observed variability. Each of these components is described in detail in the following paragraphs The first is home-based businesses, which showed strong positive loadings with various factors, including artisans (0.998), local food processing (0.901), tailoring and fashion designing (0.898), security guards (0.732), water vendors (0.778), and shoe making (0.895). Collectively, these factors account for 49.95% of the observed coping strategies, and thus, they stand out as a prominent coping strategy among the residents sampled in the study area. The second component which explains about 16.49% of the variance among the 12 variables listed in Table 1 and investigated in this research is retail trading. This component deals with coping strategies associated with retail trading. It is loaded by factors such as petty trading and provision stores (0.849) and patent medicine stores (0.984).
Table 4. Exploratory factor analysis of livelihood coping strategies
|
Livelihood Coping Strategies |
Factors |
|||
|
Home-Based Business |
Retail Trading |
Urban Agric |
Street Trading |
|
|
Artisans |
0.998 |
|
|
|
|
Local food processing |
0.901 |
|||
|
Tailoring/ fashion designing |
0.898 |
|||
|
Part-time/ Security guards |
0.732 |
|||
|
Water vendor |
0.778 |
|||
|
Shoe makings |
0.895 |
|||
|
Petty trading/ provision stores |
0.849 |
|||
|
Patent medicine stores |
0.984 |
|||
|
Crop farming |
0.986 |
|||
|
Small poultry farms/pens |
0.983 |
|||
|
Hawking by Children/ Scavenging |
0.867 |
|||
|
Selling cooked food on wheelbarrows |
0.816 |
|||
Note: Extraction method. PCA
Rotation Method: Varimax with Kaiser Normalization
Source: PCA Analysis Result
The third component identified is urban agriculture accounting for about 16.35% of the variance in the 12 variables investigated. The two factors loaded on this are crop farming (0.986) and small poultry farms/pens (0.983). Despite the challenging topography of the settlements, many dwellers actively engage in extensive crop farming and animal husbandry. Poultry farms, in particular, are prevalent in the hillside settlements. Additionally, terrace cultivation is a common practice among farmers residing in Agu Abor and Ugbo Odogwu. The last and the least component is street trading accounting for 12.03% of the variance in the variables. The two factors loading on this hawking by children (0.867) and selling of cooked food on wheelbarrows (0.816). Street trading is ubiquitous across all six peri-urban settlements examined in this study. In summary, these four components, namely home-based business (49.95%), retail trading (16.49%), urban agriculture (16.35%), and street trading (12.03%), collectively explain a substantial portion of the livelihood coping strategies employed by the peri-urban dwellers. With their high factor loadings, these components comprehensively account for 94.82% of the observed variance in the 12 variables investigated.
5.3 Factors influencing livelihood coping strategies
The factors that influenced these livelihood coping strategies were examined and it was revealed from the study that five explanatory variables had significant influence in the dwellers’ livelihood coping strategies adopted by dwellers in Enugu peri-urban settlements. The factors that influenced the identified coping strategies of these dwellers include age, sex, take-off capital, type of housing unit, and space availability. Table 5 shows the significant parameter that was revealed from the MLR output.
Table 5. The significant effect of each of the exploratory factors
|
Variables |
B |
Sig |
Remarks |
|
(Constant) |
-1.080 |
.286 |
|
|
Education |
1.682 |
.100 |
Not significant |
|
Age |
4.943 |
.001 |
Significant |
|
House tenure |
1.697 |
.122 |
Not significant |
|
Sex |
-3.674 |
.012 |
Significant |
|
House type |
7.034 |
.000 |
Significant |
|
Marital status |
1.779 |
.169 |
Not significant |
|
Space availability |
-2.430 |
.025 |
Significant |
|
Take-off capital |
2.777 |
.020 |
Significant |
Source: Coefficient table of MLR
The study revealed that three variables were not significant and these were house tenure, marital status and education. The implication of these insignificant variable is far reaching. However, the MLR results shows that the model analysis has R2 value of 0.909, P-sig 0.000 at 0.001 significant level.
The current research investigated the livelihood coping strategies of peri-urban dwellers in Enugu, Southeast Nigeria. The study revealed that of the twelve coping strategies identified in the existing literature, four of them: home-based businesses; retail trading, urban agriculture, and street trading were identified with the survey participants. The significant activities in home-based businesses are artisans, local food processing, tailoring and fashion designing, security guards, water vendors, and shoe making. It was found in the study and confirmed by the result of the analysis that these strategies dominate in the six peri-urban areas under study. This probably explained the reason behind the high influx of particular types of immigrants into the peri-urban areas with most of them acquiring their skills through informal training and apprenticeship scheme. This is primarily due to the preponderance of structural unemployment in Nigeria and the fact that urban areas have the opportunity to grow hence, the attractive place for all hence the massive rural-to-urban drift [42, 47]. These findings are consistent with those reported in a similar research in Accra, Ghana as previously highlighted in this paper [48].
Given the diverse coping strategies adopted by the dwellers in this area, it was clear that the residents were quite resilient and they utilized the social capital available in the peri-urban area. These coping strategies which served as a dynamic resource include retail and street trading, Informal domestic skill acquisition is no doubt ingenious and autonomous, and thus there is no much dependence on the government. These findings are clear indications that the welfare of dwellers was seen to be individual responsibility with minimal aid from the government. Th1231` is finding is rightly supported by previous studies indicating that residents of informal urban settlements do not pose an economic and financial burden to urban populations when considered in terms of place-based development [30]. However, this seem to be contrary to the submission suggesting that the government must intervene in residents’ well-being for an improved standard of living for the urban poor [15].
Again, the self-existing and supporting mechanism that was adopted by these dwellers to cope with the challenges they face which include poverty brings the question of the acceptance of the orthodox urban planning practices and how to handle issues associated with urban slums or peri-urban areas, especially in low-income countries. The scenario is quite contrary to the afore-mentioned principles of the backwash and spread effect theory which posited that the core urban areas usually pull the productive labor forces of periphery urban areas to themselves. The dwellers were found handling their challenges without much push to the core. This finding is contrary to the similar studies done in India [57] and in South Africa [58]. The current urban planning system whereby policymakers and traditional urban planners see perp-urban settlements as not part of the mainstream urban environments that should be given adequate planning consideration leaves much to be desired. Outside the state-reformed instruments of urban planning, the numerous urban problems in peri-urban areas can neither be solved by the market nor communities [59]. There is need for a radical review of planning principles while addressing matters of urban poverty and slums in sub-Sahara Africa.
The adoption of these livelihood coping strategies among the residents in the study area might have been influenced by some factors, principal among which are low level of educational attainment and unavailability of employment opportunities, which have contributed to the preponderance of urban poverty in Nigeria [44, 48]. Moreover, Oloto and Adebayo [31] identified the major causes of urban poverty has been identified to include rural unemployment, high influx of rural population to cities, lack of education to apply for better jobs, lack of wage control over unorganized informal sectors, high cost of living, absence of functional social security and pension scheme to the majority of the population especially those in the informal sectors, insecurity of tenure and under- employment in the country [31]. This resonates with the findings of peri-urban in India fingering poor economic conditions as the major factor responsible for the various coping strategies adopted by the dwellers [27, 60].
The study investigated the livelihood coping strategies among residents of six peri-urban settlements in Enugu, Southeast Nigeria. It identified four major livelihood coping strategies employed by the residents of the study area including home-based businesses; retail trading, urban agriculture, and street trading. This diversity in coping strategies in the peri–urban area as it reflects the utilization of dynamic resources and these have some planning and policy implications.
First, the study implies that future interventions in peri-urban areas should stress social networks and diversified local skills within the area in other to attain the needed resilience in the area. Given the nature of livelihood coping strategies devised by peri-urban settlers to survive in such challenging environments, the effective planning approach for supporting these coping strategies entails integrating their dynamics and activities into modern urban planning techniques. There is a need for pro-poor planning policies that would revise the current urban planning practices which make for only top-bottom implementation strategies. The current approach must encourage participatory urban management where the peri-urban dwellers are encouraged to make input in the design and implementation of interventions that involve them.
Second, given that peri-urban areas are predominantly characterized by informal economic activities that currently dominate urban production in many developing cities [41, 61, 62] they are for now the only viable options for urban dwellers to access land, services, job opportunities, and social mobility. Consequently, there is a need for the modern urban planning system and development policy framework to capture them in the scheme of things due to their contribution to the GDP. The reality is that these informal urban dwellers have become permanent residents and they provide essential and indispensable services to other urban residents in the areas of food production, motor mechanics, building construction, iron welding, carpentry, and others. Despite these, the current narrative is that the existing urban planning and design approaches in Nigeria and many developing countries largely ignored and marginalized peri-urban areas and their residents when it comes to the provision of basic social amenities and vital urban infrastructure. However, they are only remembered during electioneering and are often forgotten when the elections are over [63]. To change this narrative, government and aid agencies should partner with the existing Community-Based Organizations (CBOs) to design and implement development programmes that will provide better living conditions and enhance the spirit of entrepreneurship in the peri-urban population.
Again, implementing appropriate development policies aimed at promoting integrated development in rural areas through the encouragement of labor-intensive industries can contribute to the continuous growth of peri-urban settlements. It is also important physical planning and development agencies should urgently extend their planning controls to these settlements. Ultimately, it is imperative to deliberately integrate the coping strategies employed by peri-urban dwellers into a unified urban scheme through appropriate policy measures and control techniques through the provision of facilities and infrastructure that will make their businesses thrive. In so doing, they are gradually integrated into the mainstream urban development dynamics of Enugu and other cities in Nigeria.
The current research is limited to the few number of respondents who normally may introduce errors in the statistical result of the study. Again, the cultural belief that men should attend to home issues made the female respondents always consult their husbands before providing answers to some of the questions. This in turn can affect the reliability of the study. Further studies should consider other peri-urban areas in other different States and cities in Nigeria.
[1] Mabogunje, A.L. (2008). The inclusive city: Popular employment of local governments in a rapidly urbanizing Africa. Journal of The Nigerian Institute of Town Planners, xxi(1): 67-71.
[2] United Nations. (2021). New urban agenda. http://habitat3.org/wp-content/uploads/NUA-English.pdf.
[3] Ritchie, H., Roser, M. (2020). Urbanization. https://ourworldindata.org/urbanization, accessed on Dec. 5, 2020.
[4] United Nations. (2019). The sustainable development goals report. United Nations: New York, NY, USA.
[5] Fadare, W., Daramola, O. (2008). Multi-sectoral approach to urban growth management in Africa. Journal of the Nigerian Institute of Town Planners, XXI(1): 24-30.
[6] Murgante, B., Las Casas, G., Danese, M. (2007). The peri-urban city: Geostatistical methods for its definition. In Urban and Regional Data Management. London: Taylor and Francis. pp. 473-484.
[7] UN-Habitat. (2009). State of the World’s Cities: Harmonious Cities 2008/2009. London: Earth Scan Publications.
[8] Dumashie, D.A. (2011). Proactive Planning for Infrastructure and Peri-urban Settlement: A Tool Book for Surveyors to Facilitate Environmental and Social Resilience by FIG: African Task Force, East Africa Regional Conference.
[9] UN-Habitat. (2020). UN-Habitat unpacking the value of sustainable urbanization. In World Cities Report; UN-HABITAT: Nairobi, Kenya, pp. 43-74.
[10] UN-Habitat (2012). State of the World’s Cities 2012/2013. Nairobi: UN-Habitat.
[11] OECD/SWAC. Africa’s Urbanisation Dynamics 2020: Africapolis, Mapping a New Urban Geography. In Sahel and West Africa Club Secretariat. OECD Publishing: Paris, France.
[12] Fox, S. (2014). The political economy of slums: Theory and evidence from Sub-Saharan Africa. World Development, 54: 191-203. https://doi.org/10.1016/j.worlddev.2013.08.005
[13] Adell, G. (1999). Theories and Models of the Peri-Urban Interface: A Changing Conceptual Landscape. Development Planning Unit. London: University College London.
[14] Webster, D., Cai, J., Muller, L., Luo, B. (2009). Emerging Third Stage Peri-Urbanization: Functional Specialization in the Hangzhou Peri-Urban Region. Stanford: Asia-Pacific Research Center Encina Hall, Room E301 Stanford University.
[15] Ahmed, A. (2014). Factors in building resilience in urban slums of Dhaka, Bangladesh. Procedia Economics and Finance, 18: 745-753. https://doi.org/10.1016/S2212-5671(14)00998-8
[16] Thorn, J., Thornton, T.F., Helfgott, A. (2015). Autonomous adaptation to global environmental change in peri-urban settlements: Evidence of a growing culture of innovation and revitalisation in Mathare Valley Slums, Nairobi. Global Environmental Change, 31: 121-131. https://doi.org/10.1016/j.gloenvcha.2014.12.009
[17] Stoler, J., Tutu, R.A., Winslow, K. (2015). Piped water flows but sachet consumption grows: The paradoxical drinking water landscape of an urban slum in Ashaiman, Ghana. Habitat International, 47: 123-130. https://doi.org/10.1016/j.habitatint.2015.01.009
[18] Aklin, M., Bayer, P., Harish, S.P., Urpelainen, J. (2015). Quantifying slum electrification in India and explaining local variation. Energy, 80: 203-212. https://doi.org/10.1016/j.energy.2014.11.063
[19] de la Masselière, B.C., Bart, F., Thibaud, B., Benos, R. (2020). Revisiting the rural-urban linkages in East Africa: Continuity or breakdown in the spatial model of rural development? The case of the Kilimanjaro region in Tanzania. Belgeo, 1: 1-25. https://doi.org/10.4000/belgeo.38669
[20] Lloyd, P. (2019). Slums of Hope? Shanty Towns of the Third World. Pelican Books.
[21] Parikh, P., Chaturvedi, S., George, G. (2012). Empowering change: The effects of energy provision on individual aspirations in slum communities. Energy Policy, 50: 477-485. https://doi.org/10.1016/j.enpol.2012.07.046
[22] Lewin, P., Weber, B., Holland, D. (2013). Core–periphery dynamics in the Portland, Oregon, region: 1982-2006. The Annals of Regional Science, 51: 411-433. https://doi.org/10.1007/s00168-013-0552-6
[23] Hirschman, A. (1958). The Strategy of Economic Development. New Haven, Yale University Press.
[24] Degefa, T. (2008). Understanding the realities of urban poor and their food security situations; A case study at Berta Gibi and Gemachu Safar in Addis Ababa City, Ethiopia. Institute of Developing Economies, Japan External Trade Organisation, V.R F Series No 440.
[25] Carter, H. (1981). The Study of Urban Geography, Third Edition. Edward Arnold Publishers London.
[26] Alonso, W. (1964). Location and Landuses; Cambridge. Havard University Press.
[27] Narain, V., Nischal, S. (2007). The peri-urban interface in Shahpur Khurd and Karnera, India. Environment and Urbanization, 19(1): 261-273. https://doi.org/10.1177/0956247807076905
[28] Cohen, R. (1998). Recent trends in protection and assistance for internally displaced people. In Internally Displaced People a Global Survey. Norwegian Refugee.
[29] Tumwebaze, I.K., Niwagaba, C.B., Günther, I., Mosler, H.J. (2014). Determinants of households’ cleaning intention for shared toilets: Case of 50 slums in Kampala, Uganda. Habitat International, 41: 108-113. https://doi.org/10.1016/j.habitatint.2013.07.008
[30] Pugalis, L., Giddings, B., Anyigor, A. (2014). Reappraising the world bank responses to rapid urbanisation: Slum improvements in Nigeria. Local Economy, 29(4-5): 519-540. https://doi.org/10.1177/0269094214541377
[31] Oloto, E.N., Adebayo, A.K. (2012). The new Lagos Challenges facing the Peri-urban areas and its relationship with its City Centre. Department of Architecture, University of Lagos, Akoka, Lagos State, Nigeria.
[32] Allen, A. (2003). Environmental planning and management of the peri-urban interface: Perspectives on an emerging field. Journal of Environment & Urbanization, 15(1): 135-147. https://doi.org/10.1177/095624780301500103
[33] Salem, M. (2015). Peri-urban dynamics and land-use planning for the Greater Cairo Region in Egypt. Sustainable Development, 168: 109-119. https://doi.org/10.2495/SD150101
[34] Piorr, A., Ravetz, J., Tosics, I. (2011). Peri-Urbanisation in Europe: Towards European Policies to Sustain Urban-Rural Futures. Berlin: Plurel.
[35] Pradoto, W. (2012). Development Patterns and Socioeconomic Transformation in Peri-Urban Area. Berlin: Univerlagtuberlin.
[36] Owusu, F. (2007). Conceptualizing livelihood strategies in African cities: Planning and development implications of multiple livelihood strategies. Journal of Planning Education and Research, 26(4): 450-465. https://doi.org/10.1177/0739456X06298818
[37] Gadd, D., Water, R., Richard, H. (2003). Sanitation for Peri-Urban Communities. David Gadd, Project Manager, Rand Water.
[38] Kūle, L. (2008). Concepts of rurality and urbanity as analytical categories in multidimensional research. In Proceedings of the Latvian Academy of Sciences. Section B. Natural, Exact, and Applied Sciences, 62(1-2): 9-17. https://doi.org/10.2478/v10046-008-0004-3
[39] Busck, A.G., Kristensen, S.P., Præstholm, S., Reenberg, A., Primdahl, J. (2006). Land system changes in the context of urbanisation: Examples from the peri-urban area of Greater Copenhagen. Geografisk Tidsskrift-Danish Journal of Geography, 106(2): 21-34. https://doi.org/10.1080/00167223.2006.10649554
[40] World Bank Report. (2008). Poverty Reduction and Economic Management Unit, Africa Region 2008 Kenya Poverty and Inequality Assessment Report.
[41] EcoSanRes. (2010). Adapting Planning Tools to the Peri-Urban Setting: A Combination of Existing Tools, Stockholm Environment Institute, Swedish International Development Cooperation Agency (SIDA).
[42] Leive, A., Xu, K. (2008). Coping with out-of-pocket health payments: Empirical evidence from 15 African countries. Bulletin of the World Health Organization, 86(11): 849-856C. https://doi.org/10.2471/BLT.07.049403
[43] UN-Habitat. (2009). State of the World’s Cities: Harmonious Cities 2008/2009. London: Earth Scan Publications.
[44] Innocent, C. (2009). Peri-urban dynamics and regional planning in Africa: Implications for building healthy cities. Journal of African Studies and Development, 2(2): 15-26.
[45] Shen, J., Wu, F. (2013). Moving to the suburbs: Demand-side driving forces of suburban growth in China. Environment and Planning A, 45(8): 1823-1844. https://doi.org/10.1068/a45565
[46] Mokunfayo, A.F., Anthony, I. (2017). Factors influencing housing development in Lagos peri-urban settlements: Cases of Ibeju-Lekki and Ikorodu. ATBU Journal of Science, Technology and Education, 5(3): 31-40.
[47] Cameron, L.A. (2001). The impact of the Indonesian financial crisis on children: An analysis using the 100 villages data. Bulletin of Indonesian Economic Studies, 37(1): 43-64. https://doi.org/10.1080/000749101300046492
[48] Essamuah, Margaret, Tonah, S. (2004). Coping with urban poverty in Ghana: An analysis of household and individual livelihood strategies in Nima/Accra. Legon Journal of Sociology, 1(2): 79-96.
[49] Yamane, T. (1967). Statistics: An Introductory Analysis. 2nd Edition. New York: Harper and Row Publisher.
[50] Aigbavboa, C.O., Thwala, W.D. (2012). An appraisal of housing satisfaction in South Africa low income housing scheme. International Journal of Construction Management, 12(1): 1-21. http://doi.org/10.1080/15623599.2012.10773181
[51] Cooper, D.R., Schindler, P.S. (2006). Business Research Methods. Boston, Mass.: McGraw-Hill.
[52] Loh, W.Y. (2014). Fifty years of classification and regression trees. International Statistical Review, 82(3): 329-348. https://doi.org/10.1111/insr.12016
[53] Lak, A., Rashidghalam, P., Myint, P.K., Baradaran, H.R. (2020). Comprehensive 5P framework for active aging using the ecological approach: An iterative systematic review. BMC Public Health, 20(1): 1-22. https://doi.org/10.1186/s12889-019-8136-8
[54] Yechen, Y. (2015). Leisure and life satisfaction among tai chi and public square dance participants in Hong Kong. A thesis submitted in partial fulfillment of the requirements for the Degree of Master of Philosophy in Social Sciences, Lingnan University.
[55] Shafiu, A., Ashiru, B., Sunday, K.H., Muhammad, A. (2021). Determinants and constraints to outdoor recreation participation in Nasarawa Local Government. Kano Metropolis, Sokoto Journal of the Social Sciences, 11(2): 49-72.
[56] NHP. (2012). National Housing Policy, Nigeria ministry of Housing Newsleter, 8(2). Abuja, Nigeria.
[57] Ahmad, S., Choi, M.J., Ko, J. (2013). Quantitative and qualitative demand for slum and non-slum housing in Delhi: Empirical evidences from household data. Habitat International, 38: 90-99. https://doi.org/10.1016/j.habitatint.2012.02.003
[58] Watson, V. (2009). ‘The planned city sweeps the poor away…’: Urban planning and 21st century urbanisation. Progress in Planning, 72(3): 151-193. https://doi.org/10.1016/j.progress.2009.06.002
[59] Chisholm, M. (1979). Rural Settlement and Land Use: An Essay in Location. 3rd Edition, Hutchinson University Library.
[60] Adedire, F.M., Anthony, I., Adebamowo, M.A. (2017). Factors influencing housing development in Lagos peri-urban settlements: Cases of Ibeju-Lekki and Ikorodu. ATBU Journal of Science, Technology & Education, 5(3): 31-40.
[61] Wu, F., Zhang, F., Webster, C. (2013). Informality and the development and demolition of urban villages in the Chinese peri-urban area. Urban Studies, 50(10): 1919-1934. https://doi.org/10.1177/0042098012466600
[62] Fotso, J.C. (2001). Provision and use of Natural Health Services among Urban Poor Women in Kenya. Journal of Urban Health no 85 Nairobi.
[63] Chirisa, I. (2010). Peri-urban dynamics and regional planning in Africa: Implications for building healthy cities. Journal of African Studies and Development, 2(2): 15-26.