Qiqi Huang![]()
© 2024 The author. This article is published by IIETA and is licensed under the CC BY 4.0 license (http://creativecommons.org/licenses/by/4.0/).
OPEN ACCESS
The development of cities includes a wide variety of complexities and uncertainties that challenge spatial planners and policymakers. To navigate the intricacies, there's a growing exploration of adaptive approaches in response to dynamic physical and non-physical factors. This paper argues that urban adaptability evaluation should be standardized to promote sustainability and deduce a series of elements on spatio-functional configurations and the capacity building of local participants. This paper depicts the urban blueprint as a complex adaptive system, explores what goals and issues may comprise and how they can be related to planning, establishes an Adaptability Index (ADI) evaluation framework, and derives the spatial and strategic samples. These facilitate tailored planning for more adaptive cities. This study introduces methodological metrics to assist future planners and policymakers in evaluating and addressing the strategic and adaptive urban planning and design. Additionally, the study provides practical criteria for environmentally and socially responsible, healthy, and prosperous built environments throughout design, construction, and operation.
adaptability index (ADI), COVID-19, sustainability, urban adaptability, urban planning and design
Since the identification of the initial confirmed case of COVID-19 in Wuhan, China, in December 2019 [1], the pandemic has exerted a profound and far-reaching impact on a global scale [2]. Cities, as agglomeration centers, faced escalated risks attributable to rapid urbanization, population expansion, and heavy traffic levels [3]. The pandemic inflicted a huge toll on the global economy, precipitating the most severe recession since the Great Depression [4]. Highlighting the extensive consequences, the United Nations Framework for Immediate Socio-Economic Response to the COVID-19 Crisis warned that, beyond a health crisis, the pandemic profoundly affected societies and economies. It exacerbated global poverty and inequalities, underscoring the pressing need to address the Sustainable Development Goals [5]. In response to these socio-economic upheavals, the imperative of adopting adaptive city planning and design is underscored [6-8], particularly in developing urban areas. Encouragingly, with the increasing integration of instrumentation, datafication, and computation [9-13], smart techniques hold promise in establishing standardized systems that enhance urban adaptability through evaluation, application, and operation.
An adaptive city is characterized by prioritizing people in the development process, incorporating contextual information and synchronous technologies into urban management, and utilizing these elements as tools to address the dynamic materiality of urban development, encompassing staged planning and iterative engagement processes. Urban adaptability comes with a shift in focus, constantly seeking a balance between human life and urban space [14]. From Paris, London to Tokyo and New York, people witnessed how cities are gradually shaped and improved in fights against viruses, and urban space has been an important support for a healthy life [15]. In the post-pandemic era, adaptive planning and design must equip urban areas to encounter future shocks and pressures from public health crises and rapid urbanization. The focus is to better understand patterns in how pandemics affect cities, actions necessary to reduce the impacts [16, 17], and criteria for urban adaptability [18-21]. In this study, key issues and goals should always support urban response to changing physical (urban access, facilities, environmental factors, and land-use patterns) and non-physical (socio-cultural, governance, and economic factors) aspects [22, 23].
Previous research has employed various methods or indicators to evaluate urban resilience and formulate corresponding action plans [24-29], while others have summarized the trends toward adaptability faced by the entire urban system [30-33]. However, these studies often lack a detailed exploration of adaptability mechanisms at the urban planning and design levels. Addressing this gap, the study leverages the strengths of existing models and theories to enhance the urban adaptability framework, approaching it from an overarching strategic and spatial perspective to contribute to targeted adaptive planning and design. One notable comprehensive approach is the Urban Sustainability Framework (USF), established by the World Bank, which integrates social, economic, and environmental dimensions to assess the overall sustainability of urban areas [28]. Utilizing a four-stage approach, the USF involves diagnosis, vision and priority definition, financing interventions, and monitoring and evaluation, incorporating two enabling dimensions of governance and management. Despite delineating strategic goals and sub-goals, incorporating rationale, key issues, and indicators, the USF lacks quantitative integration with spatial planning, leaving a significant gap in its application to urban planning and design. Another influential model, the Resilience-Informed Sustainable Urbanism (RiSU) framework, offers an integrated terminology, analytical framework, and procedure to measure and predict a city's resilience in the face of climate threats [29]. While the RiSU framework integrates resilience thinking into urban planning, emphasizing cities' adaptive capacity to shocks and stressors, it primarily employs qualitative indicators at a macro level, lacking specific guidance for resilient spatial planning across diverse urban systems.
These constraints have relegated urban adaptability to a slogan for stakeholders [34] rather than a robust support system for enhancing the quality of life and well-being of urban inhabitants. Additionally, with the evolving focus of society, this study highlights the relative limitations in existing research on adaptability, particularly in critical domains such as health and carbon emissions (see Table 1). Therefore, this paper serves as a valuable addition by assimilating elements from the framework structure and indicator articulation of the USF and RiSU, and integrating the critical aspects related to sustainability and health, energy and carbon efficiency, and system connectivity.
Table 1. Major thematic areas in the literature
|
Thematic Category |
Subcategory |
Count |
Proportion |
|
Management & Governance |
Governance mechanisms |
19 |
13.1% |
|
Smart cities and smart solutions and their contribution to response and recovery |
28 |
19.3% |
|
|
Environmental Quality |
Energy efficiency & carbon reduction |
8 |
5.5% |
|
Effects of environmental factors and meteorological conditions |
21 |
14.5% |
|
|
Impacts on urban resource cycles |
8 |
5.5% |
|
|
Socio-economic Impacts |
Social impacts and factors for improved response and adaption |
22 |
15.2% |
|
Economic impacts |
10 |
6.9% |
|
|
Transport & Urban Design |
Issues related to urban mobility and transportation |
14 |
9.7% |
|
Urban design issues |
15 |
10.3% |
Note: Data sources are from the Scopus database with the search string “TITLE-ABS-KEY ((“covid” OR “coronavirus”) and (“urban” or “cities” or “urban planning” or “urban design” or “urban studies”))”, statistics as of April 30, 2023.
On this basis, a new standardized method is proposed to systematically describe urban adaptability, namely Adaptability Index (ADI). Starting from setting the goals and issues of adaptability, this paper deduces key indicators and related qualitative and/or quantitative indicators of ADI system. This paper then compares and contrasts quantitative indicators to generate spatial and strategic samples, which are stored in the ADI library. After site analyses, the matching samples are extracted from the ADI library and assembled into urban systems. By doing so, the connection between framework and application is built.
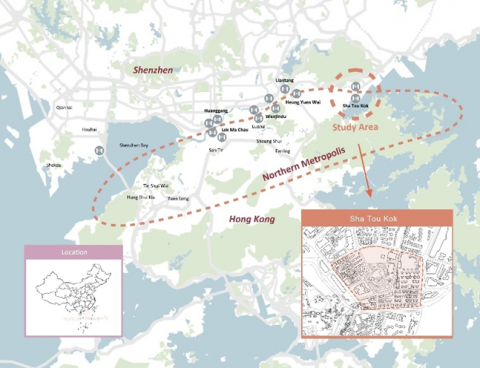
To interpret methodology in the whole process, this study selects Sha Tou Kok (see Figure 1) in the northern metropolis of Hong Kong as the template to introduce and apply the ADI system. The contemporary implication of the Northern Metropolis is highly in line with that of urban adaptability in three aspects. First, the northern metropolis is a significant strategic link for Hong Kong, under the normalized pandemic, to expand its development space and integrate into China’s economic cycle. Second, through rapid urbanization, this area can act as a booster to improve the cityscape of the northern region, thereby achieving balanced development within Hong Kong. Third, northern metropolis plan [35] is excellent testing for cooperation with Shenzhen to achieve a better division of labor, which further sublimates urban adaptability through regional common prosperity on the basis of resources.
Figure 1. Study area
The rest of this study is structured as follows. Section 2 introduces methodology, including the ADI evaluation framework, metrics and samples. Section 3 elaborates the assembly process of samples within the group-neighborhood-region network, detailing the application of the ADI method. The innovation, applicability, limitations, as well as the extended connotation and form of ADI are discussed in Section 4. The conclusions are summarized in Section 5.
2.1 ADI evaluation framework
Adaptive measures can act as buffers against social, economic, and physical shocks and pressures. The paper argues that, in the context of the pandemic and urbanization responses, a rebalancing of the development innovation portfolio towards more integrated, strategic, and sustained support for locally driven frugal innovation has become increasingly important in the contemporary adaptive system. On this basis, the paper builds an ADI evaluation framework.
2.1.1 Research method
According to the impact patterns of pandemics and urbanization [8], existing urban systems, and era disputes [36, 37], this paper sets up 7 processes and 9 steps to establish ADI system and apply it to urban planning and design. The technical route is shown in Figure 2.
Figure 2. Technical route
2.1.2 Multi-level ADI system
Urban adaptability refers to the sustained adjustment of dynamic changes that can help living environments fit in better with the development. During the COVID-19 pandemic, cities exhibited insufficient adaptability across various dimensions, including lockdown measures, traffic obstruction, limited open spaces, and diminished community autonomy [38]. In the post-pandemic era, to better address public health crisis and inevitable urbanization [39], this study identifies six contemporary adaptive goals - local, public, low-carbon, natural, intelligent, and flexible – drawing insights from the USF [28], RiSU framework [29], and IBM’s ESG Framework (https://www.ibm.com/impact). Moreover, the paper extracts five pivotal adaptive issues from the most relevant urban systems [6], comprising land use and function, transport, open space, community, and architecture. This research endeavors to achieve comprehensive adaptability goals by interweaving these five issues with the six specific goals, culminating in a multi-level Adaptability Index (ADI) system and enumerating the potentialities of ADI (see Figure 3).
Figure 3. Framework of multi-level ADI system
2.1.3 ADI weighting
With reference to literature, expert opinions, and analysis reports, this study refines the six goals into four measurable subframes: pandemic, energy & carbon, localization, and function. The study then employs the Delphi Method and Analytic Hierarchy Process (AHP) to assess the subframe weights by issue (see Table 2), rounded to the nearest multiple of 5%. For the Delphi Methods and the AHP, ten expert participants, comprising professors, planning directors of design institutes and enterprises, municipal officials, and resident representatives were carefully selected. The inquiry spanned four rounds, commencing with open-ended questions and progressing iteratively until a convergence of consensus was discerned. The consensus building in this study is defined as stability in responses across successive rounds.
In the AHP, participants engaged in pairwise comparisons of criteria, weighing their relative importance in decision-making. This process is conducted iteratively, with participants refining their judgments based on group feedback. The judgment matrix of the AHP during consensus building is elucidated in Figure A1 in Appendix A. In addition, Table A1 in Appendix A details the original, approximate, and corrected values of the subframe weights calculated from the AHP, organized by issue.
Table 2. Weights of subframes by issue
|
|
Pandemic |
Energy & Carbon |
Localization |
Function |
|
Land Use and Function (LF) |
20% |
25% |
15% |
40% |
|
Transport (TR) |
10% |
55% |
5% |
30% |
|
Open Space (OS) |
30% |
20% |
20% |
30% |
|
Community (CO) |
35% |
30% |
15% |
20% |
|
Architecture (AR) |
20% |
50% |
10% |
20% |
2.2 ADI metrics and samples
This study aims to establish an ADI system and extent it into a new paradigm of urban planning and construction. After matching the issues with goals, this study filters key indicators, and convert descriptions and quantitative controls to form ADI metrics. Based on this, the study generates spatial and strategic samples aligned with adaptive goals for each issue. These samples serve as optional constituents within the assembly adaptability model, operating under the group-neighborhood-region network paradigm (see Figure 4).
This study, centered on five major issues in the Sha Tau Kok, deduces key adaptive indexes (ADIs), qualitative/quantitative controls, and adaptive samples, integrating them into the urban system. To achieve comprehensive adaptability, each issue imposes a constraint of no more than 8 total key ADIs, with a maximum of three per goal. The selection criteria are informed by the weights delineated in Table 2. Tailoring the approach to the attribute of the issues, ADIs related to transport and open space emphasize qualitative controls, while those pertaining to land use & function, community, and architecture combine qualitative assessments and quantitative controls. Regarding land use and function issues, the derivation of ADIs to adaptive samples relies on morphological typology. Given the pronounced locality associated with land use dynamics, additional research is imperative to ensure the broader applicability of the derived indicators. In addressing community and architecture issues, the derivation of ADIs to adaptive samples is grounded in mathematical calculations as detailed in Appendix B and Appendix C. The computational methodology entails scoring each subcategory based on the assigned weights in Table 2, with higher scores within categories signifying heightened adaptability. This algorithm exhibits extensibility to a diverse array of urban applications. As for transport and open space issues, ADIs predominantly encompass qualitative policy guidance, characterized by its notable replicability.
2.2.1 Land use and function
Hong Kong has achieved miraculous growth through compact, mixed-use, and transit-oriented development. Building upon the tenet of "sustainable development", this study aims to extract the benefits of land use forms in Hong Kong and Shenzhen, strategically and spatially integrating them to optimize the job-housing balance index. Therefore, key controls of land use and function adaptability include the mixed proportion and development intensification.
Land use & function adaptability weaves four goals of local, public, low-carbon, and flexible (see Figure 5(a)). Local is reflected in the interactive way of community behavior; public refers to the equalization of public facilities; low-carbon adjusts the mixed ratio of land use to promote jobs-housing balance, such as code LF-LC-01; flexible responds to the shifts in industry modes and functions, such as the code LF-FL-02.
Based on the criteria depicted in Figure 5(a), this study puts forth adaptive guidelines for the four dominant functions of residential, commercial, industrial, and public services, considering varying floor area ratio (FAR) as well as development intensities. As shown in Figure 5(b), in the Sha Tou Kok area, the adaptive FAR for land use with residence-oriented and industry-oriented falls within the relatively expansive range of 5.0-6.0 and 5.5-6.5, respectively. These zones are typically characterized by a mix of podium and high-rise buildings. For land use tailored for commercial activities, the adaptive FAR is segmented into two intervals, namely 1.5-2.0 and 5.0-6.0, depending on the specific business model. Additionally, land use catering to service-oriented functions exhibits an adaptive FAR ranging from 0.6 to 1.5, primarily featuring podium buildings.
Figure 4. Schematic diagram of ADI methodology
Figure 5. Metrics and samples of land use & function: (a) Three-level ADI system; (b) Samples based on ADI controls
2.2.2 Transport
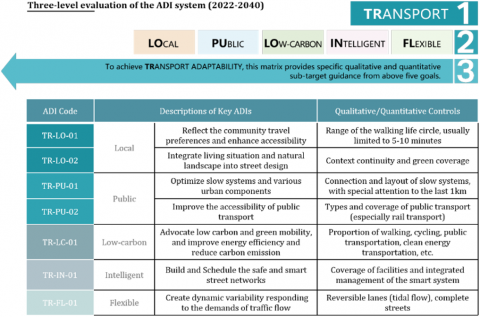
To advance a livable city in a rapidly urbanizing world, the transport principle of Hong Kong is shifting to a people-oriented framework where movement and place function are considered equally [39, 40]. The further purpose is to create a safe, efficient, fair, and comfortable travel environment. Based on the transformation, transport adaptability aims to hierarchically plan a safe and efficient traffic system (see Figure 6).
Transport adaptability weaves the five goals of local, public, low-carbon, intelligent, and flexible. Local reflects the community travel preferences; public enhances accessibility through optimizing the connection between slow systems and various urban components, such as the code TR-PU-01; low-carbon advocates green transport with the focus on energy efficiency and carbon reduction; intelligent builds and schedules a safe and smart street network, such as the code TR-IN-01; flexible refers to the dynamic variability responding to the demands of traffic flow.
2.2.3 Open space
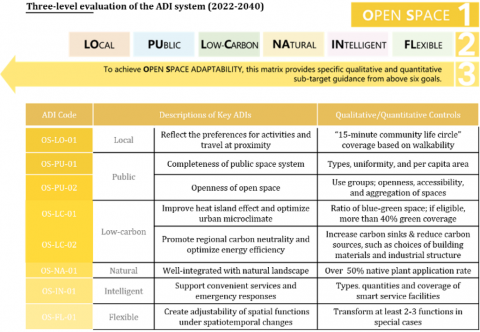
Open space is the center of social life, with increased significance during post-pandemic era. To promote the metabolism of social molecules, Hong Kong plans to build a high-quality healthy open space system. In this study, open space adaptability aims to improve microclimate, keep social distancing, and systematically connect the public service systems in communities and even urban areas, thereby weaving a common path to happy and healthy lives.
Figure 6. Three-level ADI system for transport
Figure 7. Three-level ADI system for open space
Open space adaptability weaves together six goals of local, public, low-carbon, natural, intelligent, and flexible (see Figure 7). Local reflects the preferences for activities and travel at proximity; public optimizes slow systems to connect multi-level services, such as code OS-PU-01; low-carbon improves urban microclimate by controlling the proportion of urban blue-green space and the choice of building materials; natural refers to the well-integrated with natural landscapes; intelligent supports convenient services and emergency responses through smart streets; flexibility shows adjustability of spatial functions under spatial-temporal changes.
2.2.4 Community
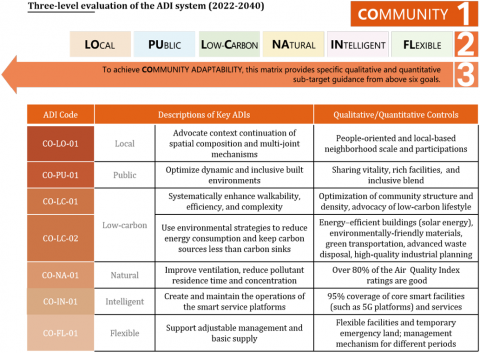
Community is the basic unit of society and meanwhile the smallest unit for urban renewal and public health prevention and control. Adaptive communities ensure urban security and social stability, with great significance to people's health and wealth safety. In this study, community adaptability aims to formulate criteria for operating mechanisms, spatial layout, intelligent services, etc.
As shown in Figure 8, community adaptability is reflected in all six goals. Local advocates context continuation of spatial composition and multi-joint mechanisms, such as code CO-LO-01; public optimizes dynamic and inclusive built environments; low-carbon improves spatial walkability, efficiency, and complexities; natural emphasizes the microclimate regulation, such as code CO-NA-01; intelligent devotes to the operation of smart service platforms; flexible supports adjustable management and basic supply.
Community ADI system conducts qualitative and quantitative assessments across three categories: enclosure, block scale, and group layout. Utilizing the criteria presented in Figure 8, this paper compares and contrasts the nine sub-categories, and assesses adaptability on a subframe level, as outlined in Table 3. These scores are derived from a synthesis of literature research and questionnaire data collected from residents, detailed in Table A2 in Appendix B. The scoring system uses a 5-point rating scale (1=poor; 5=exceptional), with scores rounded to the nearest multiple of 0.5.
After obtaining scores for the four subframes within each subcategory, these scores are weighted and summed according to weights of community in Table 2 to obtain a comprehensive adaptive rating for each subcategory. The detailed calculation formulas and outcomes can be found in Table A3 in Appendix B. Summarizing the results in Figure 9, it becomes evident that the semi-open (C1-2), 200m (C2-2), and peripheral (C3-2) samples achieve the highest rankings in the respective category in the case of Sha Tou Kok. Within category, a higher score indicates that the subcategory is more adaptive.
Table 3. ADI evaluation for community categories
|
Category |
Sub-Category |
Pandemic 35% |
Energy & Carbon 30% |
Localization 15% |
Function 20% |
|
Enclosure |
C1-1 Open |
3 |
N/A |
3 |
4.5 |
|
C1-2 Semi-open |
4 |
N/A |
4 |
3.5 |
|
|
C1-3 Enclosed |
3 |
N/A |
4 |
3 |
|
|
Block Scale |
C2-1 400m |
3.5 |
4.5 |
2.5 |
4 |
|
C2-2 200m |
4 |
4 |
4 |
3.5 |
|
|
C2-3 100m |
3 |
2.5 |
3 |
3 |
|
|
Group Layout |
C3-1 Aligned |
N/A |
2 |
4 |
3 |
|
C3-2 Peripheral |
N/A |
4 |
3 |
4 |
|
|
C3-3 Mixed |
N/A |
3 |
4 |
4.5 |
Figure 8. Three-level ADI system for community
Figure 9. Community samples based on ADI controls
2.2.5 Architecture
The housing shortage and expensive housing market have plagued Hong Kong for decades, further exacerbated by COVID-19 pandemic. In response, the 4th Chief Executive of Hong Kong, Carrie Lam, proposed a long-term blueprint for the construction of the northern metropolis [35], providing land and housing that can accommodate 2.5 million people and finding enough land to meet public housing demand for the next decade. To cope with the challenges of COVID-19 and rapid urbanization, architecture adaptability is committed to advancing energy efficiency performance, boundary resilience, and health equity.
Architecture adaptability is reflected in all six goals (see Figure 10). Local reflects the continuity of lifestyle and memory; public improves building accessibility and resilience of spatial interfaces, such as code AR-PU-01; low-carbon advocates passive ultra-low energy buildings through the entire cycle of design, construction, and operation; natural optimizes ventilation and thermal comfort; intelligent advances the operation and monitoring of the smart facility platform; flexible encourages possibilities in layout design and assembles of health units.
Figure 10. Three-level ADI system for architecture
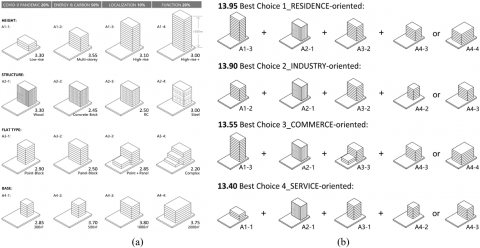
Architecture ADI system conducts qualitative and quantitative scoring across four categories: height, structure, flat type, and base. Based on the criteria in Figure 10, this paper compares and contrasts the 16 sub-categories, and assesses adaptability on a subframe level, as outlined in Table 4. Similarly, the scores are derived from a synthesis of literature research and questionnaire data collected from residents, detailed in Table A4 in Appendix C. The scoring system uses a 5-point rating scale (1=poor; 5=exceptional), with scores rounded to the nearest multiple of 0.5.
After obtaining the scores for the four subframes within each subcategory, these scores are weighted and summed according to the weights of the architecture in Table 2 to obtain a comprehensive adaptive rating for each subcategory. The detailed calculation formulas and outcomes can be found in Table A5 in Appendix C. Summarizing the results in Figure 11(a), multi-story (A1-2), wood (A2-1), point-block (A3-1), and 1000m² (A4-3) samples rank highest in respective category in the case of Sha Tou Kok. Within category, a higher score indicates that the subcategory is more adaptive.
Furthermore, based on the scores of adaptive samples and self-configuration requirements, this study deduces the optimal collocations for residence-oriented, industry-oriented, commerce-oriented, and service-oriented buildings in Sha Tou Kok (see Figure 11(b)). Additionally, this study suggests combining block samples into composite ones, since Jason Barr’s research shows that built-up areas generate a "scale return" in greenhouse gas emissions. A 10% increase in building area results in an approximately 7.1% increase in emissions [41]. On a per capita basis, larger buildings can reduce the average carbon footprint.
Table 4. ADI evaluation for architecture categories
|
Category |
Sub-Category |
Pandemic 20% |
Energy & Carbon 50% |
Localization 10% |
Function 20% |
|
Height |
A1-1 Low-rise |
4 |
4 |
1 |
2 |
|
A1-2 Multi-story |
3.5 |
3.5 |
3 |
4 |
|
|
A1-3 High-rise |
2.5 |
3 |
3 |
4 |
|
|
A1-4 Super High-rise |
2.5 |
3 |
1 |
4.5 |
|
|
Structure |
A2-1 Wood |
N/A |
5 |
2 |
3 |
|
A2-2 BC* |
N/A |
3 |
3.5 |
3 |
|
|
A2-3 RC* |
N/A |
2.5 |
4.5 |
4 |
|
|
A2-4 Steel |
N/A |
4 |
3 |
3.5 |
|
|
Flat Type |
A3-1 Point-Block |
N/A |
4 |
4 |
2.5 |
|
A3-2 Panel-Block |
N/A |
3 |
3 |
3.5 |
|
|
A3-3 Point + Panel |
N/A |
3.5 |
3 |
4 |
|
|
A3-4 Complex |
N/A |
2 |
4 |
4 |
|
|
Base |
A4-1 300 m² |
3.5 |
2.5 |
3 |
3 |
|
A4-2 500 m² |
4 |
3 |
4 |
3.5 |
|
|
A4-3 1000 m² |
3.5 |
4 |
3 |
4 |
|
|
A4-4 2000 m² |
2.5 |
4.5 |
2 |
4 |
* BC is the abbreviation of Brick Concrete; RC is the abbreviation of Reinforced Concrete.
Figure 11. Adaptive architecture samples: (a) Samples based on ADI controls; (b) Optimal collocations with function-oriented
2.3 Assembly of ADI samples
After obtaining adaptive samples,this study refines the operating procedures of the ADI system from a broader perspective. Taking the pilot sample of the Sha Tou Kok, the study further introduces the self-organizing assembly model of ADI within the group-neighborhood-region network.
2.3.1 Operating procedures
The ADI methodology aims to explore a local-based, generalizable, and timing model for evaluating and developing adaptive planning and construction in three dimensions: group, neighborhood, and region. On this basis, the application of ADI methodology should start with background adaptability analyses, then supplement issues and goals and broaden the connotation of the metrics and the derived samples (see Figure 12) to refine the multi-level ADI system, thereby better assembling and creating adaptive urban systems.
2.3.2 Function-oriented groups
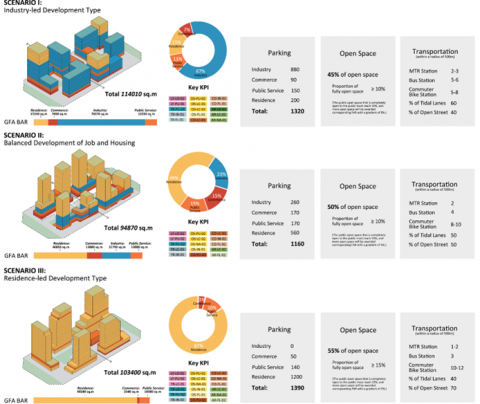
Selecting codes and samples from the ADI library, this study derives three examples of adaptive development types (see Figure 13): industry-led development type, balanced development of job and housing, and residence-led development type. The study also calculates the adaptive parameters of parking, open space, and transportation.
In the industry-led development scenario, it aligns with several ADI indicators, including LF-LO-02, TR-FL-01, OS-LC-02, CO-IN-01, AR-NA-01, etc. Regarding land use and function, the FAR stands at 5.51, falling within the range of 5.5-6.5 for industrial adaptability, as depicted in Figure 5(b). This typifies a mixed-use profile characterized by a combination of podium and high-rise buildings, of which the proportions of industry, commerce, public service, and residence are 67%, 7%, 11%, and 15%, respectively. For transport, the scenario offers 1,320 parking spaces, 60% tidal lanes, and ensures convenient access to public transportation stations within 500 meters. In terms of open space, the plan includes 45% open space and no less than 10% fully open space. At the community level, this scenario showcases the most adaptive peripheral layout. Regarding adaptive architecture, it adopts the 'Best Choice for Industry-oriented' configurations, including multi-story buildings, point + panel flats, and bases of 500 or 1,000 m².
In the scenario of balanced development of job and housing, it adheres to various ADI indicators, such as LF-PU-02, TR-LC-01, OS-NA-01, CO-PU-01, AR-LC-02, etc. Regarding land use and function, the FAR registers at 4.58. This shows a mixed use characterized by connected podium and high-rise buildings, of which the proportions of industry, commerce, public service, and residence are 23%, 15%, 15%, and 49%, respectively. For transport, the scenario provides 1,160 parking spaces, 50% tidal lanes, and an increased number of commuter bike stations within 500 meters. Open space allocation comprises 50% open space with a minimum of 10% fully open space. At the community level, the scenario displays the slightly less adaptive aligned layout. Concerning adaptive architecture, it follows the 'Best Choice for Residence/Industry-oriented' configurations, including multi-story or high-rise buildings, point + panel flats, and bases of 1,000 or 2,000 m².
Figure 12. Schematic diagram of the operating procedures for ADI methodology
Figure 13. Samples of adaptive development types
In the residence-led development scenario, it aligns with various ADI indicators such as LF-LO-01, TR-PU-02, OS-FL-01, CO-LC-01, AR-FL-02, etc. Concerning land use and function, the FAR stands at 5.00, falling within the range of 5.0-6.0 derived from residential adaptability in Figure 5(b). This shows a targeted mixed-use type where the proportions of commercial, public service, and residence are 3%, 10%, and 87%, respectively. Regarding transport, this scenario offers a total of 1,390 parking spaces, 40% tidal lanes, and a more convenient commuter bike service within 500 meters. Open space allocation comprises 55% open space with no less than 15% fully open space. At the community level, the entire scenario shows a peripheral layout. In terms of adaptive architecture, it adheres to the 'Best Choice for Residence-oriented' configurations, including high-rise buildings, panel flats, and bases of 1,000 or 2,000 m².
2.3.3 Neighborhood sample
This study re-screens codes and samples on a group basis and systematically integrate them into a neighborhood sample. As shown in Figure 14, since the neighborhood is positioned as a balanced development of job and housing, it presents a Scenario II pattern illustrated in Figure 13. This adaptive neighborhood applies various ADI indicators, such as OS-IN-01, TR-PU-01, CO-LC-01, CO-NA-01, CO-FL-01, AR-LC-01, etc. Specifically, the open space adaptability strengthens the system connection and optimizes the ecological circulation. Transport adaptability envisages right-of-way changes and road safety caused by driverless driving and proposes smart parking. Community adaptability aims to improve group layouts for health and well-being. Architecture adaptability advocates passive ultra-low energy consumption buildings and spatial redundancy and flexibility during the pandemic.
2.3.4 Regional development framework
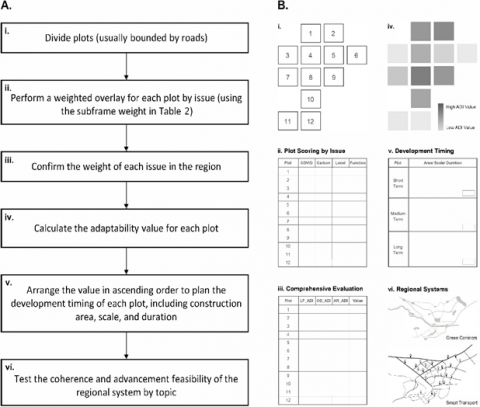
Due to the replicability of the ADI approach, this study expands the regional development framework for more extensive application. The framework first counts the plot scores, categorized by issue, through a weighted analysis of subframes. It then verifies the evaluation weight of each issue to calculate the adaptability value per plot. This adaptability value forms the foundation for progressing the adaptive process in stages, as illustrated in Figure 15. Furthermore, the study also furnishes analysis reference for each step.
Figure 14. Spatial sample of adaptive neighborhood and its matching codes
Figure 15. Regional development model: A: Method steps; B: References
The ADI methodology encompasses a comprehensive approach to urban adaptability planning and evaluation by integrating frameworks, samples, and applications. Compared to assessing the adaptability of specific urban systems, this systematic approach offers a framework that supports the adaptive transformation of cities. It surpasses the mere interpretation of macro-level adaptive trends by delving deeper into adaptive goals and issues through spatial and strategic samples. This approach consistently deduces adaptive indicators and samples and depicts the bottom-up assembly into the urban system, showcasing the entire process from methodology to practice in the ADI study.
Urban adaptability aims to optimize the urban system to improve the ecological living environment. Reviewing the ADI methodology, the study echoes Mouratidis’s research [20] that the role of transport and land use, urban nature, public space, facilities and services, housing, and information and communications technology in quality of life in cities was transformed during COVID-19. Based on research by Sharifi and other scholars [6], the study highlights thematic gaps and other critical issues that need to be addressed by urban scholars to accelerate the transition toward sustainable and resilient cities. Meanwhile, references are made to the new health-based design guidelines for promenades in Jeddah [42], resilient university campus in COVID and post-COVID era in Italy and Poland [43], and “Climate Village” plan [44] to enhance community contribution in addressing climatic hazard impacts with five indicators of resilience, mobility, community, perspectives, and digitalization. By integrating and expanding adaptive experiences within urban studies, the ADI measures possess enhanced capabilities to serve as buffers against social, economic, and physical shocks and pressures.
This study holds considerable implications for the development of adaptive urban policies in Sha Tau Kok and the broader Northern Metropolis. It suggests refined indicators for land use control, proposing adaptive FAR values within the ranges of 5.0-6.0, 5.5-6.5, 1.5-2.0/5.0-6.0, and 0.6-1.5 for residence-oriented, industry-oriented, commercial-oriented, and service-oriented zones, respectively. In the realm of transport, the study recommends a strategic emphasis on connectivity, dynamics, and intelligence to foster the adoption of sustainable modes. Addressing open spaces, adaptive strategies should concentrate on implementing multi-level slow systems facilitated by intelligent mechanisms, concurrently prioritizing microclimate enhancement through seamless integration with natural landscapes. Community policies geared towards adaptability should extend support to semi-open enclosures, 200m block scales, and peripheral group layouts. Architectural controls, designed for adaptability, focus on parameters encompassing multi-story height, wood structures, point-block flat types, and 1000m² bases. Furthermore, the study provides targeted guidance for optimal function-oriented building collocations and advocates for composite forms, referencing the "scale return" phenomenon in greenhouse gas emissions. Significantly, the scalability inherent in the proposed framework enhances its applicability, thereby augmenting theoretical and practical relevance, particularly in crisis-affected regions across the global north and south.
Several limitations should be noted in this study. As a versatile approach, the ADI method enables preliminary adaptive planning and design for any site by incorporating contextual information into an iterative and recursive evaluation framework. However, this versatility means that there is a lack of detailed description of the multi-level ADI system in terms of layering, scoping, and cohesion. For example, the calculation results for the same indicator may vary among communities of different sizes and spatial divisions. Additionally, it is crucial to note that certain pertinent factors, such as industry [45, 46], are not encompassed within the ADI evaluation framework. This study further argues that adaptability should be augmented by incorporating indicators related to psychological [47, 48] and social values [49-51] to optimize the equilibrium between livelihoods and economic development. Furthermore, the ADI study highlights the dynamic nature of adaptability. Cities are intricate and ever-evolving systems, where changing social needs consistently reshape the built environment [52]. Consequently, the ADI evaluation framework should continually adapt its goals, supplement issues, modify evaluation indicators, and implement relevant quantitative controls to align with the requirements of the time. Hence, the dimensions and indicators proposed in this article are expected to be applicable until 2040, with a recommended adjustment every two years.
Future studies are required to further enhance the consistency, replicability, and breadth of the ADI methodology. Addressing these concerns, the methodology holds the potential to evolve into an ADI information platform, and refine specific methods and devices for data collection, providing strong support for data availability and consistency in building adaptive indices and blueprints. ADI objects, the components that make up an ADI platform, are intelligent, have geometry, and store data. If any element is iterated, the ADI library will update the indicators and samples to reflect that change. With site datasets, the platform conducts metric analysis, sample collection, and system pairing in accordance with ADI-based procedures. These functionalities enable the platform to standardize, synthesize, and synchronize the entire ADI process, fostering a more collaborative environment for users, monitors, planners, policymakers, designers, project managers, and contractors.
The study explores how the ADI system can pioneer a deeper sustainability paradigm in contemporary crises. The ADI methodology not only offers a structured approach for assessing and enhancing urban adaptability but also contributes to the construction of cities that are more sustainable, resilient, and prosperous. The derived adaptive samples in this paper showcase larger building volumes, diversified land use patterns, optimized connectivity and naturalization of open spaces, higher community energy efficiency, and a broader array of green transportation options. By integrating framework, samples, and applications, the ADI methodology transcends traditional macro-level analyses, delving deeply into adaptive goals and issues through spatial and strategic samples. This comprehensive perspective enables a bottom-up integration into urban systems, highlighting the significance of methodology and practice within ADI research.
The innovative ADI evaluation framework presented in this paper encompasses quantifiable SMART targets (Specific, Measurable, Achievable, Relevant, and Time-bound), measurement indicators, verification samples, and key spatial assumptions. By considering cultural, public, and blended uses, the complex adaptive system flexibly matches or supplements appropriate framework and samples in the assessment, planning, design, and operation of cities, thereby achieving higher levels of replicable adaptability. Importantly, this ADI framework systematically expands the scope of adaptability by providing standardized methods to evaluate urban transformations, all while incorporating spatial and policy dimensions to foster bottom-up adaptive implementations. Moreover, this study underscores the importance of health and carbon adaptability, further elevating its relevance.
The ADI method outlines a blueprint for developing a more adaptive and healthier city capable of effectively responding future socio-economic shocks and pandemic challenges. Urban development is a complex process, and the standardized ADI method in this study is crucial for successfully navigating this complexity. On one hand, the multi-level ADI metrics helps planners and decision-makers in more effectively evaluating and addressing future strategic and adaptive planning and design. On the other hand, the comprehensive methodology guides practical implementation and continuously iterates and optimizes the ADI mechanism based on real-world feedback. Through this reciprocal feedback mechanism, the ADI system, equipped with evaluation, design, and operational criteria, empowers stakeholders to promote livability, socio-economic inclusiveness, and environmental sustainability within a more collaborative environment.
I extend sincere gratitude to Prof. Zhihang Luo and Prof. Yiyong Chen of Shenzhen University for their guidance. Meanwhile, I would like to thank Miss Yuqing Zheng of The University of Sheffield and Mr. Zeping Ou of The University of Hong Kong for their basemap support in Figures 5, 9, 14.
Appendix A
As shown in Figure A1, Appendix A supplements the judgement matrix of the AHP, compares two subframes by issue, and describes the value range used in the pairwise comparisons of the AHP. The data of the pairwise relative importance in the judgment matrix comes from the Delphi method with university professors, directors of design institutes and enterprises.
Furthermore, this appendix lists, by issue, the original, approximate, and corrected values of the subframe weights calculated according to the AHP (see Table A1). Approximate values are rounded to the nearest 5% multiple of the original value, and corrections are made for values where the sum of the approximate values for each issue subframe does not equal 100%.
Table A1. Raw values, approximate values, and corrected values of subframe weights by issue
|
|
|
Pandemic |
Energy & Carbon |
Localization |
Function |
|
Land Use & Function (LF) |
Original % |
19.45 |
23.1 |
14.85 |
42.6 |
|
Approximate % |
20 |
25 |
15 |
45 |
|
|
Corrected % |
20 |
25 |
15 |
40 |
|
|
Transport (TR) |
Original % |
9.85 |
55.2 |
5.35 |
29.6 |
|
Approximate % |
10 |
55 |
5 |
30 |
|
|
Corrected % |
10 |
55 |
5 |
30 |
|
|
Open Space (OS) |
Original % |
28.55 |
20.75 |
17.7 |
33 |
|
Approximate % |
30 |
20 |
20 |
35 |
|
|
Corrected % |
30 |
20 |
20 |
30 |
|
|
Community (CO) |
Original % |
36.5 |
27.8 |
12.7 |
23 |
|
Approximate % |
35 |
30 |
15 |
25 |
|
|
Corrected % |
35 |
30 |
15 |
20 |
|
|
Architecture (AR) |
Original % |
18.55 |
53.2 |
9.7 |
18.55 |
|
Approximate % |
20 |
55 |
10 |
20 |
|
|
Corrected % |
20 |
55 |
10 |
20 |
Figure A1. Judgment matrix of AHP and scale of preference between two parameters
Appendix B
Table A2 in Appendix B presents the reference and comprehensive ratings of ADI evaluation for various community categories. The reference data is obtained through a synthesis of literature research and questionnaire responses collected from residents. The ratings based on the literature research reflect the relative importance of the factors considered. The scoring system uses a 5-point rating scale, where 1 signifies poor and 5 signifies exceptional.
According to expert opinion, the comprehensive rating index (CRI) is adopted, with a 40% weight assigned to the literature study and a 60% weight to the questionnaire data. Additionally, the scores are rounded to the smaller nearest multiple of 0.5.
The comprehensive rating (CR) is used to calculate the subcategory adaptive scores through weighted summation, with assigned weights in Table 3. The detailed calculation formulas and outcomes can be found in Table A3.
Appendix C
Table A4 in Appendix C presents the reference and comprehensive ratings of ADI evaluation for various architecture categories. The reference data is obtained through a synthesis of literature research and questionnaire responses collected from residents. The ratings based on the literature research reflect the relative importance of the factors considered. The scoring system uses a 5-point rating scale, where 1 signifies poor and 5 signifies exceptional.
According to expert opinion, the comprehensive rating index (CRI) is adopted, with a 40% weight assigned to the literature study and a 60% weight to the questionnaire data. Similarly, the scores are rounded to the smaller nearest multiple of 0.5.
The comprehensive rating (CR) is used to calculate the subcategory adaptive scores through weighted summation, with assigned weights in Table 4. The detailed calculation formulas and outcomes can be found in Table A5.
Table A2. Reference and comprehensive ratings of ADI evaluation for community categories
|
Category |
Sub-Category |
Factors |
Pandemic 35% |
Energy & Carbon 30% |
Localization 15% |
Function 20% |
|
Enclosure |
C1-1 Open |
Literature |
3 |
N/A |
N/A |
4 |
|
Questionnaire |
3 |
N/A |
3 |
5 |
||
|
CRI |
3 |
N/A |
3 |
4.5 |
||
|
C1-2 Semi-open |
Literature |
4 |
N/A |
N/A |
3 |
|
|
Questionnaire |
4 |
N/A |
4 |
4 |
||
|
CRI |
4 |
N/A |
4 |
3.5 |
||
|
C1-3 Enclosed |
Literature |
4 |
N/A |
N/A |
2.5 |
|
|
Questionnaire |
3 |
N/A |
4 |
3 |
||
|
CRI |
3 |
N/A |
4 |
3 |
||
|
Block Scale |
C2-1 400m |
Literature |
4 |
4.5 |
N/A |
4 |
|
Questionnaire |
3.5 |
N/A |
2.5 |
4.5 |
||
|
CRI |
3.5 |
4.5 |
2.5 |
4 |
||
|
C2-2 200m |
Literature |
4 |
4 |
N/A |
3 |
|
|
Questionnaire |
4.5 |
N/A |
4 |
4 |
||
|
CRI |
4 |
4 |
4 |
3.5 |
||
|
C2-3 100m |
Literature |
3.5 |
2.5 |
N/A |
2.5 |
|
|
Questionnaire |
3 |
N/A |
3 |
4 |
||
|
CRI |
3 |
2.5 |
3 |
3 |
||
|
Group Layout |
C3-1 Aligned |
Literature |
N/A |
2 |
N/A |
3 |
|
Questionnaire |
N/A |
N/A |
4 |
3 |
||
|
CRI |
N/A |
2 |
4 |
3 |
||
|
C3-2 Peripheral |
Literature |
N/A |
3 |
N/A |
4 |
|
|
Questionnaire |
N/A |
N/A |
3 |
4.5 |
||
|
CRI |
N/A |
4 |
3 |
4 |
||
|
C3-3 Mixed |
Literature |
N/A |
3 |
N/A |
4 |
|
|
Questionnaire |
N/A |
N/A |
4 |
5 |
||
|
CRI |
N/A |
3 |
4 |
4.5 |
Table A3. Formulas and CR for each subcategory
|
Category |
Subcategory |
Formulas |
CR |
|
Enclosure |
C1-1 Open |
= 3*35% + N/A*30% + 3*15% + 4.5*20% |
2.25 |
|
C1-2 Semi-open |
= 4*35% + N/A*30% + 4*15% + 3.5*20% |
2.7 |
|
|
C1-3 Enclosed |
= 3*35% + N/A*30% + 4*15% + 3*20% |
2.25 |
|
|
Block Scale |
C2-1 400m |
= 3.5*35% + 4.5*30% + 2.5*15% + 4.5*20% |
3.85 |
|
C2-2 200m |
= 4*35% + 4*30% + 4*15% + 3.5*20% |
3.9 |
|
|
C2-3 100m |
= 3*35% + 2.5*30% + 3*15% + 3*20% |
2.8 |
|
|
Group Layout |
C3-1 Aligned |
= N/A*35% + 2*30% + 4*15% + 3*20% |
2.25 |
|
C3-2 Peripheral |
= N/A*35% + 4*30% + 3*15% + 4*20% |
2.45 |
|
|
C3-3 Mixed |
= N/A*35% + 3*30% + 4*15% + 4.5*20% |
2.25 |
Table A4. Reference and comprehensive ratings of ADI evaluation for architecture categories
|
Category |
Sub-Category |
Factors |
Pandemic 20% |
Energy & Carbon 50% |
Localization 10% |
Functionm 20% |
|
Height |
A1-1 Low-rise |
Literature |
4 |
4 |
N/A |
3 |
|
Questionnaire |
4.5 |
N/A |
1 |
2 |
||
|
CRI |
4 |
4 |
1 |
2 |
||
|
A1-2 Multi-story |
Literature |
3.5 |
3.5 |
N/A |
3.5 |
|
|
Questionnaire |
3.5 |
N/A |
3 |
4.5 |
||
|
CRI |
3.5 |
3.5 |
3 |
4 |
||
|
A1-3 High-rise |
Literature |
3 |
3 |
N/A |
4 |
|
|
Questionnaire |
2.5 |
N/A |
3 |
4.5 |
||
|
CRI |
2.5 |
3 |
3 |
4 |
||
|
A1-4 Super High-rise |
Literature |
3 |
3 |
N/A |
5 |
|
|
Questionnaire |
2 |
N/A |
1 |
4.5 |
||
|
CRI |
2.5 |
3 |
1 |
4.5 |
||
|
Structure |
A2-1 Wood |
Literature |
N/A |
5 |
N/A |
3 |
|
Questionnaire |
N/A |
N/A |
2 |
N/A |
||
|
CRI |
N/A |
5 |
2 |
3 |
||
|
A2-2 BC* |
Literature |
N/A |
3 |
N/A |
3 |
|
|
Questionnaire |
N/A |
N/A |
3.5 |
N/A |
||
|
CRI |
N/A |
3 |
3.5 |
3 |
||
|
A2-3 RC* |
Literature |
N/A |
2.5 |
N/A |
4 |
|
|
Questionnaire |
N/A |
N/A |
4.5 |
N/A |
||
|
CRI |
N/A |
2.5 |
4.5 |
4 |
||
|
A2-4 Steel |
Literature |
N/A |
4 |
N/A |
3.5 |
|
|
Questionnaire |
N/A |
N/A |
3 |
N/A |
||
|
CRI |
N/A |
4 |
3 |
3.5 |
||
|
Flat Type |
A3-1 Point-Block |
Literature |
N/A |
4 |
N/A |
3 |
|
Questionnaire |
N/A |
N/A |
4 |
2.5 |
||
|
CRI |
N/A |
4 |
4 |
2.5 |
||
|
A3-2 Panel-Block |
Literature |
N/A |
3 |
N/A |
3.5 |
|
|
Questionnaire |
N/A |
N/A |
3 |
3.5 |
||
|
CRI |
N/A |
3 |
3 |
3.5 |
||
|
A3-3 Point + Panel |
Literature |
N/A |
3.5 |
N/A |
4 |
|
|
Questionnaire |
N/A |
N/A |
3 |
4 |
||
|
CRI |
N/A |
3.5 |
3 |
4 |
||
|
A3-4 Complex |
Literature |
N/A |
2 |
N/A |
4 |
|
|
Questionnaire |
N/A |
N/A |
4 |
4.5 |
||
|
CRI |
N/A |
2 |
4 |
4 |
||
|
Base |
A4-1 300 m² |
Literature |
4 |
2.5 |
N/A |
3 |
|
Questionnaire |
3.5 |
N/A |
3 |
3 |
||
|
CRI |
3.5 |
2.5 |
3 |
3 |
||
|
A4-2 500 m² |
Literature |
4 |
3 |
N/A |
3.5 |
|
|
Questionnaire |
4 |
N/A |
4 |
4 |
||
|
CRI |
4 |
3 |
4 |
3.5 |
||
|
A4-3 1000 m² |
Literature |
3.5 |
4 |
N/A |
4 |
|
|
Questionnaire |
3.5 |
N/A |
3 |
4.5 |
||
|
CRI |
3.5 |
4 |
3 |
4 |
||
|
A4-4 2000 m² |
Literature |
3 |
4.5 |
N/A |
4 |
|
|
Questionnaire |
2.5 |
N/A |
2 |
4.5 |
||
|
CRI |
2.5 |
4.5 |
2 |
4 |
* BC is the abbreviation of Brick Concrete, RC is the abbreviation of Reinforced Concrete.
Table A5. Formulas and CR for each subcategory
|
Category |
Subcategory |
Formulas |
CR |
|
Height |
A1-1 Low-rise |
= 4*20% + 4*50% + 1*10% + 2*20% |
3.3 |
|
A1-2 Multi-story |
= 3.5*20% + 3.5*50% + 3*10% + 4*20% |
3.55 |
|
|
A1-3 High-rise |
= 2.5*20% + 3*50% + 3*10% + 4*20% |
3.1 |
|
|
A1-4 Super High-rise |
= 2.5*20% + 3*50% + 1*10% + 4.5*20% |
3.0 |
|
|
Structure |
A2-1 Wood |
= N/A*20% + 5*50% + 2*10% + 3*20% |
3.3 |
|
A2-2 BC* |
= N/A*20% + 3*50% + 3.5*10% + 3*20% |
2.45 |
|
|
A2-3 RC* |
= N/A*20% + 2.5*50% + 4.5*10% + 4*20% |
2.5 |
|
|
A2-4 Steel |
= N/A*20% + 4*50% + 3*10% + 3.5*20% |
3.0 |
|
|
Flat Type |
A3-1 Point-Block |
= N/A*20% + 4*50% + 4*10% + 2.5*20% |
2.9 |
|
A3-2 Panel-Block |
= N/A*20% + 3*50% + 3*10% + 3.5*20% |
2.5 |
|
|
A3-3 Point + Panel |
= N/A*20% + 3.5*50% + 3*10% + 4*20% |
2.85 |
|
|
A3-4 Complex |
= N/A*20% + 2*50% + 4*10% + 4*20% |
2.2 |
|
|
Base |
A4-1 300 m² |
= 3.5*20% + 2.5*50% + 3*10% + 3*20% |
2.85 |
|
A4-2 500 m² |
= 4*20% + 3*50% + 4*10% + 5*20% |
3.7 |
|
|
A4-3 1000 m² |
= 3.5*20% + 4*50% + 3*10% + 4*20% |
3.8 |
|
|
A4-4 2000 m² |
= 2.5*20% + 4.5*50% + 2*10% + 4*20% |
3.75 |
* BC is the abbreviation of Brick Concrete, RC is the abbreviation of Reinforced Concrete.
[1] Ji, W., Wang, W., Zhao, X., Zai, J., Li, X. (2020). Cross-species transmission of the newly identified coronavirus 2019-nCoV. Journal of Medical Virology, 92(4): 433-440. http://doi.org/10.1002/jmv.25682
[2] Lu, H., Stratton, C.W., Tang, Y.W. (2020). Outbreak of pneumonia of unknown etiology in Wuhan, China: The mystery and the miracle. Journal of Medical Virology, 92: 401-402. http://doi.org/10.1002/jmv.25678
[3] The World Bank Annual Report. (2019). Ending poverty, investing in opportunity. Washington, DC: World Bank. http://openknowledge.worldbank.org/entities/publication/dd8593ab-20ea-5c74-953a-0478f86d90e8.
[4] Oum, S., Kates, J., Wexler, A. (2022). Economic impact of COVID-19 on PEPFAR countries. Kaiser Family Foundation: Global Health Policy. http://www.kff.org/global-health-policy/issue-brief/economic-impact-of-covid-19-on-pepfar-countries/.
[5] Social-economic Impact of COVID-19. (2020). A UN framework for the immediate socio-economic response to COVID-19. United Nations Development Programme. http://www.undp.org/coronavirus/socio-economic-impact-covid-19.
[6] Sharifi, A., Khavarian-Garmsir, A.R., Allam, Z., Asadzadeh, A. (2023). Progress and prospects in planning: A bibliometric review of literature in Urban Studies and Regional and Urban Planning, 1956-2022. Progress in Planning, 100740. http://doi.org/10.1016/j.progress.2023.100740
[7] Yuan, Z., Hu, W. (2023). Urban resilience to socioeconomic disruptions during the COVID-19 pandemic: Evidence from China. International Journal of Disaster Risk Reduction, 91: 103670. http://doi.org/10.1016/j.ijdrr.2023.103670
[8] Sharifi, A. (2022). An overview and thematic analysis of research on cities and the COVID-19 pandemic: Toward just, resilient, and sustainable urban planning and design. iScience. 25(11): 105297. http://dpo.org/10.1016/j.isci.2022.105297
[9] Ma, J., Wang, X., Wang, Y., Chu, X., Zhao, J. (2023). An adaptive fusion risk-zone detection network and its application. International Journal of Pattern Recognition and Artificial Intelligence, 37(06): 2350014. http://doi.org/10.1142/S0218001423500143
[10] Ma, S., Li, S., Zhang, J. (2023). Spatial and deep learning analyses of urban recovery from the impacts of COVID-19. Nature, 13: 2447. http://doi.org/10.1038/s41598-023-29189-5
[11] Qiao, M., Huang, B. (2023). COVID-19 spread prediction using socio-demographic and mobility-related data. Cities, 138: 104360. http://doi.org/10.1016/j.cities.2023.104360
[12] Lara, D., Pfaffenbichler, P., Silva, A. (2023). Modeling the resilience of urban mobility when exposed to the COVID-19 pandemic: A qualitative system dynamics approach. Sustainable Cities and Society, 91: 104411. http://doi.org/10.1016/j.scs.2023.104411
[13] Yang, L., Iwami, M., Chen, Y., Wu, M., van Dam, K.H. (2023). Computational decision-support tools for urban design to improve resilience against COVID-19 and other infectious diseases: A systematic review. Progress in Planning, 168: 100657. http://doi.org/10.1016/j.progress.2022.100657
[14] Huang, Q., Chen, Y.Y. (2020). Wuhan lockdown: Reflections on the public health and urban space of COVID-19 epidemic. Advances in Educational Technology and Psychology, 17(3): 120-127. http://doi.org/10.23977/ETSS2020022
[15] Huang, Q. (2020). Inspirations of the Wuhan lockdown on global urban public health under the outbreak of COVID-19 epidemic. Sustainable Development, 10(3): 381-388. http://doi.org/10.12677/SD.2020.103046
[16] Afrin, S., Chowdhury, F.J., Rahman, M.M. (2021). COVID-19 pandemic: Rethinking strategies for resilient urban design, perceptions, and planning. Frontier in Sustainable Cities, 3: 668263. http://doi.org/10.3389/frsc.2021.668263
[17] Xiao, L., Liu, J. (2023) Exploring non-linear built environment effects on urban vibrancy under COVID-19: The case of Hong Kong. Applied Geography, 155: 102960. http://doi.org/10.1016/j.apgeog.2023.102960
[18] Rahman, M.S., Paul, K.C., Rahman, M.M., Samuel, J., Thill, J.C., Hossain, M.A., Ali, G.G.M.N. (2023). Pandemic vulnerability index of US cities: A hybrid knowledge-based and data-driven approach. Sustainable Cities and Society, 95: 104570. http://doi.org/10.1016/j.scs.2023.104570
[19] Palomo, A., Teresa, R. (2023). Effect of green infrastructures supported by adaptative solar shading systems on livability in open spaces. Urban Forestry & Urban Greening, 82: 127886. http://doi.org/10.1016/j.ufug.2023.127886
[20] Mouratidis, K. (2021). How COVID-19 reshaped quality of life in cities: A synthesis and implications for urban planning. Land Use Policy, 111: 105772. http://doi.org/10.1016/j.landusepol.2021.105772
[21] Kim, C., Kim, J. (2023). Spatial spillovers of sport industry clusters and community resilience: Bridging a spatial lens to building a smart tourism city. Information Processing & Management. 60(3): 103266. http://doi.org/10.1016/j.ipm.2023.103266
[22] Yuan, Q., Gasco-Hernandez, M., Gil-Garcia, J.R., Cook, M.E., Pardo, T.A. (2023). Continuity of operations and organisational resilience during the COVID-19 pandemic: Lessons from city governments in the US northeast region. Public Management Review, pp. 1-21. http://doi.org/10.1080/14719037.2023.2222763
[23] Chu, D.C. (2023). Perceived stress and mental health during the pandemic of COVID-19: An examination of Taiwanese police officers. Policing: An International Journal, 46(3): 535-552. https://doi.org/10.1108/PIJPSM-12-2022-0158
[24] Fieger, P., Prayag, G., Dyason, D., Rice, J., Hall, C.M. (2023). Exploring CBD retail performance, recovery and resilience of a smart city following COVID-19. Sustainability, 15(10): 8300. http://doi.org/10.3390/su15108300
[25] Wei, Y., Wang, S., Dang, H., Liu, P. (2022). Climate adaptability analysis on the shape of outpatient buildings for different climate zones in China based on low-energy target. Atmosphere, 13(12): 2121. http://doi.org/10.3390/atmos13122121
[26] Chen, Q., Sun, Z., Li, W. (2023). Effects of COVID-19 on residential planning and design: A scientometric analysis. Sustainability, 15(3): 2823. http://doi.org/10.3390/su15032823
[27] Armstrong, G., Wilkinson, S., Cilliers, E.J. (2023). A framework for sustainable adaptive reuse: Understanding vacancy and underuse in existing urban buildings. Frontiers in Sustainable Cities, 5: 985656. http://doi.org/10.3389/frsc.2023.985656
[28] Global Platform for Sustainable Cities; World Bank. (2018). Urban Sustainability Framework: 1st ed (English). Washington, D.C.: World Bank Group.
[29] Urquiza, A., Amigo, C., Billi, M., Calvo, R., Gallardo, L., Neira, C.I., Rojas, M. (2021). An integrated framework to streamline resilience in the context of urban climate risk assessment. Earth's Future, 9(9): e2020EF001508. http://doi.org/10.1029/2020EF001508
[30] Mouratidis, K. (2021). How COVID-19 reshaped quality of life in cities: A synthesis and implications for urban planning. Land Use Policy, 111: 105772. http://doi.org/10.1016/j.landusepol.2021.105772
[31] Amirzadeh, M., Sobhaninia, S., Buckman, S.T., Sharifi, A. (2023). Towards building resilient cities to pandemics: A review of COVID-19 literature. Sustainable Cities and Society, 89: 104326. http://doi.org/10.1016/j.scs.2022.104326
[32] Indirli, M., Borg, R.P., Formisano, A., Martinelli, L., Marzo, A., Romagnoli, F., Romanelli, F. (2023). Building resilience in times of new global challenges: A focus on six main attributes. Research Geohazards and Disaster Risk Reduction, 51: 293-319. http://doi.org/10.1007/978-3-031-24541-1_14
[33] Asadzadeh, A., Khavarian-Garmsir, A.R., Sharifi, A., Salehi, P., Kötter, T. (2022). Transformative resilience: An overview of its structure, evolution, and trends. Sustainability, 14(22): 15267. http://doi.org/10.3390/su142215267
[34] Walker, J., Cooper, M. (2011). Genealogies of resilience: From systems ecology to the political economy of crisis adaptation. Security Dialogue, 42(2): 143-160. http://doi.org/10.1177/0967010611399616
[35] Northern Metropolis Development Strategy. (2021). Report. The government of the Hong Kong special administrative. http://www.policyaddress.gov.hk/2021/eng/pdf/publications/Northern/Northern-Metropolis-Development-Strategy-Report.pdf.
[36] Chen, M., Chen, L., Cheng, J., Yu, J. (2022). Identifying interlinkages between urbanization and sustainable development goals. Geography and Sustainability, 3(4): 339-346. http://doi.org/10.1016/j.geosus.2022.10.001
[37] Takane, Y., Nakajima, K., Kikegawa, Y. (2022). Urban climate changes during the COVID-19 pandemic: Integration of urban-building-energy model with social big data. NPJ Climate and Atmospheric Science, 5(1): 44. http://doi.org/10.1038/s41612-022-00268-0
[38] Patton, D., Durand, A., Whipple, K., Albright, D.L. (2022). Local autonomy and response to the COVID-19 pandemic. State and Local Government Review, 54(2): 165-173. http://doi.org/10.1177/0160323X221089661
[39] Ying, D., Wu, W. (2023). Urbanization is the irresistible trend of development in China (Introduction). A study of China's urban-rural integration development, pp. 1-27. http://doi.org/10.1007/978-981-19-2756-0_1
[40] Manual for Streets. (2007). Movement and place. London: Department of transport. http://assets.publishing.service.gov.uk/government/uploads/system/uploads/attachment_data/file/341513/pdfmanforstreets.pdf.
[41] Barr, J.M. (2018). Building height and greenhouse gas emissions: The case of New York City. Building the Skyline. http://buildingtheskyline.org/building-height-and-co2/.
[42] Mohammed, M., Beydoun, Z., Refaat, A. (2023). Adaptive design guidelines for health-based promenades in Jeddah City. Civil Engineering and Architecture, 11(4): 2040-2071. http://doi.org/10.13189/cea.2023.110427
[43] Lamberto, A., Tomasz, B., Barbara, U.B. (2023). Resilient university campus in the city in COVID and post-COVID era—Recommendations, guidelines, and evidence from research in Italy and Poland. Urban Design International, 28(2): 141-151. http://doi.org/10.1057/s41289-022-00211-y
[44] Ariyaningsih, R. (2023). Community-based approach for climate resilience and COVID-19: Case study of a climate village (Kampung Iklim) in Balikpapan, Indonesia. Land, 12(3): 650. http://doi.org/10.3390/land12030650
[45] Kamruzzaman, M.M., Alanazi, S., Alruwaili, M., Alshammari, N., Elaiwat, S., Abu-Zanona, M., Innab, N., Elzaghmouri, B.M., Ahmed Alanazi, B. (2023). AI-and IoT-assisted sustainable education systems during pandemics, such as COVID-19, for smart cities. Sustainability, 15(10): 8354. http://doi.org/10.3390/su15108354
[46] Chapman Cook, M., Karau, S.J. (2023). Opportunity in uncertainty: Small business response to COVID-19. Innovation and Management Review, 20(2): 162-178. http://doi.org/10.1108/INMR-11-2021-0226
[47] Kanelli, A.A., Kokkinaki, M., Sinvare, M.D., Malesios, C., Dimitrakopoulos, P.G., Kalantzi, O.I. (2023). Keep calm and go out: Urban nature exposure, mental health, and perceived value during the COVID-19 lockdown. Sustainability, 15(11): 8831. http://doi.org/10.3390/su15118831
[48] Hollenberg, A.M., Yanik, E.L., Hannon, C.P., Calfee, R.P., O’Keefe, R.J. (2022). Did the physical and mental health of orthopaedic patients change after the onset of the COVID-19 pandemic? Clinical Orthopaedics and Related Research®, 10-1097. http://doi.org/10.1097/CORR.0000000000002555
[49] Quaglio, C., Todella, E., Lami, I.M. (2021). Adequate housing and COVID-19: Assessing the potential for value creation through the project. Sustainability, 13(19): 10563. http://doi.org/10.3390/su131910563
[50] Mayen Huerta, C. (2022). Rethinking the distribution of urban green spaces in Mexico City: Lessons from the COVID-19 outbreak. Urban Forestry & Urban Greening, 70: 127525. http://doi.org/10.1016/j.ufug.2022.127525
[51] Bikomeye, J.C., Namin, S., Anyanwu, C., Rublee, C.S., Ferschinger, J., Leinbach, K., Lindquist, P., Hoppe, A., Hoffman, L., Hegarty, J., Sperber, D., Beyer, K.M. (2021). Resilience and equity in a time of crises: Investing in public urban greenspace is now more essential than ever in the US and beyond. International Journal of Environmental Research and Public Health, 18(16): 8420. http://doi.org/10.3390/ijerph18168420
[52] Cinquepalmi, F., Paris, S., Pennacchia, E., Tiburcio, V.A. (2023). Efficiency and sustainability: The role of digitization in re-inhabiting the existing building stock. Energies, 16(9): 3613. http://doi.org/10.3390/en16093613